
TradingEdge Weekly for Mar 27 - Healthcare sector recovery signals, small-cap breadth trap, utilities opportunity, gold extreme bearishness

Key points:
- Healthcare sector (XLV) shows extreme oversold breadth signals with 100% historical win rate over 12 months
- Small-cap Russell 2000 rapid correction with strong internals creates a dangerous breadth trap
- Gold (GLD) extreme pessimism and miner capitulation suggest contrarian opportunity
- Fear & Greed Model hits historic lows, signaling near-term volatility but medium-term recovery potential
- Utilities (XLU) oversold conditions align with favorable seasonal window
House view:
- Stocks:
- Short-term: Bearish. Currently, nearly all indicators are unfavorable, as detailed in the "Where we're at" section. U.S. equities suffer a broad-based violent selloff, with all three major indices confirming a deep technical breakdown. The S&P 500 plunges 1.74% to 6,477.16, decisively breaking below its 200-day moving average (6,633.18); the Nasdaq Composite crashes 2.38% to 21,408.08, officially entering correction territory (down over 10% from recent highs); the Dow Jones falls 1.01% to 45,960.1, breaching the 46,000 psychological level. Core drivers include the total collapse of U.S.-Iran ceasefire talks, a toxic "high oil prices + high inflation expectations + high interest rates" combo. This time frame covers 1-4 weeks.
- Intermediate-term: Bearish. Market momentum continues to weaken and is now in a risk-off state. The market has confirmed a medium-term downtrend, with the stagflation narrative fully taking hold. Sustained high oil prices are eroding corporate profit margins, while the bond market has completely priced out near-term Fed rate cuts, leaving no policy backstop for equity valuations. This time frame covers 1-5 months.
- Long-term: Bearish. The long-term bull market structure has been invalidated by the decisive break below the 200-day moving average, the critical bull-bear lifeline. The market has shifted definitively from buy-the-dip AI euphoria to extreme risk aversion. There is no long-term bullish edge until indices reclaim the 200-day MA with sustained volume and the stagflation risk backdrop abates. This time frame covers 6-12 months.
- Overweight: High levels of U.S. dollar cash, short-duration safe-haven assets
- Energy and inflation-hedge sectors are the only areas with relative outperformance in the stagflation regime
- Avoid leveraged positions in commodities and equities amid extreme volatility and liquidity risks
- Bonds: Long-term cycles remain bearish. A rare "stock-bond dual selloff" regime has taken hold, with Treasury yields surging despite the equity meltdown. The 10Y-2Y spread holds at +46 bps, with the curve pricing in entrenched stagflation risks. The market is pricing in entrenched long-term inflation, as surging oil prices drive an unexpected jump in import prices, eliminating near-term Fed rate cut bets and forcing investors to demand higher inflation risk premiums for long-dated debt.
- Commodities: Extreme volatility and divergent price action define the complex, driven by geopolitical tensions and a global liquidity crunch. The crude oil closes at $94.48. Prices are trapped in a violent tug-of-war between Iran's rejection of the U.S. ceasefire proposal (and threats to close the Strait of Hormuz) and President Trump's 10-day pause on strikes against Iranian energy facilities. The market remains in a state of extreme supply uncertainty, with no clear directional trend in the near term. Gold falls 2.9% to $4376.11, while silver crashes 4.4% to $68.06. Traditional safe-haven demand has been completely overridden by a severe liquidity crunch. Gold prices remain highly volatile at present, and further selling pressure may emerge in the short term. Investors are advised not to rush into the market to buy at the bottom until volatility begins to subside and prices stabilize.
- Notable Moves in Global Markets:
- Europe: The pan-European STOXX 600 falls 1.13%, with the UK FTSE 100 down 1.33%, France CAC 40 down 0.98%, and Germany DAX down 1.5%. The region's extreme reliance on energy imports leaves it acutely vulnerable to Middle East supply disruptions, with the ECB trapped in an impossible dilemma between resurgent inflation and a stagnating economy. Energy-sensitive sectors see massive capital outflows, with no offsetting positive catalysts.
- Hong Kong: The Hang Seng Index plummets 1.89% to 24,856.43, while the Hang Seng Tech Index crashes 3.55%. The selloff is driven by Wall Street's risk-off spillover, paired with severe earnings misses from local consumer and tech giants.
- Japan: The Nikkei 225 edges down 0.27% to 53,603.65, caught between dual external and internal pressures. Externally, the Middle East crisis threatens Japan's energy security (over 90% of its oil is imported from the region); internally, the BOJ is facing growing pressure to accelerate rate hikes to combat imported inflation.
Where we're at
Most investors have the most riding on equities. We feel that the most significant determinants of success for investors are whether to adjust their allocation to that asset class based on factors that have historically had a good record of preceding above- or below-random returns in the months ahead.
Those factors include the probability of a looming recession, sentiment, price action, volatility, breadth, and the bond market. The chart below summarizes the main indicators and composite models we watch for those factors, and they're mostly in bullish regimes. Valuations are not part of these factors since the relationship has been too inconsistent on time frames under one year.
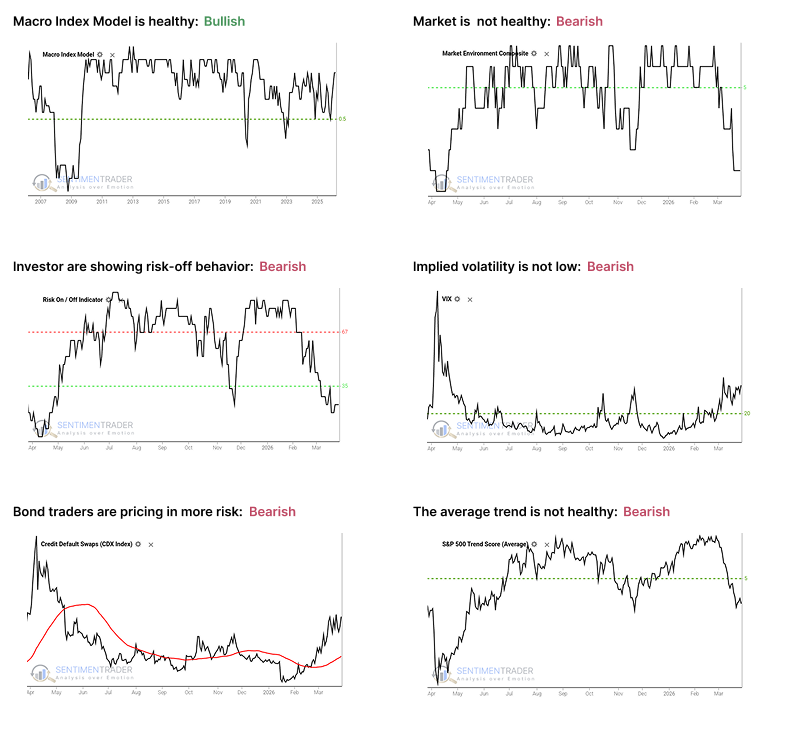
- The Macro Index Model is above the 50% threshold, which has been a vital level as outlined here.
- The Market Environment has been skittish since April, and has slipped into an unhealthy condition. Future returns, especially for higher-beta indices, have historically been notably weaker, with greater risk, when the environment is unhealthy as outlined here.
- The Risk On / Off Indicator shows that investors are now in risk-off mode. This has historically been a warning sign for weak future returns as outlined here.
- Implied volatility is at or above 20, signaling a volatile environment. The S&P 500 has historically performed poorly when this is the case, as outlined here.
- Credit default swap spreads are above their 50-day moving average, which is modestly concerning as outlined here.
- A composite of trend measures in the average S&P 500 stock have dropped below 5, which shows weak trend conditions.
Healthcare: Extreme breadth compression signals recovery
Health Care (XLV) has suffered severe breadth compression, but extreme oversold readings are currently triggering high-probability historical buy signals.
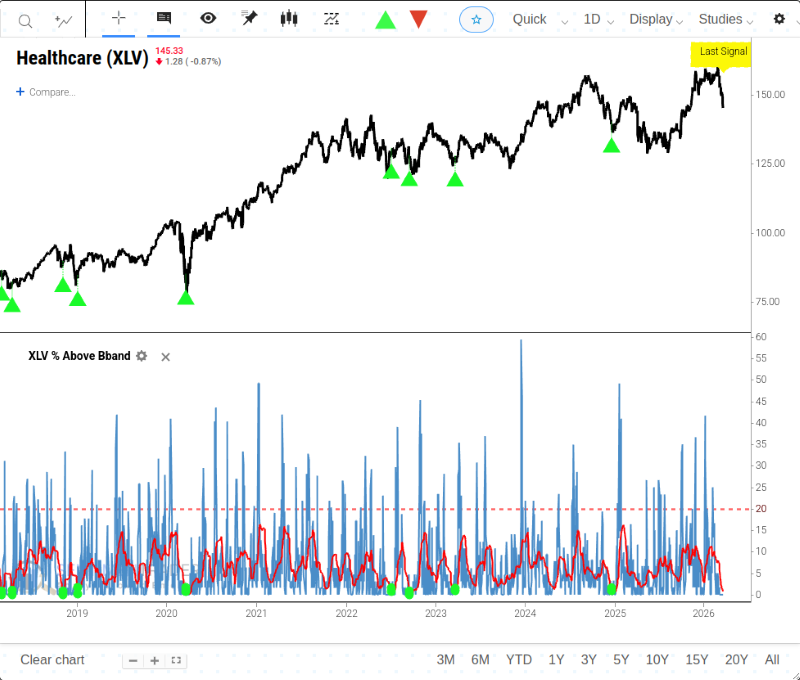
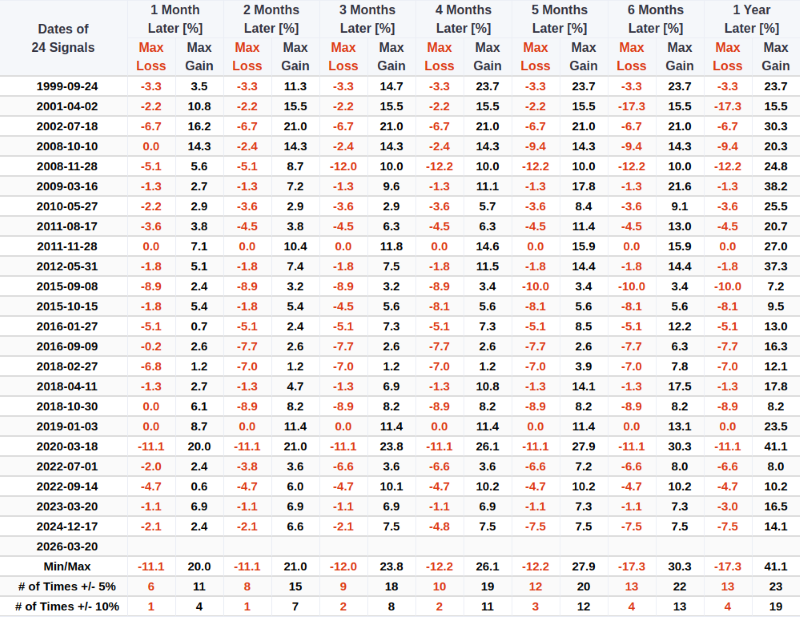
The 20-day moving average of XLV constituents trading above their upper Bollinger Band has collapsed below 1%, an extreme momentum washout that has historically yielded a 100% win rate over the forward 12-month period.
At our desk, we frequently field two distinct questions regarding the Health Care sector right now. The first: \"Will this battered sector eventually recover?\" As the data will show, there is ample evidence to answer with a definitive \"yes.\" The second, more pressing question: \"Is now the right time to buy?\" That is inherently more difficult to time perfectly.
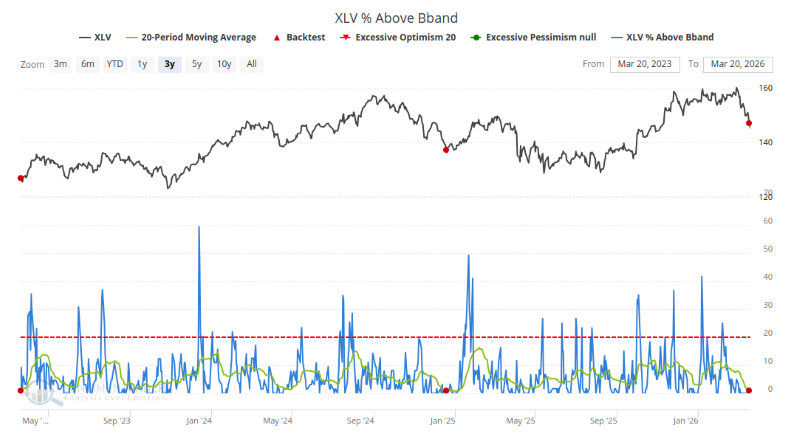
The chart below highlights instances where the 20-day moving average of the percentage of XLV constituents trading above their upper Bollinger Band dropped below 1. The most recent signal fired on Mar 20, 2026.
The table below details the signal-by-signal forward returns. When this Bollinger Band participation metric drops below 1, XLV has posted a flawless 100% win rate over the subsequent one-year timeframe.
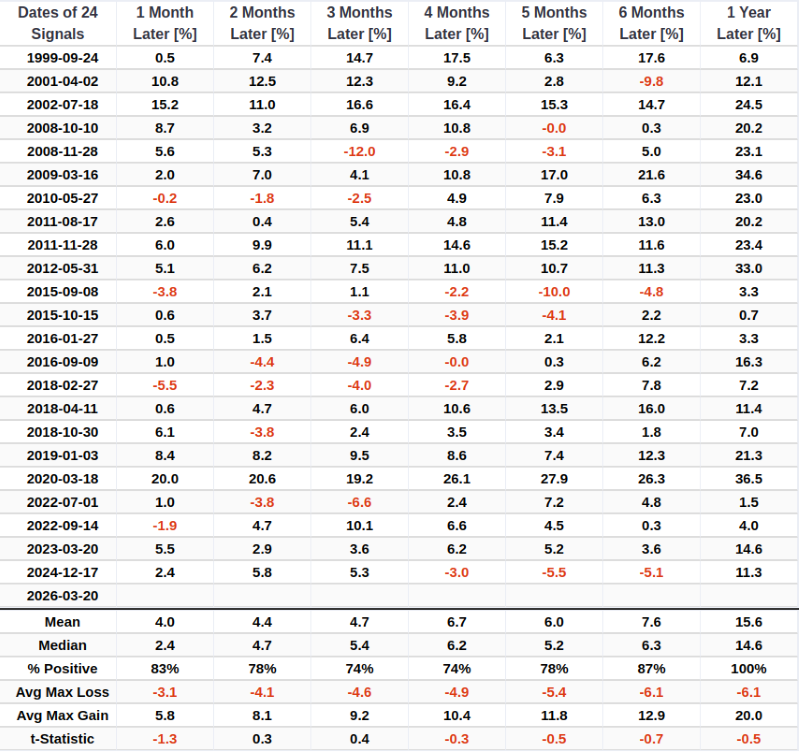
Looking at the distribution of maximum gains versus maximum losses over that one-year forward window, the sector experienced a max gain exceeding 10% on 19 occasions, compared to a max drawdown exceeding -10% on only 4 occasions. This sharply skewed ratio confirms that the statistical edge is firmly with the bulls at these levels.
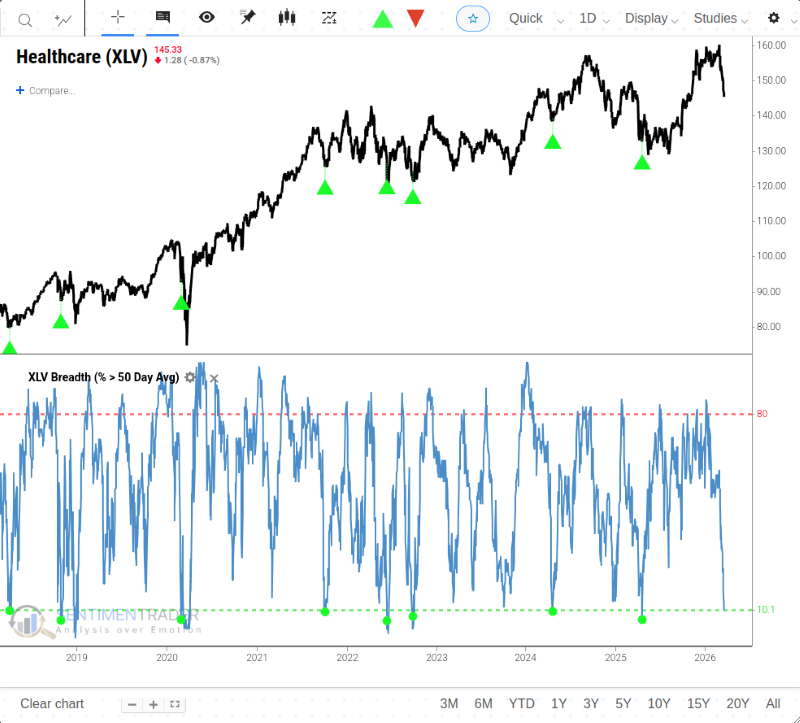
Our intermediate-term breadth indicator-XLV Breadth (% > 50 Day Avg)-experienced a violent compression, plunging from a robust 85% at the start of the year down to a depressed 10% last Friday. To historically contextualize this exact market environment, we ran a screen for instances where this metric crossed below the 10.1% threshold after recently peaking above 80%.
The chart below displays historical occurrences of this breadth collapse.
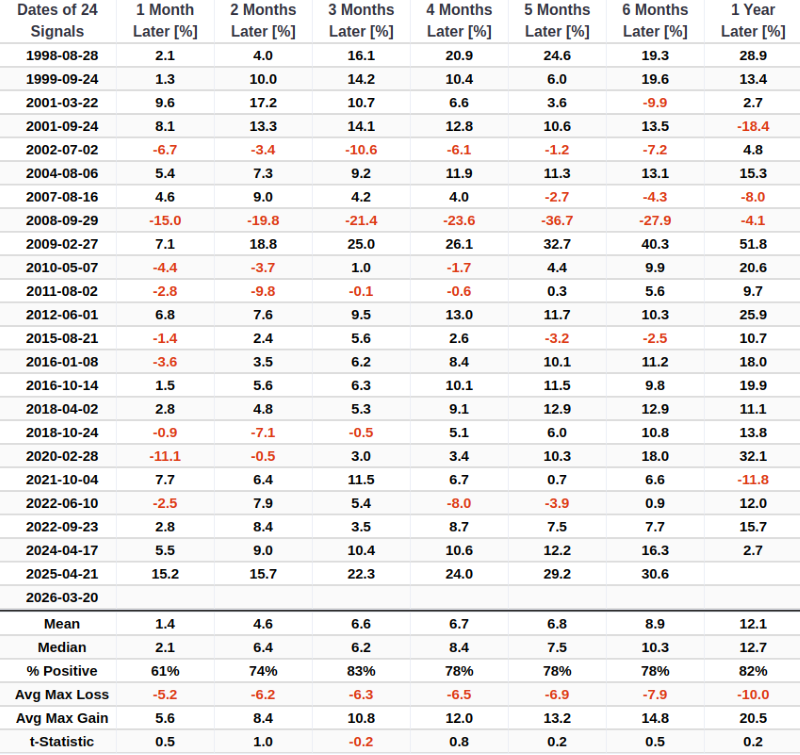
The table below shows the individual results and performance of all signals. This signal indicates that XLV is likely to trend upward in the medium to long term.
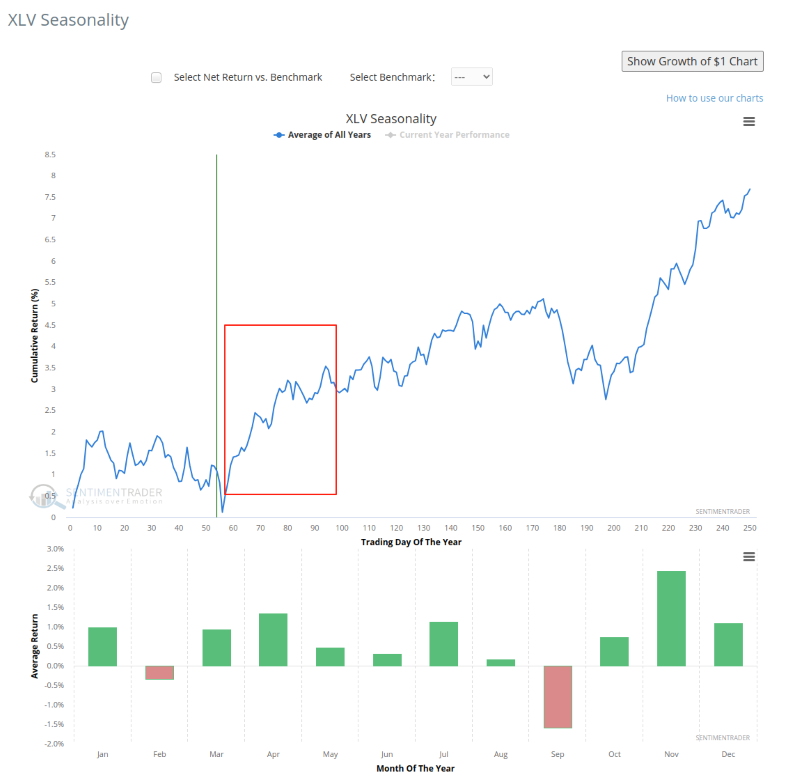
The chart below details the annualized seasonal trend for the Health Care sector (XLV), indicating that we are entering a historically strong period for the asset class.
Healthcare: Sentiment, seasonality and insider buying align
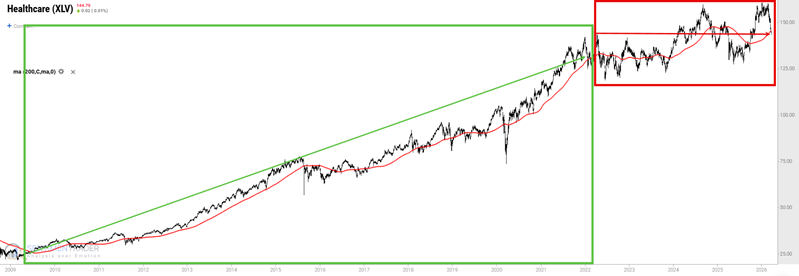
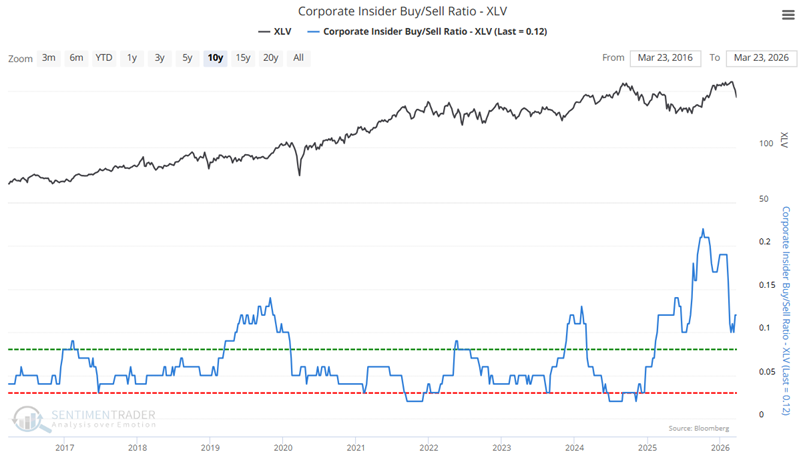
After thirteen years of steady gains, the Healthcare sector has essentially traded sideways over the past four years. Regarding the short-term, trader sentiment recently fell to a low enough level to flash a favorable contrarian signal, and seasonality is entering the most favorable time of the year for the Healthcare sector. Additionally, corporate insiders have spent much of the last year heavily buying their own shares.
Our XLV Optix indicator measures trader sentiment for a given index, sector, or commodity. Low readings suggest a lack of bullishness, which is generally interpreted in a contrarian manner. The chart below highlights all dates when the 10-day average for XLV Optix was below 20, including all overlapping signals.
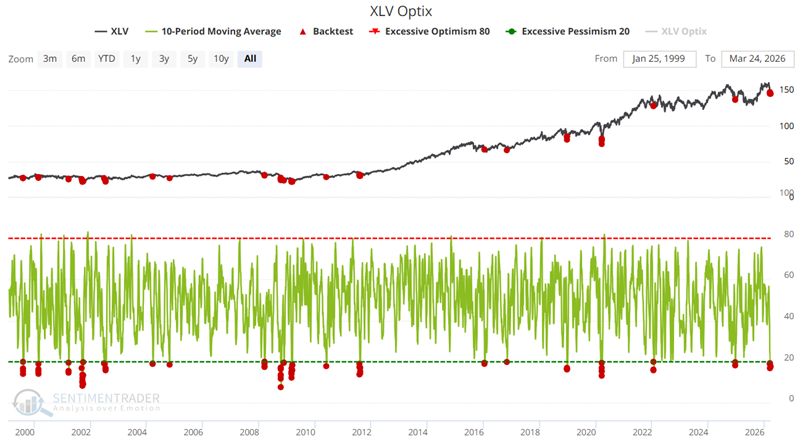
The table below summarizes subsequent XLV performance. Note the 89% Win Rate and 6.18% median gain for 1 month after all signals.

The 21-trading-day holding period for the signal generated on March 18th runs through the close on April 17th.
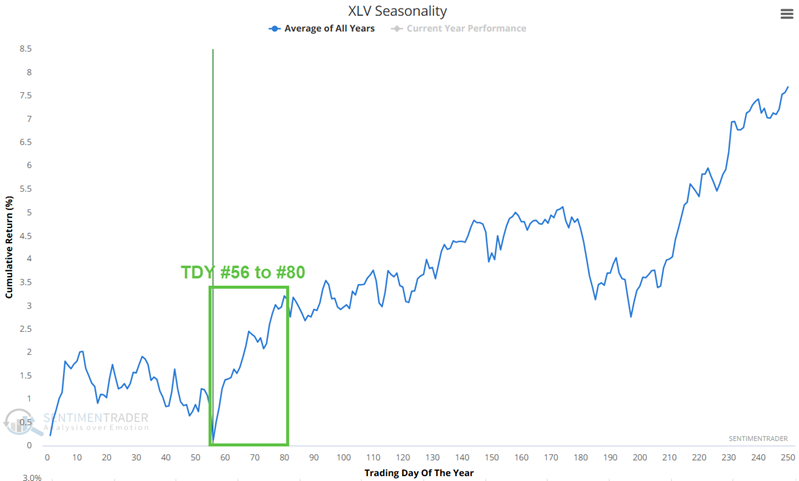
The Healthcare sector is entering a typically favorable seasonal period. The chart below shows the Annual Seasonal Trend for XLV. The period highlighted extends from Trading Day of Year (TDY) #56 through TDY #80. For 2026, this extends from the close on March 24th through April 28th.
The chart below shows our Corporate Insider Buy/Sell Ratio - XLV. Note the heavy buying that has taken place in the last year, despite the lack of significant upside price action.
Small caps: Strong internals during breakdown create trap
The Russell 2000 just completed a rapid -10% correction from a three-year high. Historical base rates for this specific technical breakdown skew bearish over the next two to three months. Counterintuitively, strong underlying breadth during the breakdown has historically led to worse intermediate-term outcomes.
The relentless small-cap rally hit a wall last week. On March 20, the Russell 2000 closed 10% below its recent three-year high. The speed matters. This reversal played out in under 30 days, catching offsides a market positioned for an uninterrupted expansion.
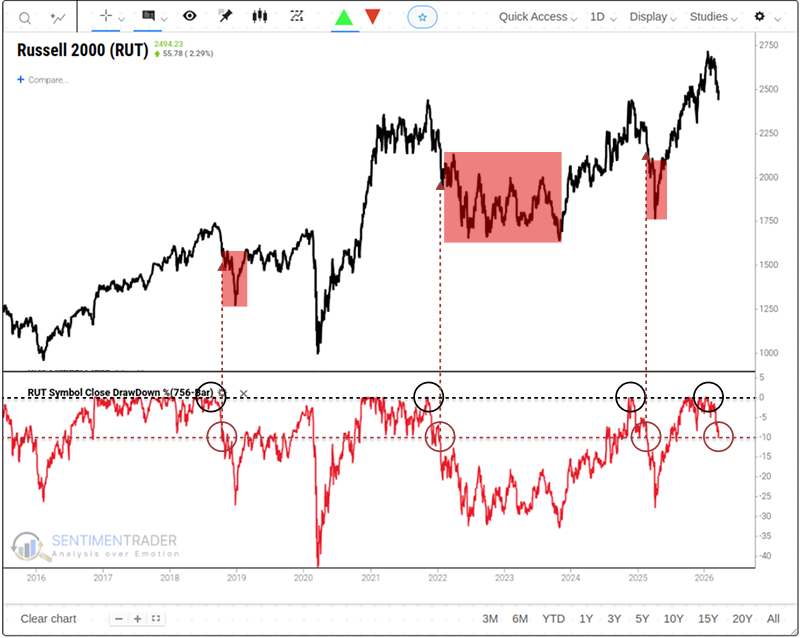
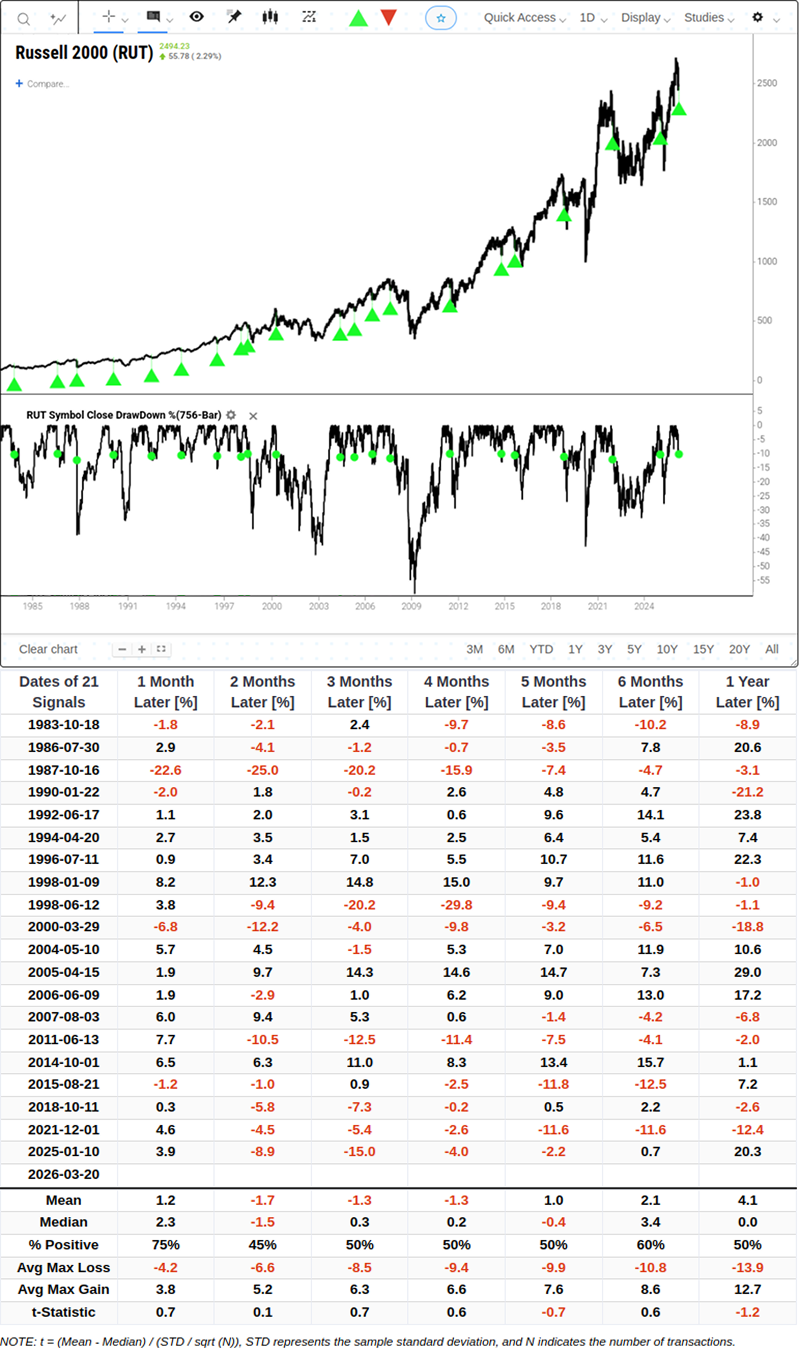
Across the 21 times the index has fallen from a three-year high into a correction since 1983, the forward returns are persistently choppy. Over the following two months, the index was higher only 45% of the time, averaging a 1.7% loss.
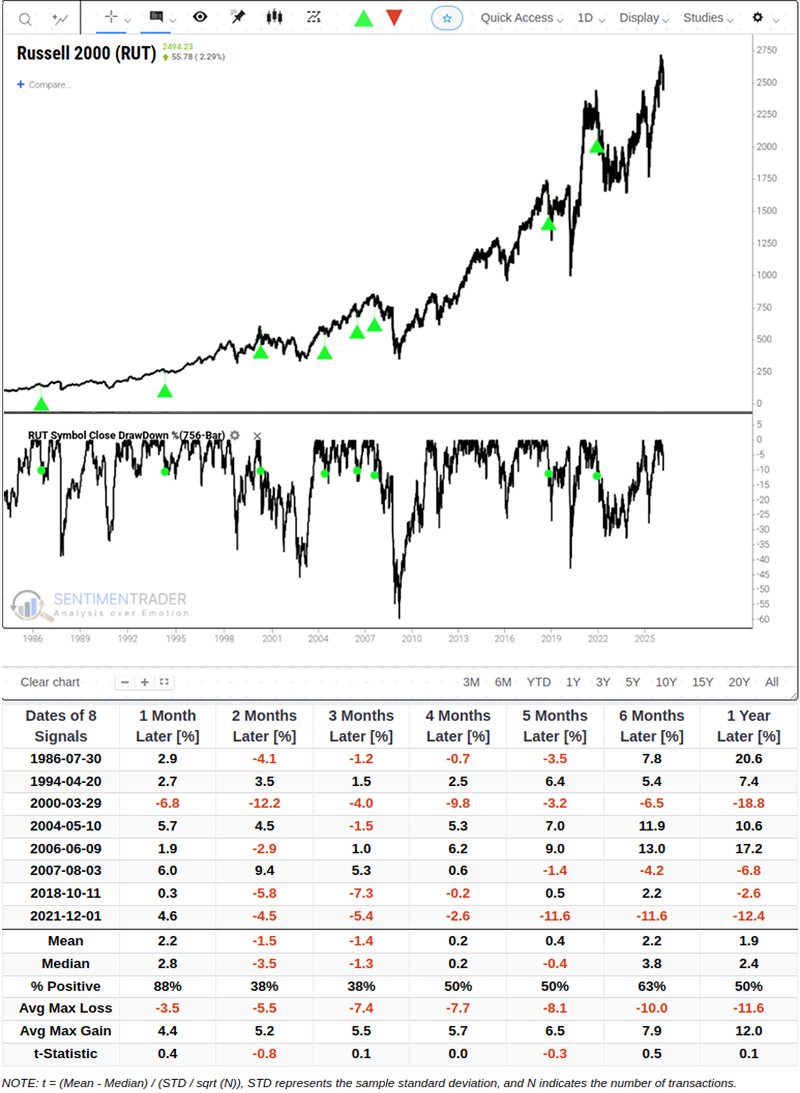
Fast reversals compound the near-term weakness. Narrowing the lens to corrections that materialized within 30 trading days leaves only eight prior signals. The two- and three-month forward returns for this cohort are dismal. The index was positive just 38% of the time across both windows, averaging outright losses.
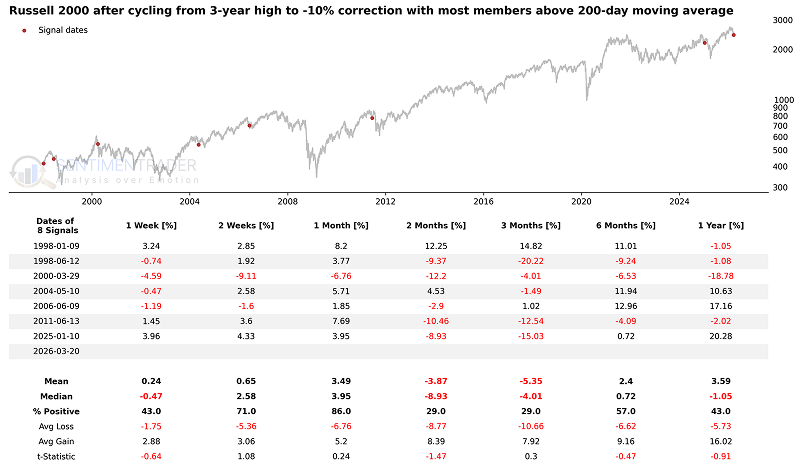
Counterintuitively, resilient internals make the setup more dangerous. We typically view strong underlying participation as a structural shock absorber during index-level drawdowns. The data points the other way. When the Russell 2000 drops into a correction with the majority of its members still holding above their 200-day moving averages, the selling tends to accelerate.
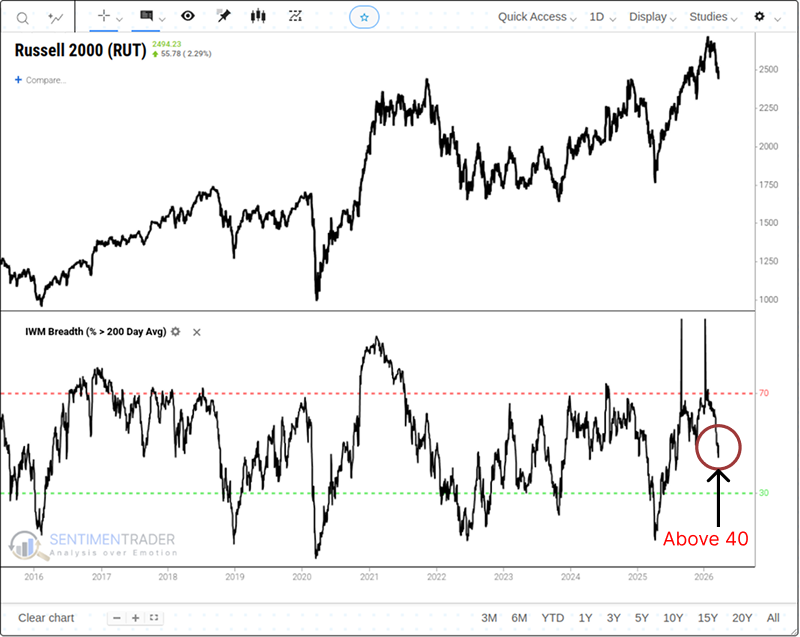
Across the eight signals featuring the strongest breadth, the two- and three-month forward returns were positive only 29% of the time. The index averaged a loss of roughly 4% to 5% over those windows, and the one-year win rate drops below a coin flip.
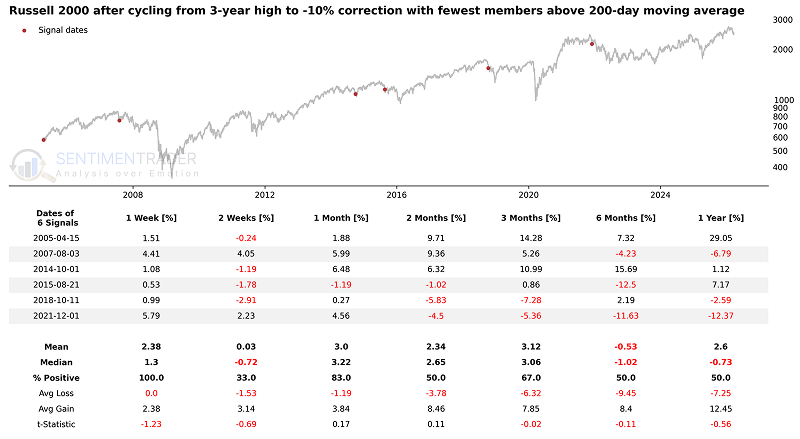
Compare that to corrections driven by entirely washed-out markets. When the fewest members hold their long-term averages at the time of the signal, the near-term returns flip positive. Over the following month, the index was higher 83% of the time.
Gold: Extreme bearishness creates contrarian opportunity
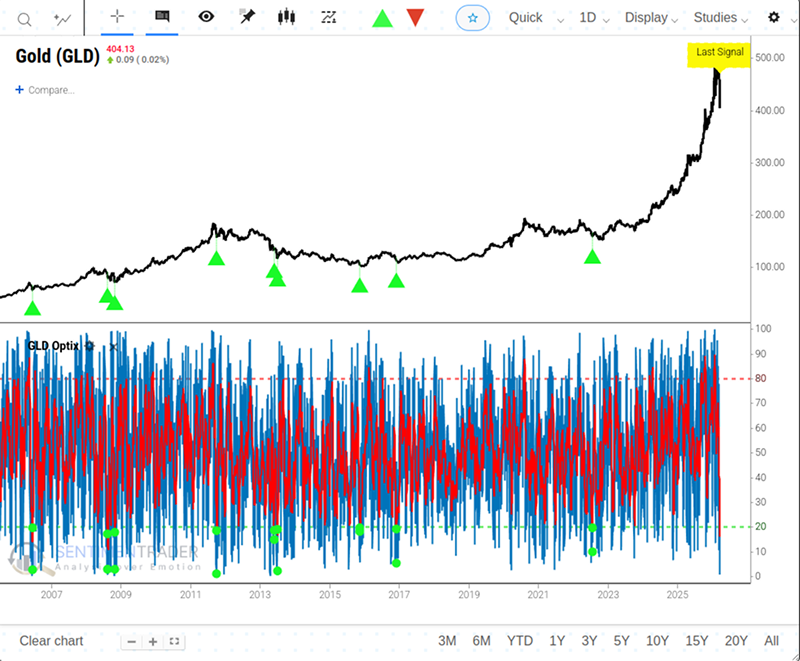
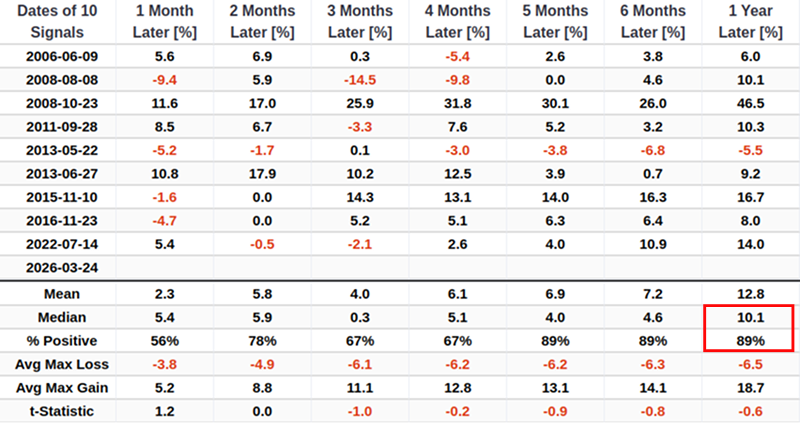
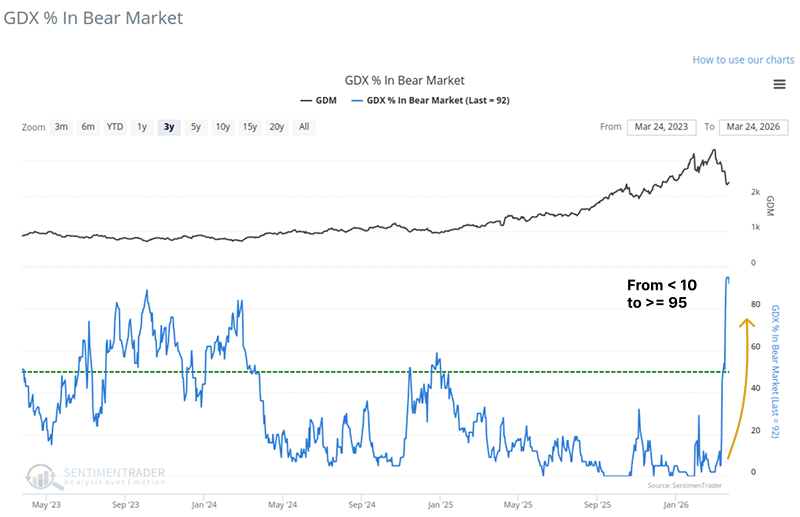
Trader sentiment for the SPDR Gold Shares (GLD) just touched an extreme level. Following similar sentiment washouts, GLD has posted an 89% win rate over the subsequent 12 months, with median returns over 10% and a risk/reward profile that heavily favors the upside. GLD recently suffered a rapid ~18.5% drawdown from its 52-week highs. Gold miners are in a state of total capitulation with 95% of constituents now technically in a bear market.
The flush-out of gold presents a compelling quantitative setup. The Optix indicator for the SPDR Gold Trust (GLD) is now severely oversold, with its latest reading at 19.11. Crucially, despite the recent plunge, GLD remains above its 200-day moving average, indicating the secular uptrend remains intact.
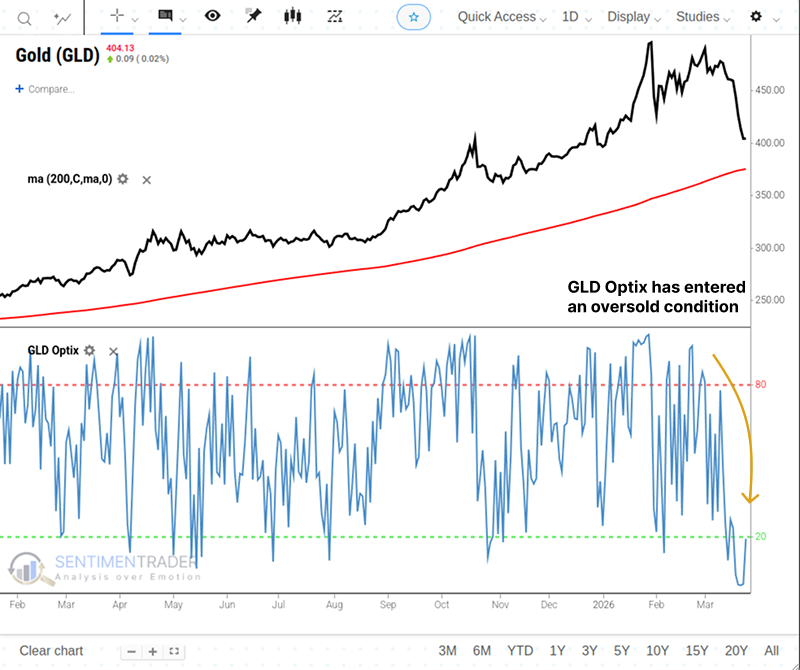
Our GLD Optix indicator is a proprietary composite based on put/call trading activity, future volatility expectations, average discount to NAV, and price behavior. The Optix ranges from 0 (maximum pessimism) to 100 (maximum optimism).
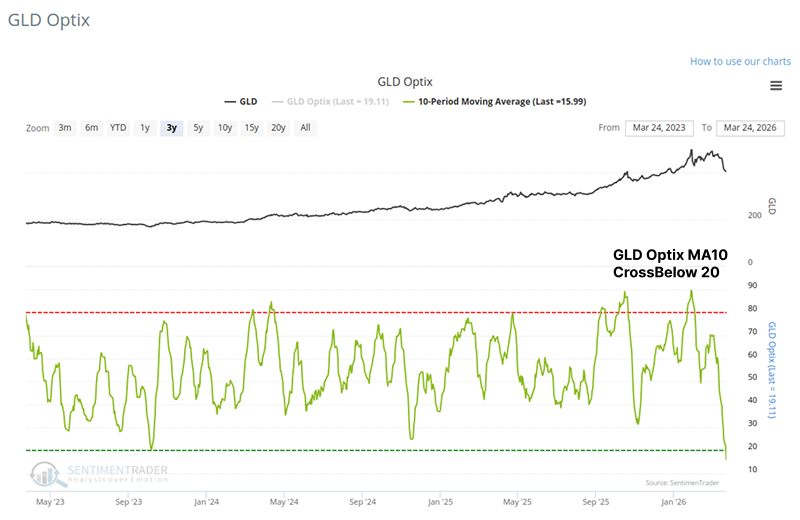
The chart below highlights all dates when the 10-day average of GLD Optix dropped below 20% (meaning 80% of traders were persistently bearish over a two-week period). The most recent signal triggered on Mar 24, 2026.
The table below summarizes GLD's forward performance following these extreme pessimism readings. The most striking takeaway is the robustness of the long-term data: an 89% win rate over a one-year horizon with a median return of +10.1%.
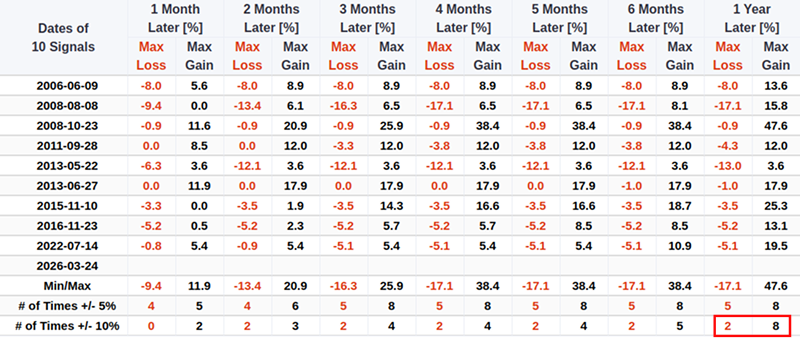
Over the one-year windows, GLD is roughly four times more likely to experience a 10% gain than a 10% drawdown.
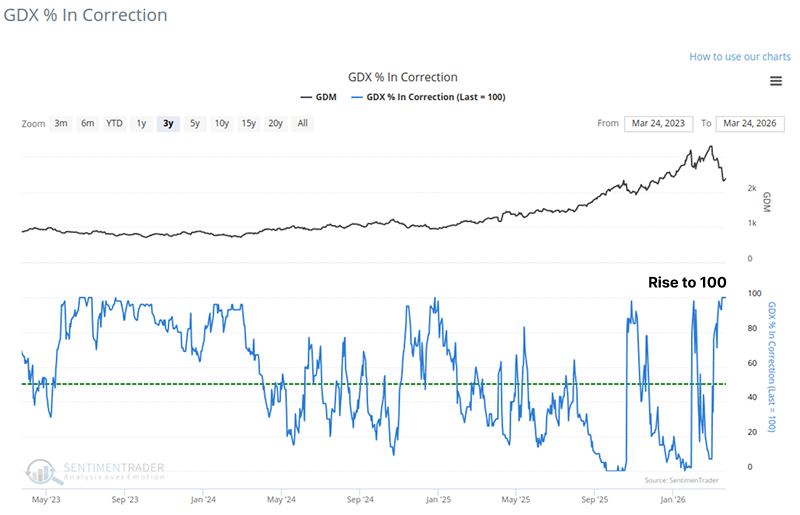
A key metric we track is GDX % In Bear Market (down more than 20% from their 52-week highs). Just one month ago, very few stocks met this criterion; as of last week, a staggering 95% of the sector is now in a bear market.
The table below details the forward returns for the Gold Miners ETF (GDX) when the percentage of its constituents in a bear market spikes from under 10% to 95%.
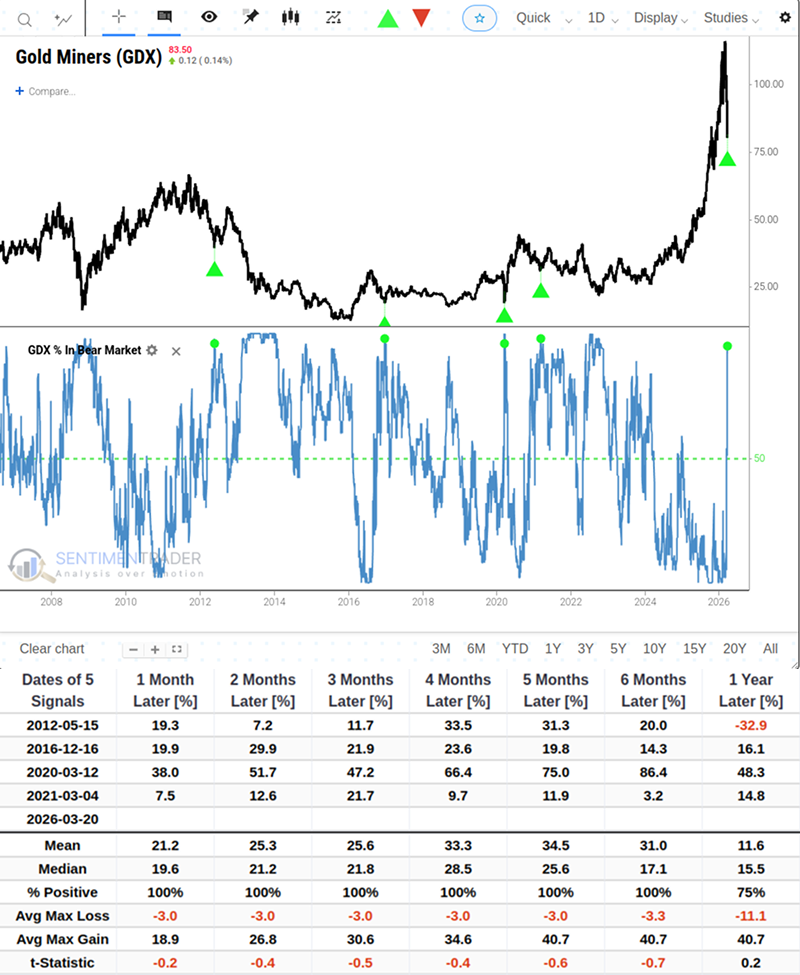
Earlier this month, fewer than 10% of miners were in a correction; last week, 100% of them are. Historically, when breadth collapses this completely, it acts as a clearing event. Mining stocks display a highly positive bias over the subsequent two months.
Fear & Greed Model hits historic extreme
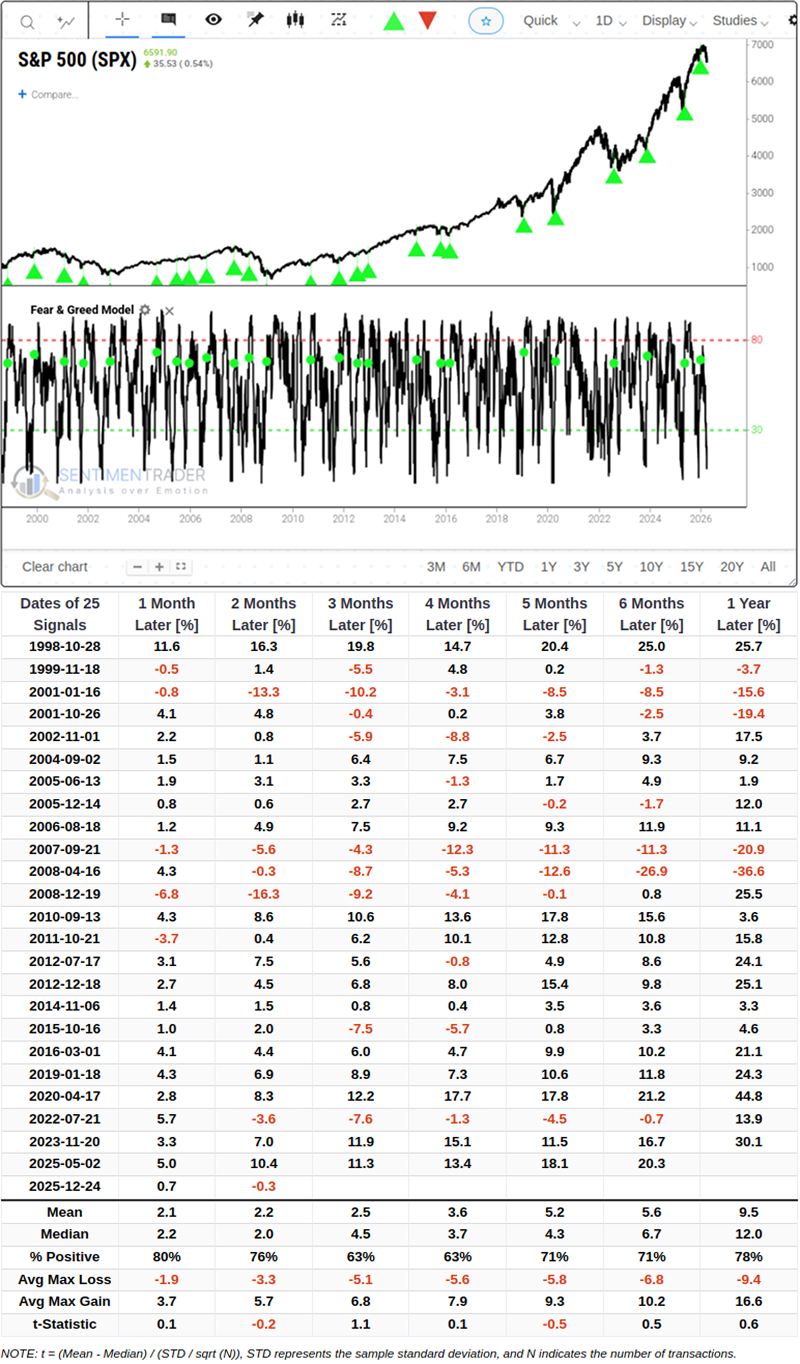
The Fear & Greed Model, a sentiment indicator, declined to one of the lowest levels in history. After similar signals, the S&P 500 struggled over the subsequent two months. A more favorable setup occurs after the model cycles from less than 10% to greater than 66%.
Recently, the Fear & Greed Model, dropped below 10% for only the 31st time since 1998, suggesting a heightened level of fear among investors.
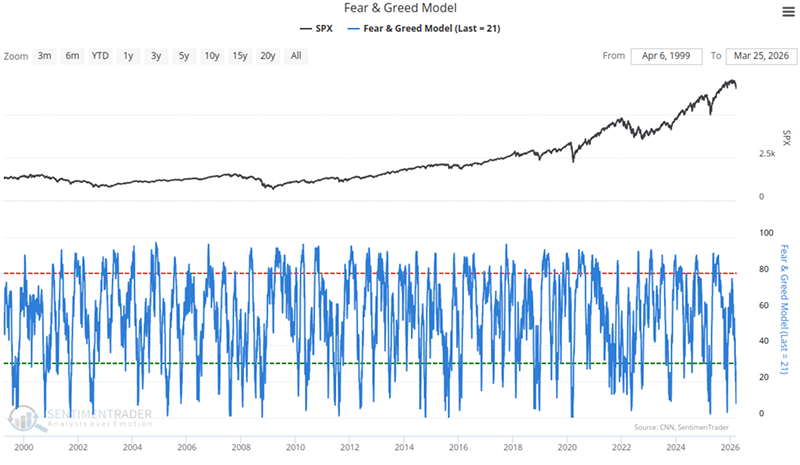
Whenever the Fear & Greed Model dips below 10%, the S&P 500 encounters difficulties in the following two months. Two months out, the S&P 500 was higher just 48% of the time, carrying a negative median return.
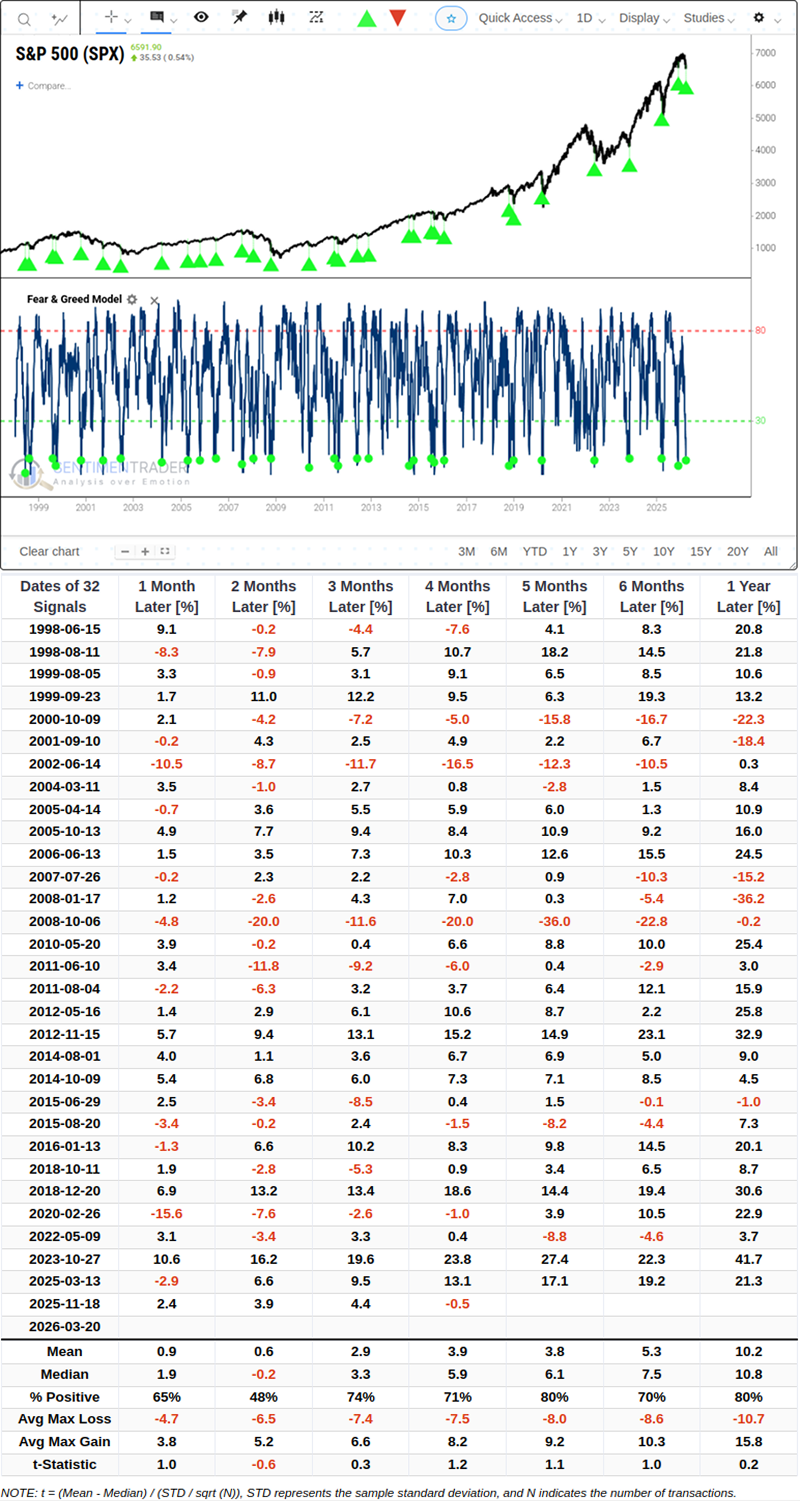
The S&P 500 triggered this recent signal while simultaneously trading below its 200-day moving average. Filtering the history for this dual condition narrows the sample to 24 instances. Two months after these specific signals, the median return jumps to 3.5%. Extend the timeline to four months, and the index was higher 83% of the time, averaging a gain of nearly 6%.
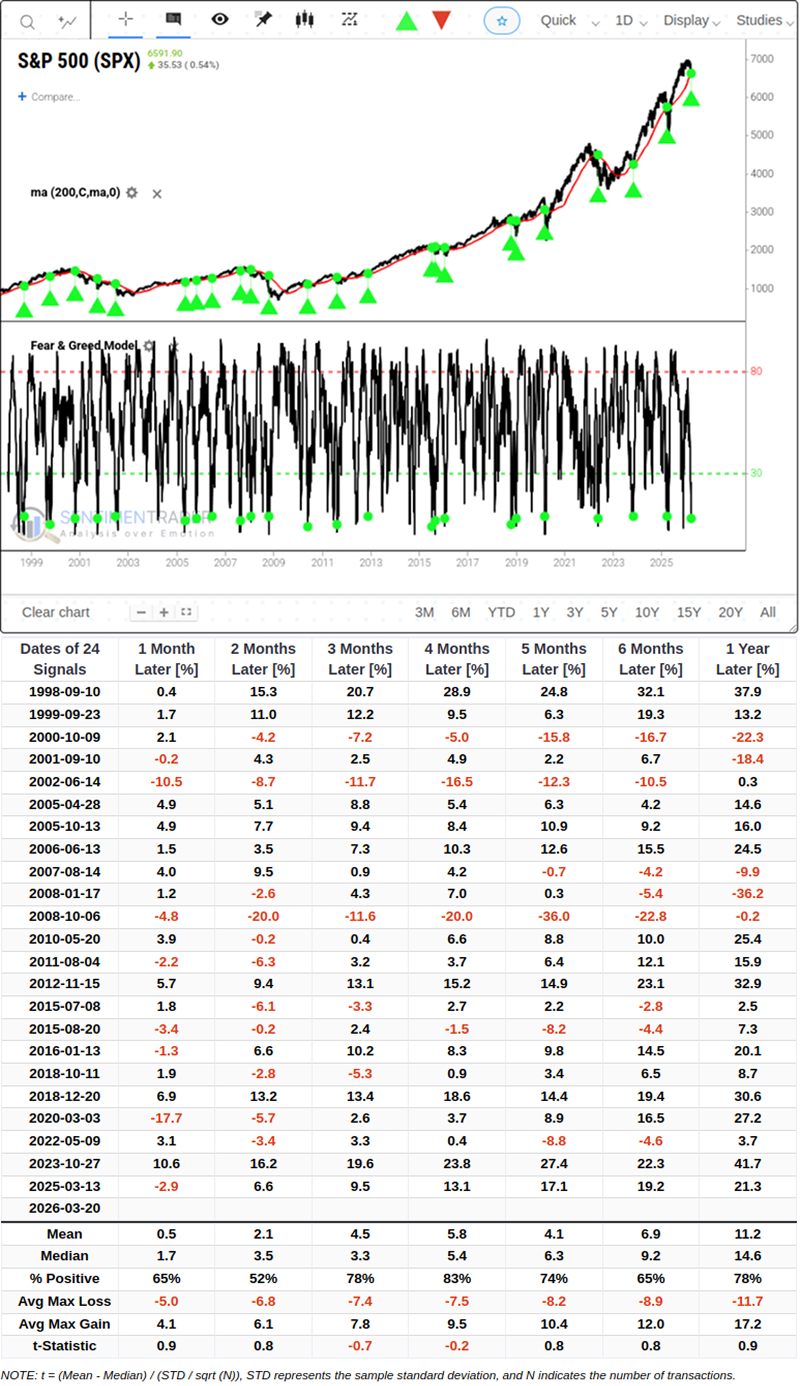
We conducted a test to assess what level produced the best outlook for the S&P 500 after the Fear & Greed Model declined below 10%. The study returned a reversal above 66% as the optimal threshold with a holding period of 21 and 42 trading days.
Utilities: Oversold conditions meet favorable seasonality
Like most sectors, Utilities have shown weakness in recent weeks - but not as much as most other sectors. Despite this weakness, the combination of oversold conditions and a favorable seasonal period may provide an opportunity to play the long side in the months ahead.
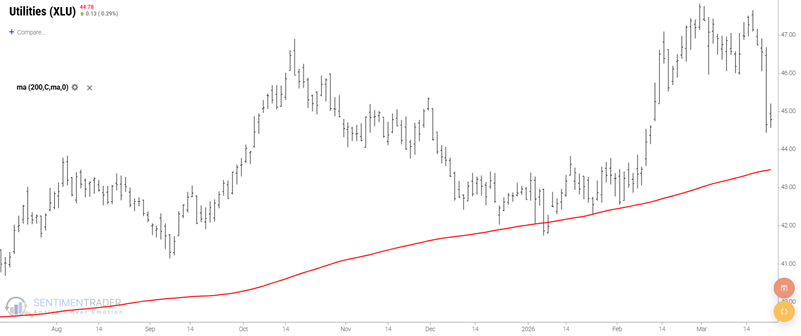
The sector is still holding well above its 200-day moving average and is only slightly more than 6% off its February high. Our XLU % below BBand indicator shows the percentage of S&P 500 Utility Sector Index stocks that are currently below their respective Bollinger Bands. The chart below highlights all dates when our XLU % Below BB indicator crossed above 79%.
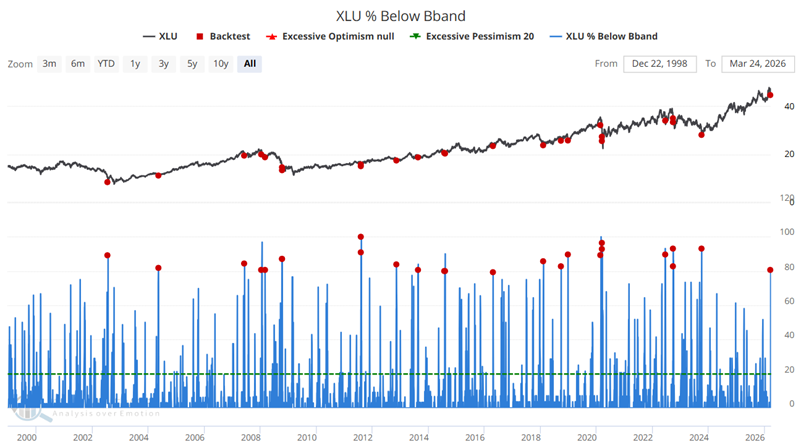
The table below summarizes subsequent XLU performance. The historical results for two and three months after a signal are notable.

Removing overlapping signals, the chart below highlights all dates when an XLU % Below BB signal occurred for the first time in three months.
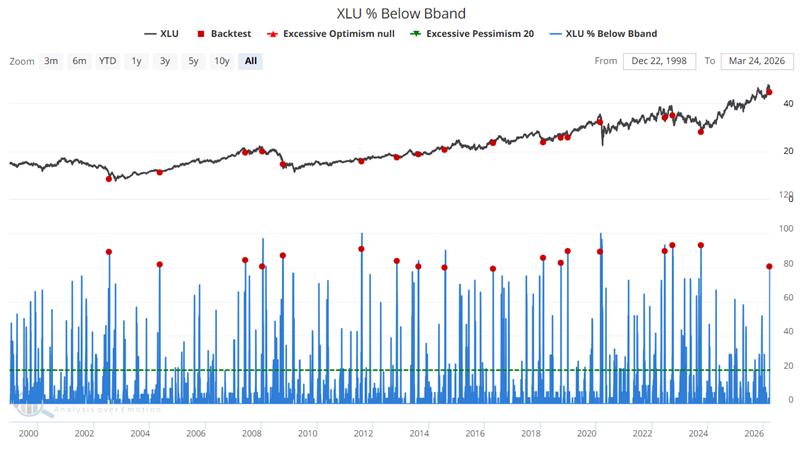
The key thing to note is the 3-month Win Rate of 94%.

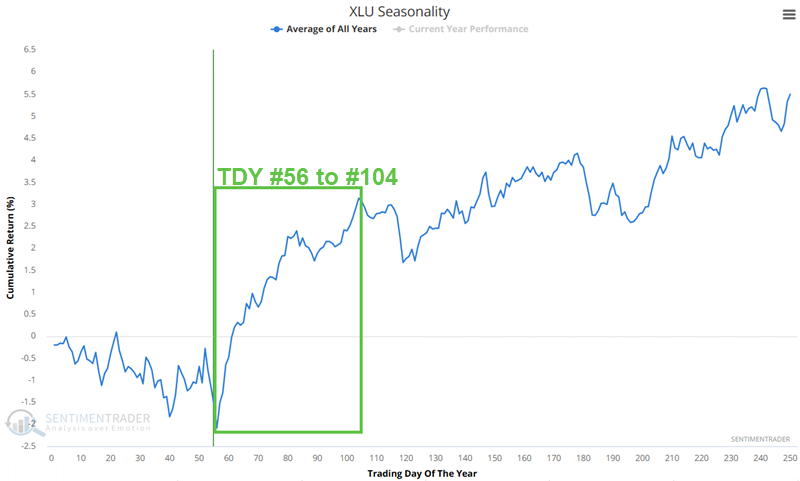
The chart below displays the Annual Seasonal Trend for ticker XLU. It also highlights the period extending from Trading Day of the Year (TDY) #56 through TDY #104. For 2026, this period extends from the close on March 24th through June 2nd.
About TradingEdge Weekly...
The goal of TradingEdge Weekly is to summarize some of the research published to SentimenTrader over the past week. Sometimes there is a lot to digest, and this summary highlights the highest conviction or most compelling ideas we discussed. This is NOT the published research; rather, it pulls out some of the most relevant parts. It includes links to the published research for convenience, and if you don't subscribe to those products, it will present the options for access.