
Taking stock of where we are

Key Points
- Despite recent wobbles, relative trends continue to favor stocks over other assets
- Large-Cap and Growth stocks continue to show positive relative strength
- Developed markets (especially the U.S.) show few signs of relative weakness
Assessing the big picture
The purpose of this piece is to highlight the trends that are currently in place. Each screenshot below, courtesy of StockCharts, is a relative strength chart depicting the trend in each relationship over the last five years.
Each chart also displays the 104-week and 156-week moving average of the relationship. In some cases, trends are apparent; In other cases, not so much.
Stocks versus bonds, commodities, and real estate
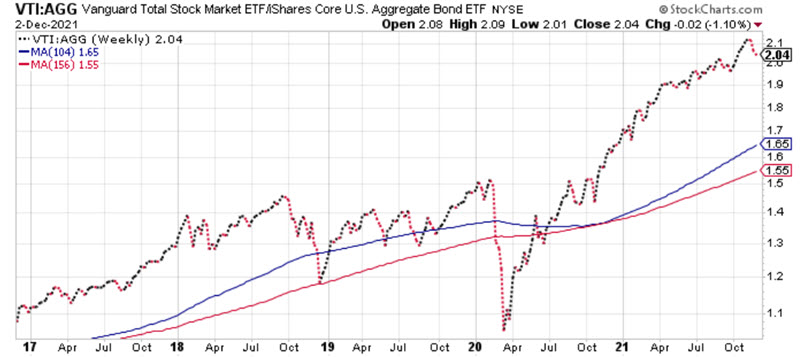
The chart below displays VTI (Vanguard Total Stock Market ETF) versus AGG (iShares Core U.S. Aggregate Bond ETF). The trend has strongly favored stocks since the Covid low in March 2020.
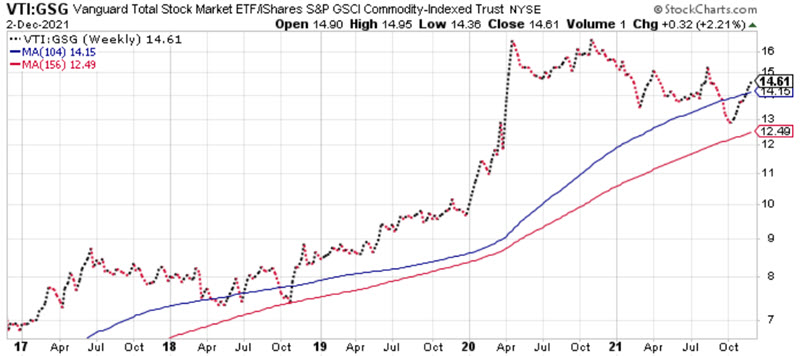
The chart below displays VTI versus GSG (iShares S&P GSCI Commodity-Indexed Trust ). Commodities have slightly outperformed stocks since April 2020, but the longer-term trend is still favoring stocks. A drop below the 156-week average could signal a significant long-term shift in favor of commodities over stocks - particularly if inflation persists.
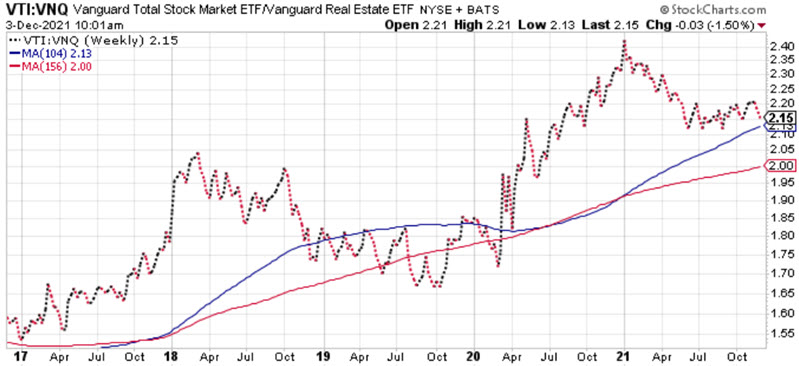
The chart below displays VTI versus VNQ (Vanguard Real Estate ETF). Like commodities, real estate has slightly outperformed stocks since early 2021, the longer-term trend is still favoring stocks, and a full reversal is possible if inflation persists.
U.S. Stocks versus international stocks
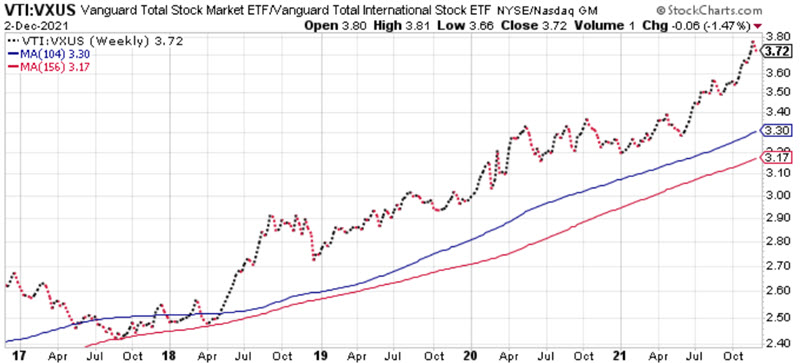
The chart below displays VTI versus VXUS (Vanguard Total International Stock ETF). U.S. stocks have vastly outperformed international (i.e., non-U.S. markets) since late 2017. Eventually, this trend will end, but for now, a move into international stocks is a 100% counter-trend action.
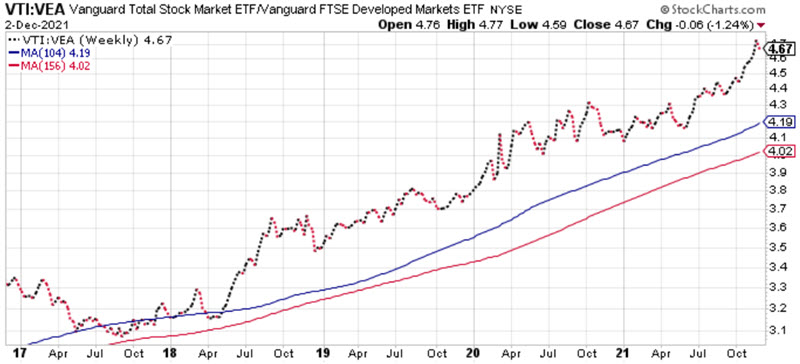
The chart below displays VTI versus VEA (Vanguard FTSE Developed Markets ETF). The current trend favoring U.S. stocks remains intact.
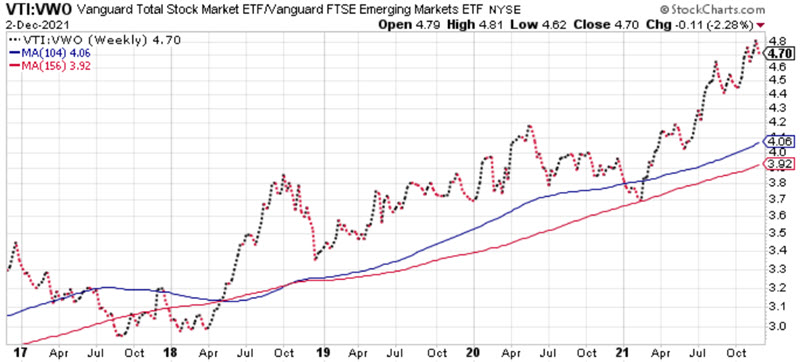
The chart below displays VTI versus VWO (Vanguard FTSE Emerging Markets ETF). Like the above, current trends favoring U.S. stocks remain intact.
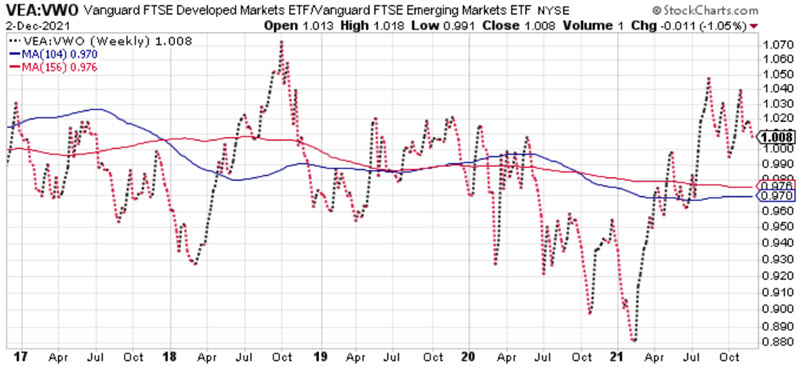
The chart below displays VEA (Vanguard FTSE Developed Markets ETF) versus VWO (Vanguard FTSE Emerging Markets ETF). Not only have non-U.S. stocks been significantly underperforming U.S. stocks, but there has also been absolutely no recognizable trend discerning developed markets from emerging markets.
Large-Cap versus Small-Cap
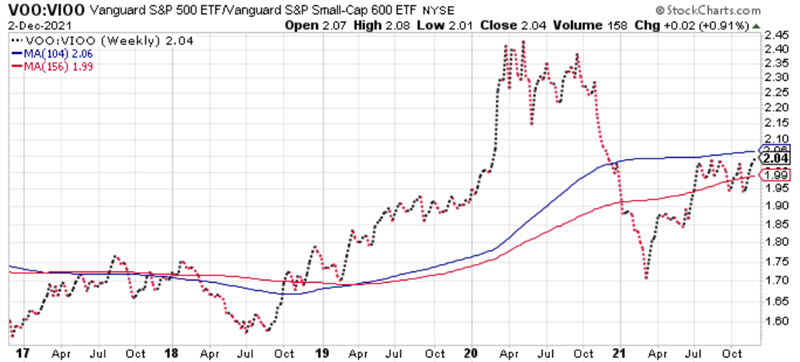
The chart below displays VOO (Vanguard S&P 500 ETF) versus VIOO (Vanguard Small-Cap 600 ETF). The perception of many investors is that large caps are dominating small caps. Yet, in reality, there have been some wide back-and-forth swings in the last two years, and the relationship is virtually unchanged from early 2020. This one bears watching as the jury is still very much out. Historically, the next several months favor small caps.
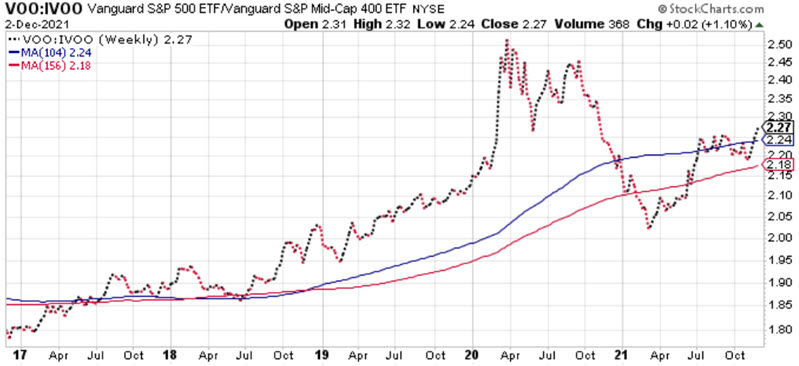
The chart below displays VOO versus VIOO (Vanguard Mid-Cap 400 ETF). Very similar to the large-cap/small-cap ratio above, although large-caps are presently in an uptrend versus mid-caps. It remains to be seen if this trend will last, and I will not be surprised if it does not.
Sectors and factors
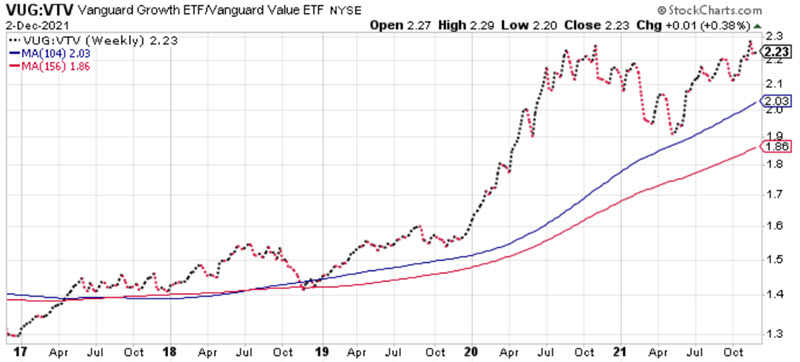
The chart below displays VUG (Vanguard Growth ETF) versus VTV (Vanguard Value ETF). Growth has been leading value for so long that "Value is dead" has become a common refrain. But there are a few key things to note:
- The trend inarguably still presently favors growth
- This trend will not last forever
- The relationship has been unchanged over the past 16 months
If history is a guide, value stocks will outperform growth stocks when the next bear market unfolds.
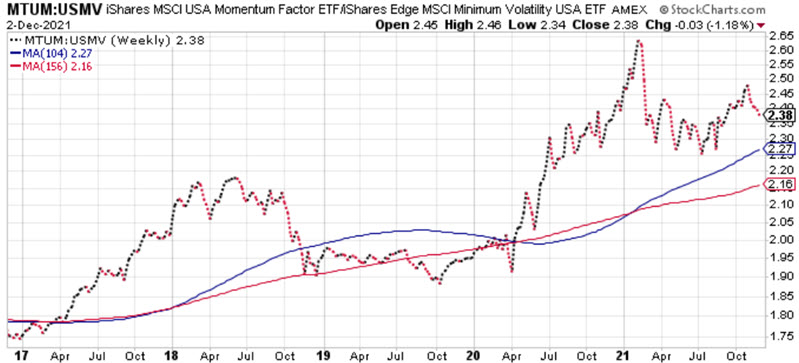
The chart below displays MTUM (iShares MSCI USA Momentum Factor ETF) versus USMV (iShares Edge MSCI Minimum Volatility ETF). Typically, momentum stocks outperform during bullish market conditions, and low volatility stocks outperform during bearish market conditions. The longer-term trend still favors momentum stocks. However, low volatility has gained ground since early 2021, and the relationship has been unchanged from 13 months ago. Watch this one for a potential early warning sign.
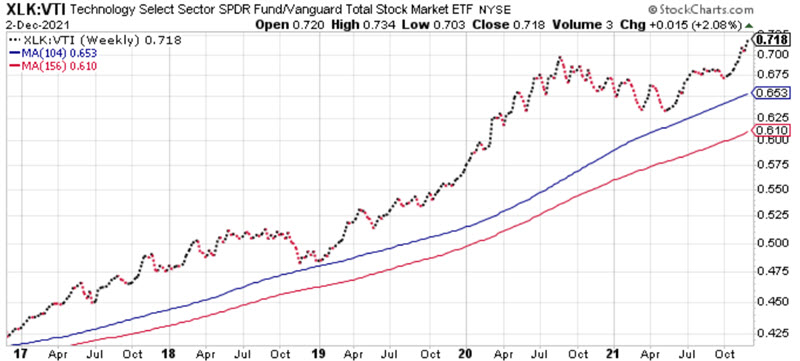
The chart below displays XLK (Technology Select Sector SPDR ETF) versus VTI. Technology has been where it's at for the last five years. Like any trend, this one will not last forever. However, there is no sign of a reversal at the moment (the relationship has broken out to a new high), and corporate technology insiders continue to be strong buyers of their own shares, which suggests that the people most knowledgeable about the sector remain bullish.
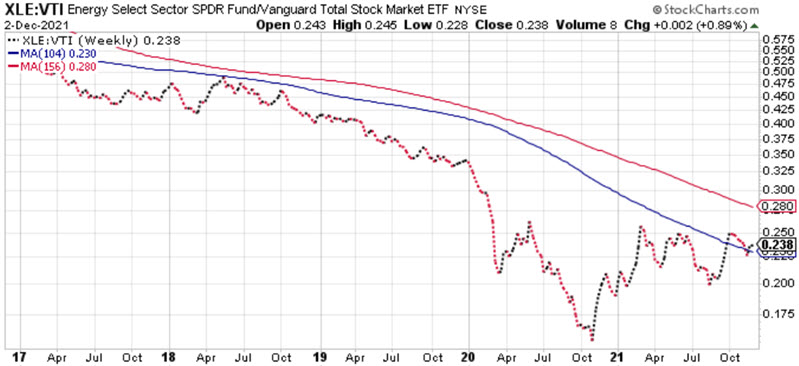
The chart below displays XLE (Energy Select Sector SPDR ETF) versus VTI. Energy became the most hated sector of all time before bouncing in late 2020. Historically, hated sectors tend to enjoy long bull runs once the tide turns. A continued strengthing in this relationship could signal just that for energy stocks.
TIPs versus Broad Bond Market
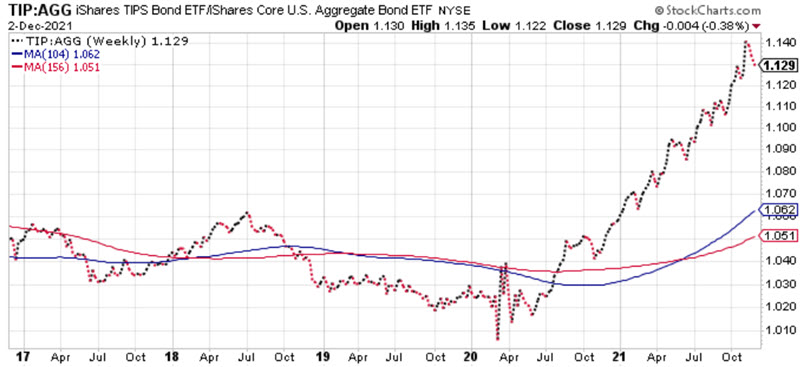
The chart below displays TIP (iShares TIPS Bond ETF) versus AGG (iShares Core U.S. Aggregate Bond ETF). Inflation has been - and continues to be - the primary concern in the bond market. TIPs - which offer some hedge against inflation - have significantly outperformed the overall bond market since the Covid 2020 low. As long as inflation persists and/or as fears of higher interest rates grow, investors may continue to favor TIPs.
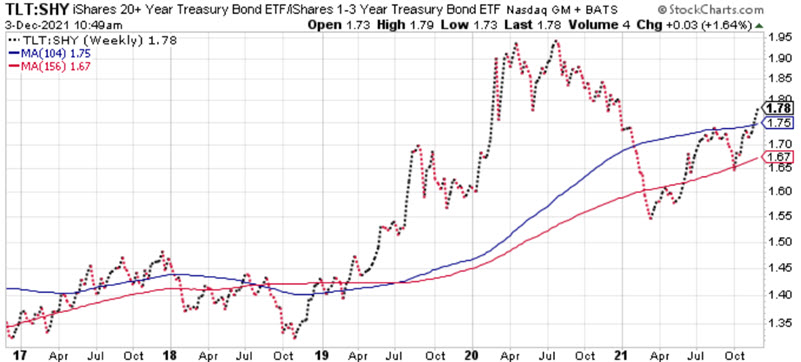
The chart below displays TLT (iShares 20+ Year Treasury Bond ETF) versus SHY (iShares 1-3 Year Treasury Bond ETF). This relationship measures investors' perceptions about interest rates. If rates fall, this relationship rises and vice versa. As long as rates trend lower, long-term treasuries will outperform. When the day finally comes that the Fed actively begins raising rates, the long-term bond/short-term bond relationship will likely fall dramatically as investors abandon long-term bonds in favor of shorter-term securities. For the moment, long-term treasuries are outperforming-short term treasuries.
What the research tells us...
Sentiment has whipsawed quickly over the past month, from extreme optimism to some signs of extreme pessimism. Most of the intermarket relationships that have been in force for the last year remain in force, however. At some point, the domination of U.S. Large-Cap stocks will end, but so far there is little sign of it.