Data &
Technology
Research
Reports
Report Solutions
Reports Library
Actionable
Strategies
Free
Resources
Simple Backtest Calculator
Simple Seasonality Calculator
The Kelly Criterion Calculator
Sentiment Geo Map
Public Research Reports
Free Webinar
Pricing
Company
About
Meet Our Team
In the News
Testimonials
Client Success Stories
Contact
Log inLoginSign up
< BACK TO ALL REPORTS

If I Could Only Pick One Index for the Next Seven Months

Jay Kaeppel
2021-11-03
One of the keys to long-term success is finding an "edge" and exploiting it as often as possible. This piece highlights an index that has been the clear "leader" during the November through May time frame over the past four decades.

OK, I will grant you that it is a flawed premise since nothing requires me or you to pick just one index for the next six months. Still, it is kind of an intriguing question. And if you are talking "odds, based strictly on historical performance," there is, in fact, a clear favorite. So, let's get to it. 

THE DATA

We want to test returns ONLY during the 7-month period extending from the end of October through May each year.

For this test, we will use monthly total return data for:

  • S&P 500 (Large-cap) Index
  • S&P 400 (Mid-cap) Index
  • Russell 2000 (Small-cap) Index

We will start our test at the end of October 1981 (because that is the first year of data available for the S&P 400 Midcap Index).

THE TEST

The chart below displays the cumulative % return for each of the 3 indexes held ONLY during November through May each year since 1981.

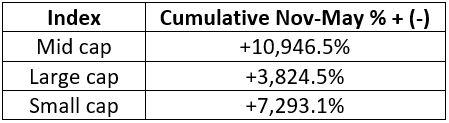
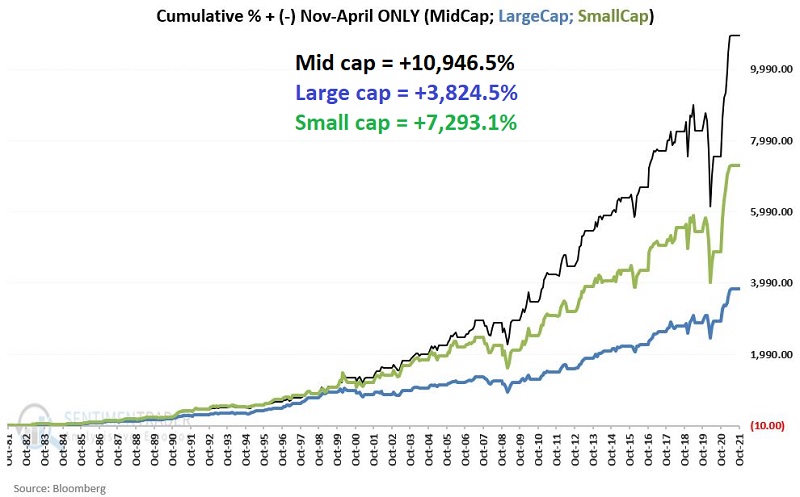
The cumulative returns for each index during Nov-May appear in the table below.

ANALYZING RESULTS

In terms of raw returns, Midcaps have clearly been the winner of the past four decades. However, consistency is just as important. In other words, we want to perceive an actual recurring "edge" and not rely on something that has a few big outliers here and there.

The table below displays the comparative performance figures for each index.

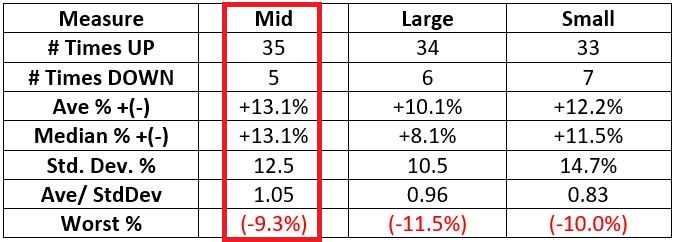
As you can see in the table above. Midcap's show:

  • Largest % of UP years (88%)
  • Highest average and median returns
  • Highest Average / Std. Deviation
  • Small "Worst" year

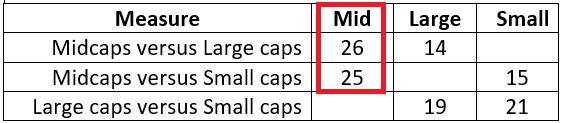
The table below analyzes the annual 7-month performance of each index versus the other indexes. The key things to note:

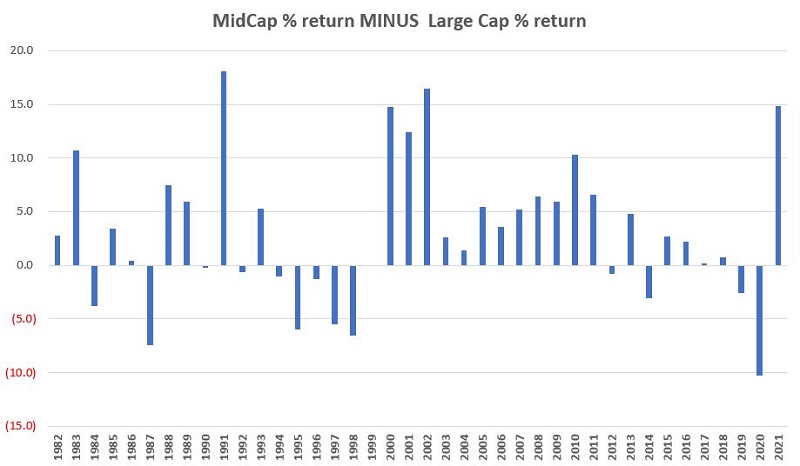
  • In 26 of 40 years (65% of the time), Midcaps outperformed large caps
  • In 25 of 40 years (63% of the time), Midcaps outperformed small caps

SUMMARY

During November through May over the past 40 years, Midcap stocks:

  • Have shown a gain 88% of the time
  • Has outperformed Large caps and Small caps 65% and 63% of the time, respectively

The chart below displays the annual result of Midcap return minus Large Cap return for Nov-May.

There is no way to predict which index will perform the best (or the worst) between November and May on a year-to-year basis. But the long-term results clearly seem to suggest that Midcap stocks appear to offer an "edge."

Sorry, you don't have access to this report

Upgrade your subscription plan to get access
Go to Dasboard
DATA &
TECHnologies
IndicatorEdge
‍
BackTestEdge
‍
Other Tools
‍
DataEdge API
RESEARCH
reports
Research Solution
‍
Reports Library
‍
actionable
Strategies
Trading Strategies
‍
Smart Stock Scanner
‍
FREE
RESOUrCES
Simple Backtest
Calculator
Simple Seasonality
Calculator
The Kelly Criterion
Calculator
Sentiment Geo Map
‍
Public Research Reports
‍
Free Webinar
COMPANY
‍
About
‍
Meet our Team
‍
In the News
‍
Testimonials
‍
Client Success Stories
Pricing
Bundle pricing
‍
Announcements
‍
FAQ
© 2024 Sundial Capital Research Inc. All rights reserved.
Setsail Marketing
TermsPrivacyAffiliate Program
Risk Disclosure: Futures and forex trading contains substantial risk and is not for every investor. An investor could potentially lose all or more than the initial investment. Risk capital is money that can be lost without jeopardizing ones’ financial security or life style. Only risk capital should be used for trading and only those with sufficient risk capital should consider trading. Past performance is not necessarily indicative of future results.

Hypothetical Performance Disclosure: Hypothetical performance results have many inherent limitations, some of which are described below. No representation is being made that any account will or is likely to achieve profits or losses similar to those shown; in fact, there are frequently sharp differences between hypothetical performance results and the actual results subsequently achieved by any particular trading program. One of the limitations of hypothetical performance results is that they are generally prepared with the benefit of hindsight. In addition, hypothetical trading does not involve financial risk, and no hypothetical trading record can completely account for the impact of financial risk of actual trading. for example, the ability to withstand losses or to adhere to a particular trading program in spite of trading losses are material points which can also adversely affect actual trading results. There are numerous other factors related to the markets in general or to the implementation of any specific trading program which cannot be fully accounted for in the preparation of hypothetical performance results and all which can adversely affect trading results.

Testimonial Disclosure: Testimonials appearing on this website may not be representative of other clients or customers and is not a guarantee of future performance or success.