
The Large-Cap/Small-Cap Calendar

Key Points
- The back and forth in the relative performance of large-cap stocks versus small-cap stocks are typically more cyclical than most investors realize
- By adhering to a particular switching schedule, an investor may be able to outperform a strategy of splitting money on a buy-and-hold basis between the two styles
Large-cap versus Small-cap: The endless debate
There are many "market rivalries" - Stocks versus Bonds, Growth versus Value, Large-Cap versus Small-Cap. And there seems to be no end of people willing to argue for or against each "rival." Which strikes me as silly.
The bottom line: No category of investment ever has a permanent edge. Period.
History is pretty clear on this. One style or sector leads the other lags, then just like that, it's all vice versa. The order of magnitude and the time required for a particular trend to play out can vary, but ultimately Ying follows Yang. Up follows down. Day follows night. Large-caps rule small-caps, and then they lag. And so on.
Let's take a closer look at how this works between large-cap and small-cap stocks.
The Large-Cap/Small-Cap Calendar
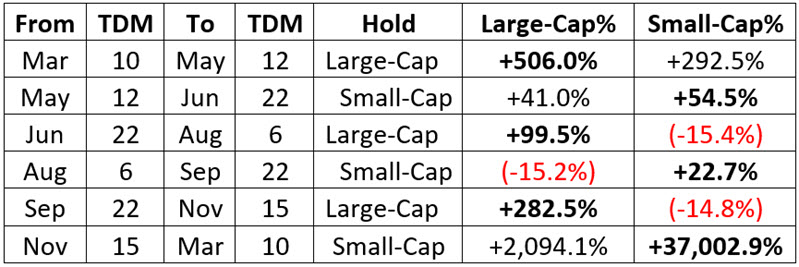
The Large-Cap/Small-Cap Calendar works as shown in the table below and uses trading days of the month, not actual calendar days, to trigger a move from one style to the other. "TDM" stands for "Trading Day of Month." The first trading day of each month is "TDM #1", the next day is "TDM #2," and so on.
The switching calendar appears in the table below. Also displayed for each period is the cumulative % performance for large-cap and small-cap indexes during each segment, from 12/31/1952 through 9/30/2021.
For analyzing results:
- Since 1989 we have used ticker RUI (Russell 1000 index) to emulate large-cap stocks and ticker RUT (Russell 2000 Index) to emulate small-cap stocks
- From 1953 to 1989, the Fama French Indexes for large-cap and small-cap stocks is used
- Our test runs from December 31, 1952, through September 30, 2021
The chart below displays the growth of $1 invested in large-cap stocks versus small-cap stocks ONLY during the times of year that favor large-cap stocks.
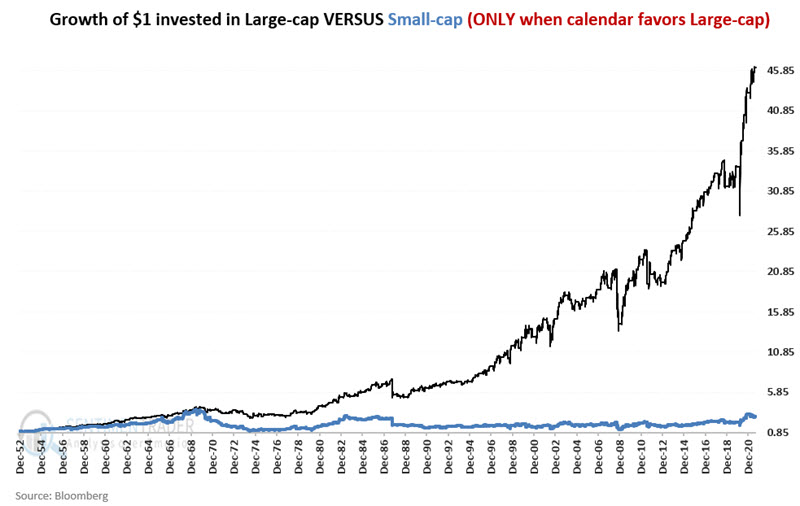
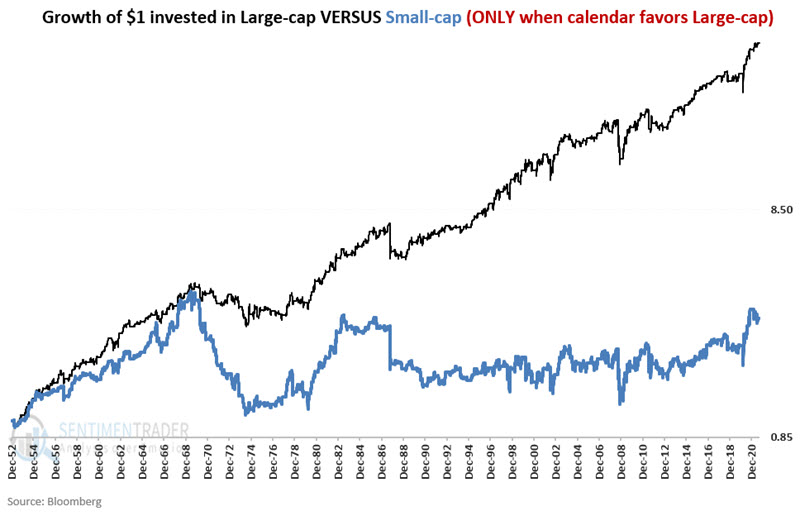
The chart below displays the same data on a logarithmic scale.
The chart below displays the growth of $1 invested in large-cap stocks versus small-cap stocks ONLY during the times of year that favor small-cap stocks.
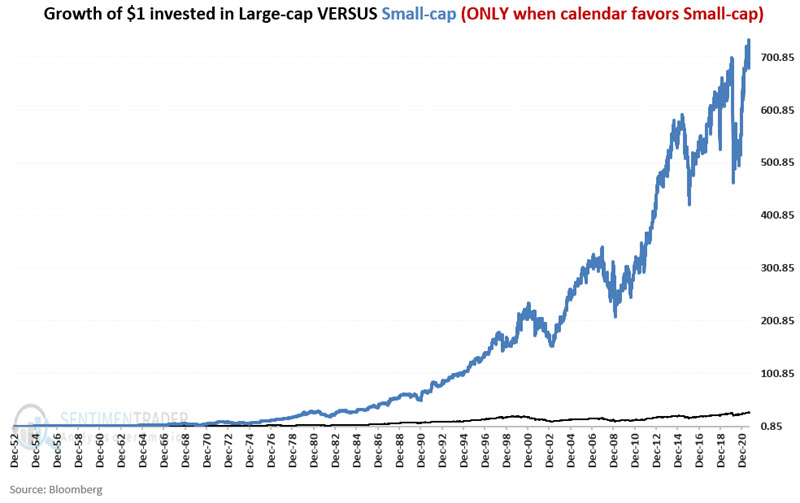
The chart below displays the same data on a logarithmic scale.
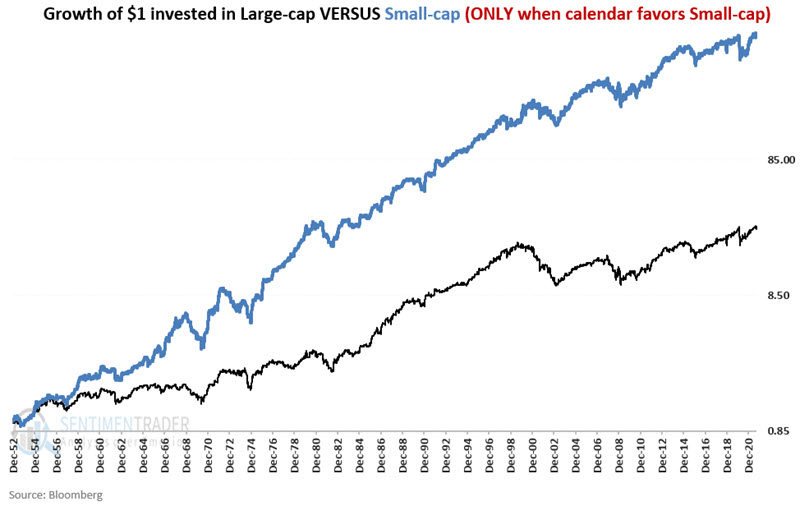
As you can see, while there is a lot of volatility, the point is that large-caps significantly outperform in the first chart and small-caps significantly outperform in the second chart.
A calendar-based calendar switching strategy
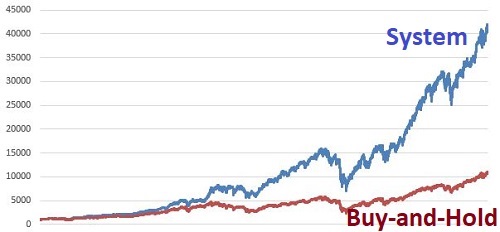
The chart below displays the growth of $1 achieved by: a) investing in large-cap stocks during their favored periods and investing in small-cap stocks during their favored periods. The second line displays the growth of $1 split between large-cap and small-cap stocks on a buy-and-hold basis.
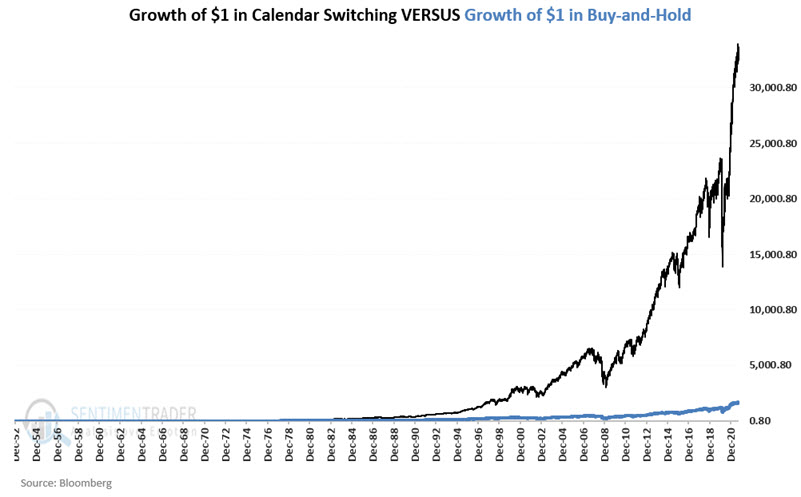
The chart below displays the same data on a logarithmic scale.
The table below displays the relevant comparative performance numbers for the calendar switching strategy versus buy-and-hold:
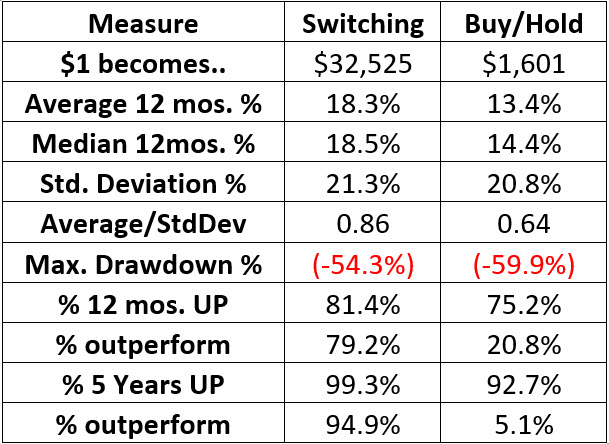
Some numbers to note:
- $1 using the calendar switching strategy grew to $32,525 versus $1,601 using buy-and-hold
- The average 12-month gain favored the calendar switching strategy +18.3% versus +13.4%
- Looking at 12-month returns, the calendar switching strategy outperformed buy-and-hold 79.2% of the time
- Looking at 5-year returns, the calendar switching strategy outperformed buy-and-hold almost 94.9% of the time
So far, so good, but there is one other important number. Because the calendar-based switching strategy is always fully invested, it is susceptible to bear markets. Note that while the maximum drawdown of -54.3% is slightly better than that of buy-and-hold (-59.9%), it is still a pretty substantial decline to have to sit through.
Focusing on the long-term
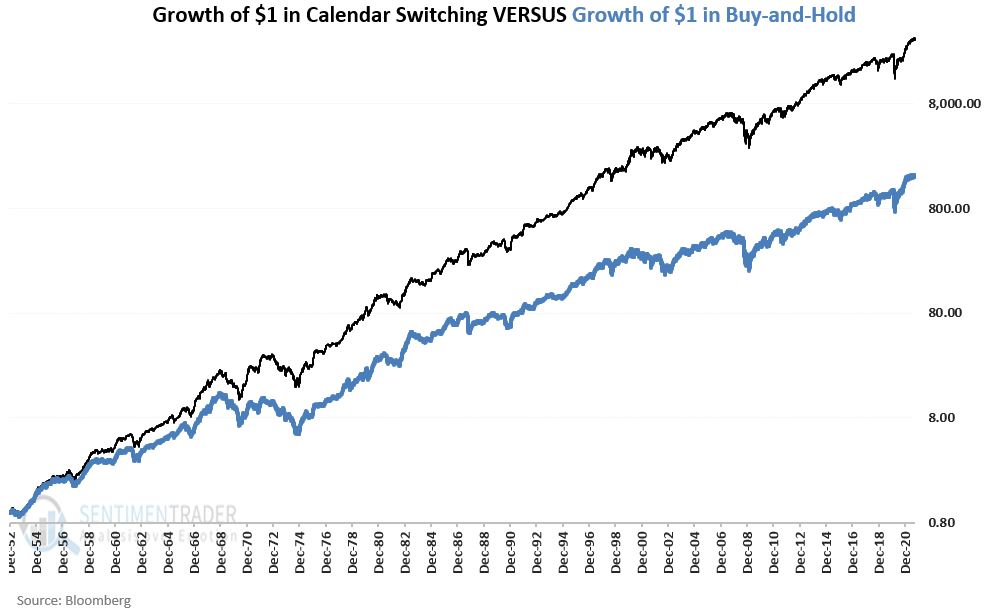
No strategy outperforms all the time, and this one is no exception. There can be periods of up to several years when the calendar switching strategy can underperform buy-and-hold. The chart below displays the performance of the calendar switching strategy versus buy-and-hold performance on a logarithmic scale.
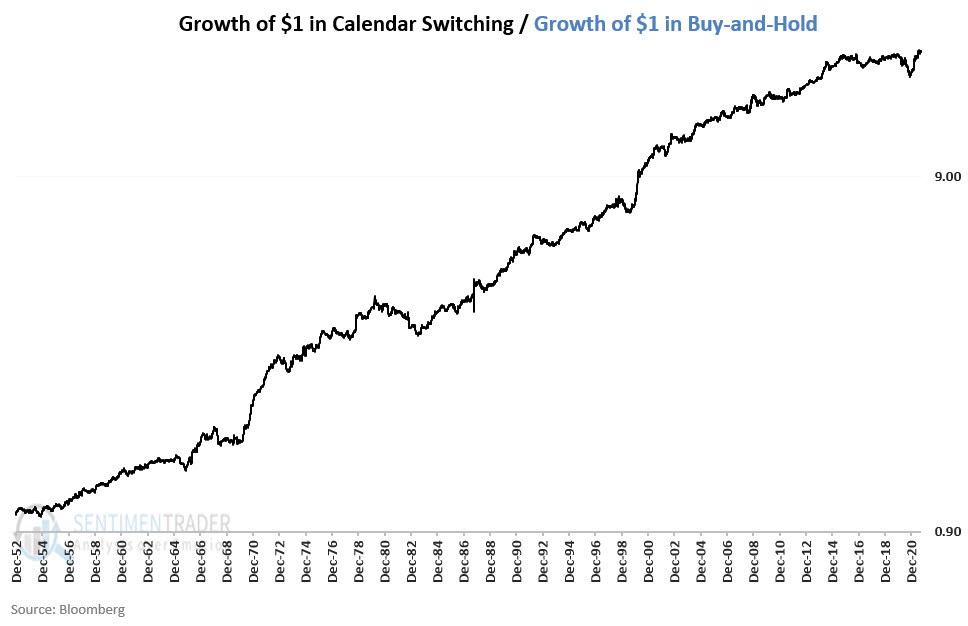
In the chart above, we see the relative performance line recently hitting a new high after a period of several years of moving sideways to lower. A close look at the chart above reveals that this is not unusual.
It also tells us that mustering the discipline to stick with the strategy even during periods of underperformance is the key to achieving long-term success (BTW: this is true of any trading strategy or system).
Upcoming dates
Friday, November 19th will be the 15th trading day of November. This strategy will switch from large-cap stocks to small-cap stocks on the close that day. The most straightforward approach is to buy ticker IWM (iShares Russell 2000 ETF), an ETF that tracks the Russell 2000 Index. This small-cap position will be held until the close of the 10th trading day of March 2022.
What the research tells us…
- Large-cap and small-cap stocks have demonstrated a long-term tendency to outperform one another during a specific time of the year
- By switching into the favored style as indicated above over the past nearly 69 years, an investor would have significantly outperformed a buy and hold approach combined with solid consistency of returns