
Market overview: with stocks at all-time highs, what's next
With stocks just under all-time highs, here's my market outlook:
- Long term risk:reward doesn’t favor bulls. Valuations are high, but valuations can remain high for years before stocks crash.
- Fundamentals (6-12 months): still bullish because there is no significant U.S. macro deterioration, but this could change IF macro data deteriorates significantly over the next few months
- Technicals (3-6 months): neutral/bullish
- Technicals (1-2 months): no clear edge in either direction.
Fundamentals (6-12 months)
The economy and the stock market move in the same direction in the long term. Hence, leading economic indicators are also long term leading indicators for the stock market.
Overall, there is no significant U.S. economic deterioration right now. This is bullish for the stock market on a 6-12 month time frame. The main weak points in U.S. macro revolve around trade, manufacturing, and the yield curve. For more details and charts, please see my weekly fundamentals post.
What will happen to macro in the future? I don't know. Instead of trying to guess the future, the constant stream of macro data tells us how to react and allocate capital day-by-day depending on what's happening right now.
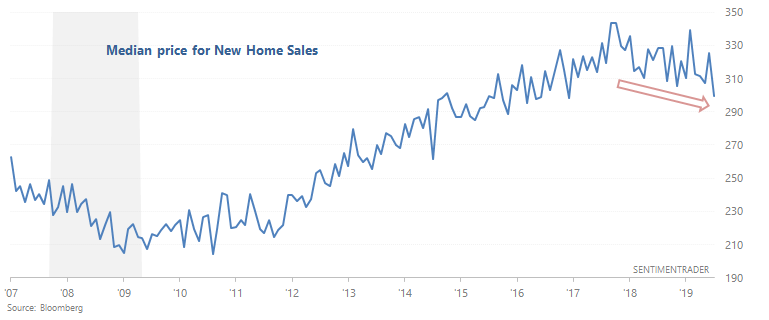
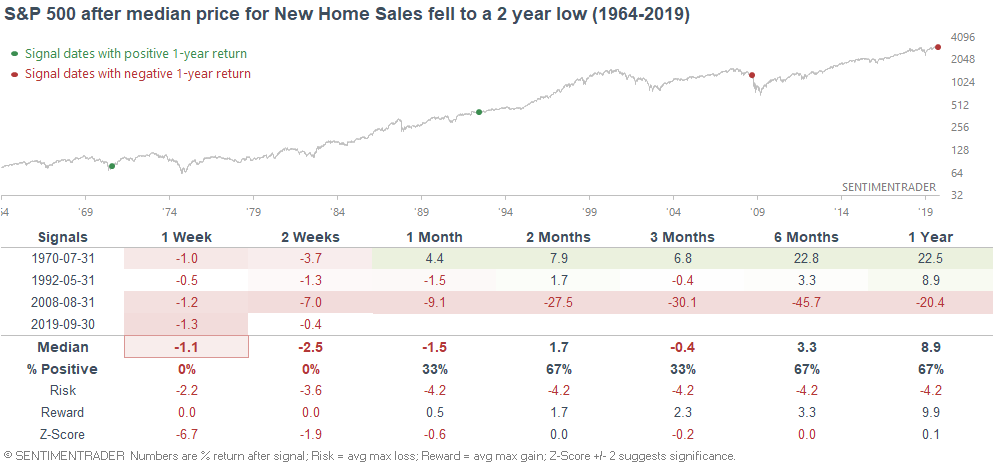
On a side note, Bloomberg mentioned that the median sales price for New Home Sales has fallen to a 2 year low:
This is uncommon since nominal housing prices don't always fall in recessions (even though inflation-adjusted prices will fall). The other 3 times this happened were all during recessions. 2008 occurred just before the global economy and markets fell off a cliff, whereas the other 2 cases occurred at the end of recessions.
Which do I think is more likely? The bullish case. Price lags activity, and while housing activity weakened in the 2nd half of 2018, it is now improving. Overall, housing (a key leading sector of the economy) remains a bullish factor for macro right now.
Technicals (3-6 months)
The majority of our stats suggest that the stock market's 3-6 month outlook is bullish, although there are some bearish stats as well. Let's start with the bullish stats, and then we'll look at the bearish ones.
Bullish:
Trend
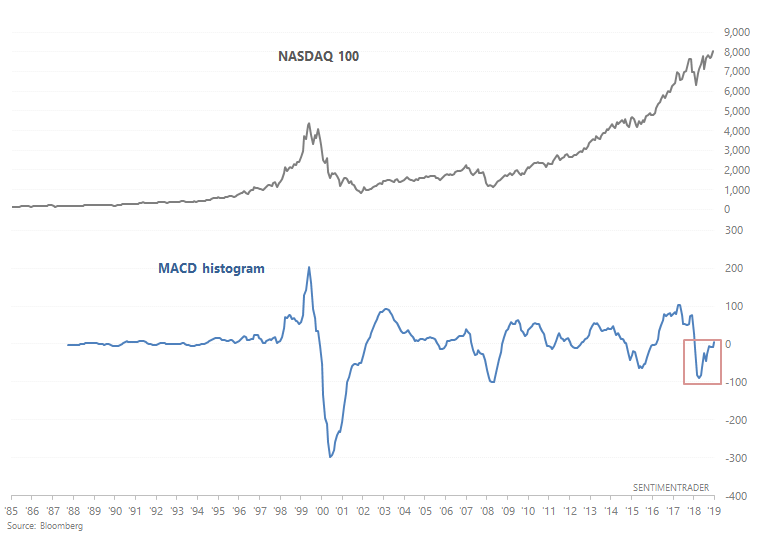
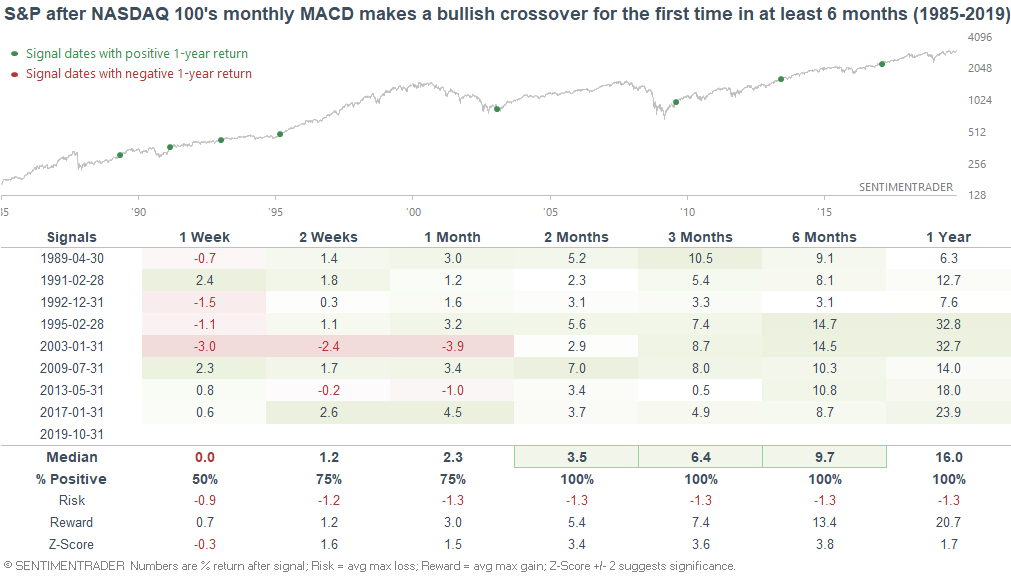
With just a few days left in October, the NASDAQ 100's monthly MACD is about to make a bullish crossover for the first time in 11 months:
When the NASDAQ 100's monthly MACD made a bullish crossover for the first time in at least 6 months, its forward returns were pristine:
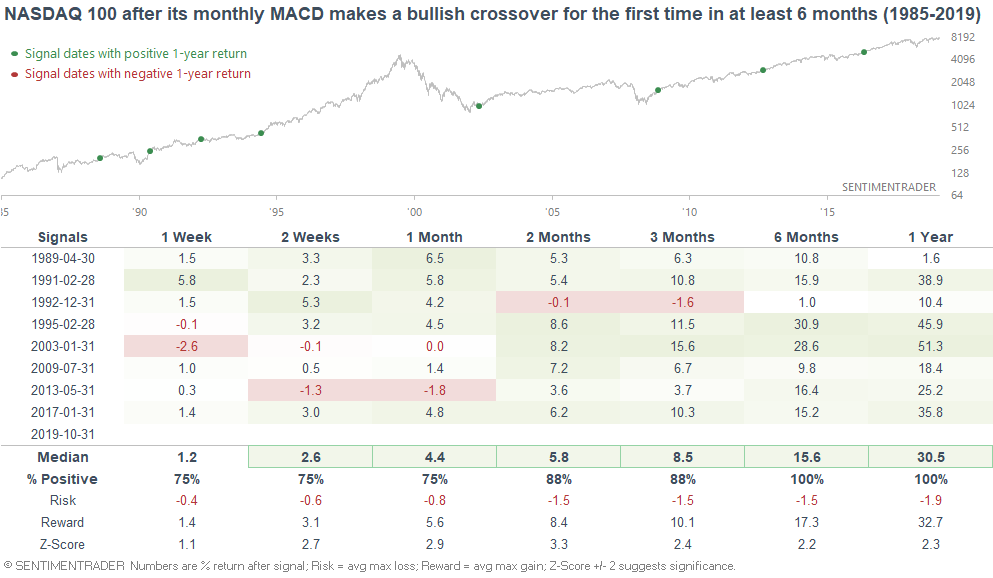
And so was the S&P's:
Multi-asset strength
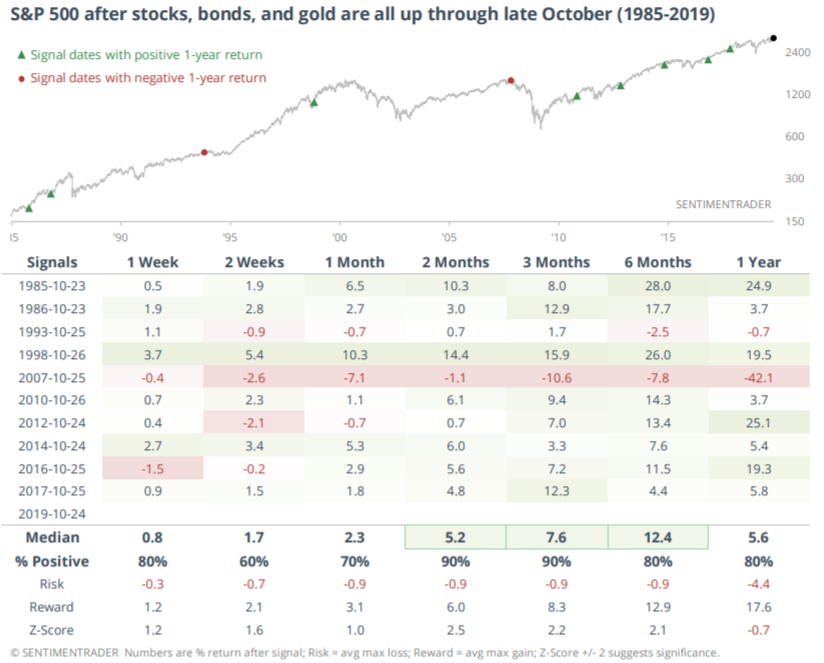
2018 was a year in which most asset classes fell, and 2019 thusfar has seen most asset classes rally. Jason demonstrated that when stocks, bonds, and gold are all up through late-October, the S&P tends to rally over the next 2-6 months:
Breadth
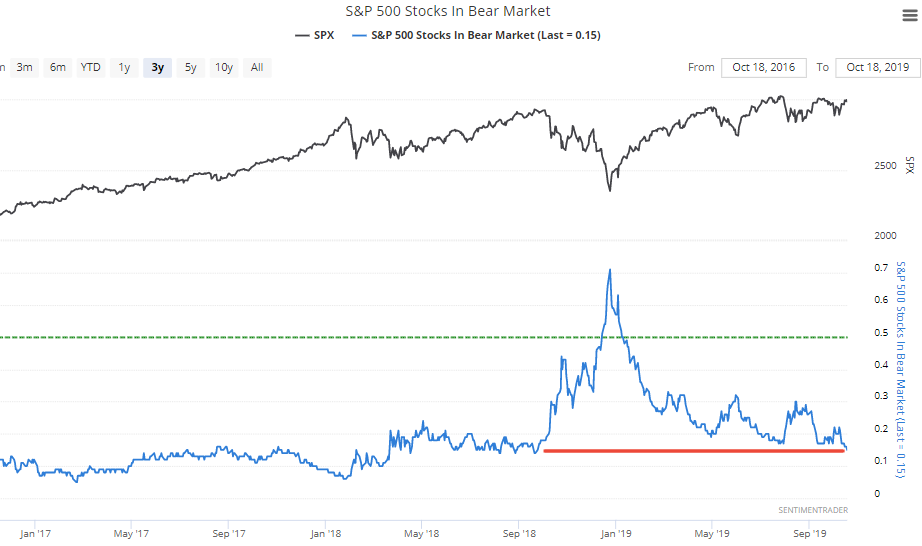
As I mentioned on Friday, the % of S&P 500 stocks in a bear market recently fell to 15% for the first time since September 2018:
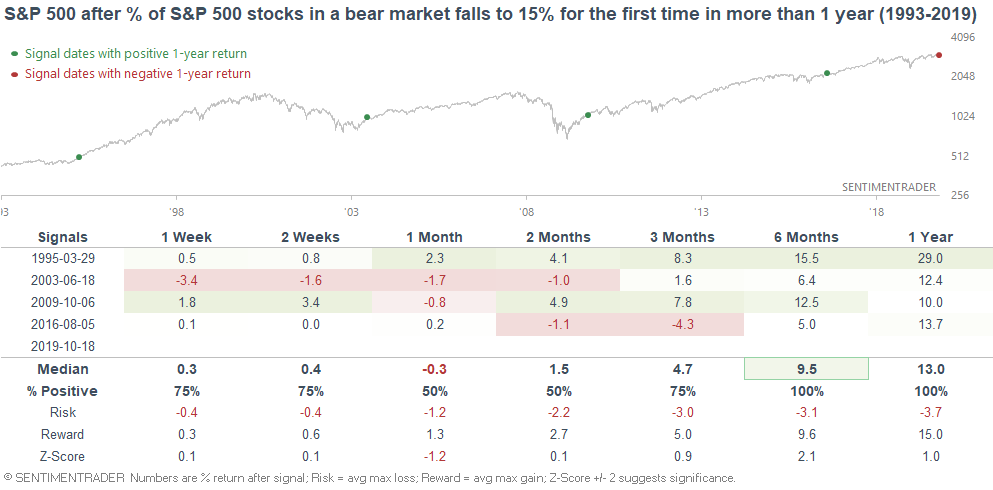
When this figure fell to 15% for the first time in more than 1 year, the S&P surged over the next 6-12 months:
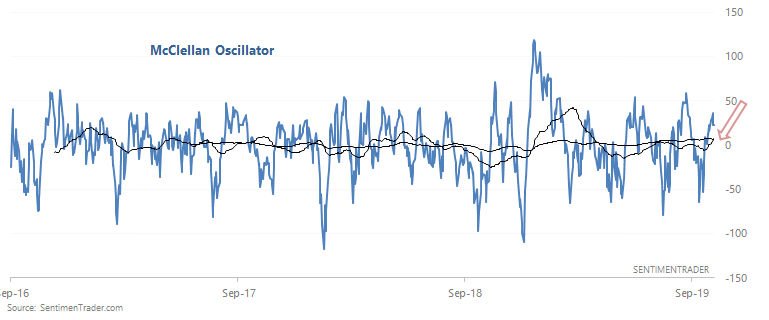
The McClellan Oscillator has been weak since April, spending more time below zero than above zero. But with the stock market rising, the McClellan Oscillator has pushed its 50 dma above its 200 dma for the first time in more than 6 months:
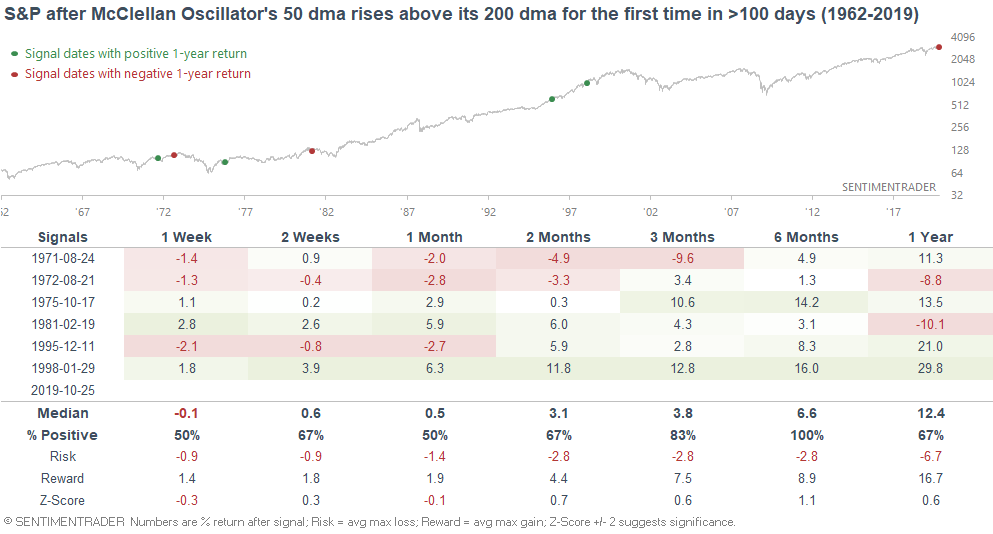
When the McClellan Oscillator's 50 dma rose above its 200 dma for the first time in 100+ days, the S&P's 6 month forward returns were bullish:
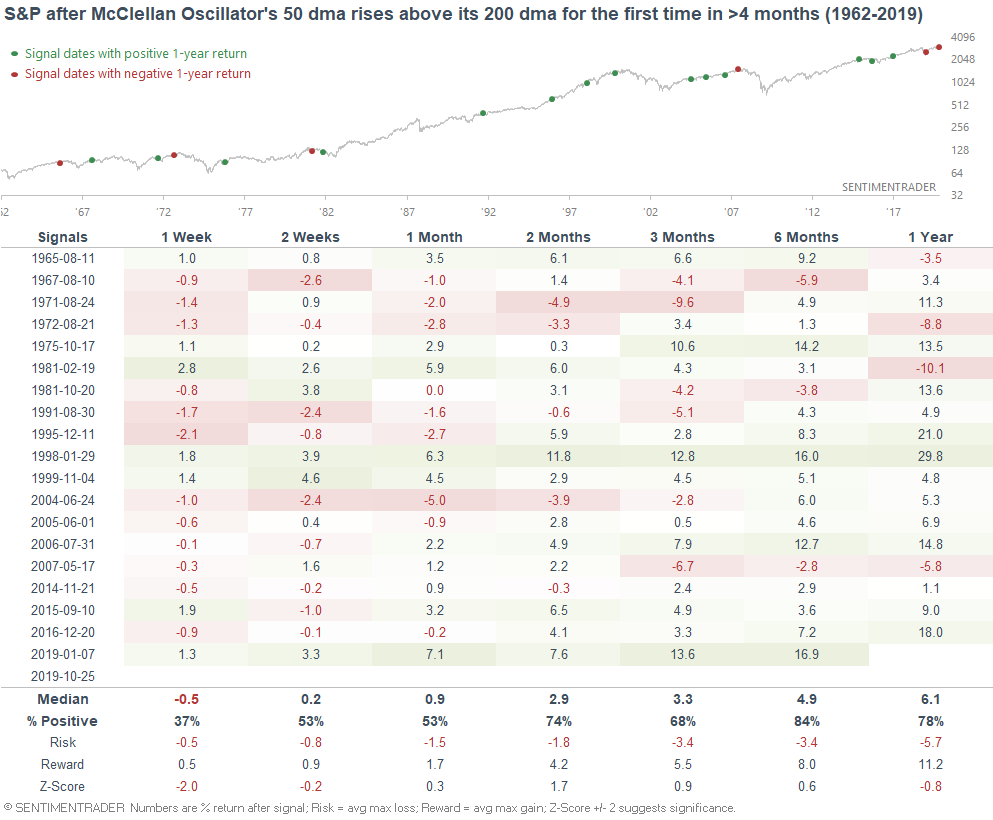
If we loosen the parameters to increase the sample size, the S&P's 6 month forward returns are still mostly bullish:
Momentum
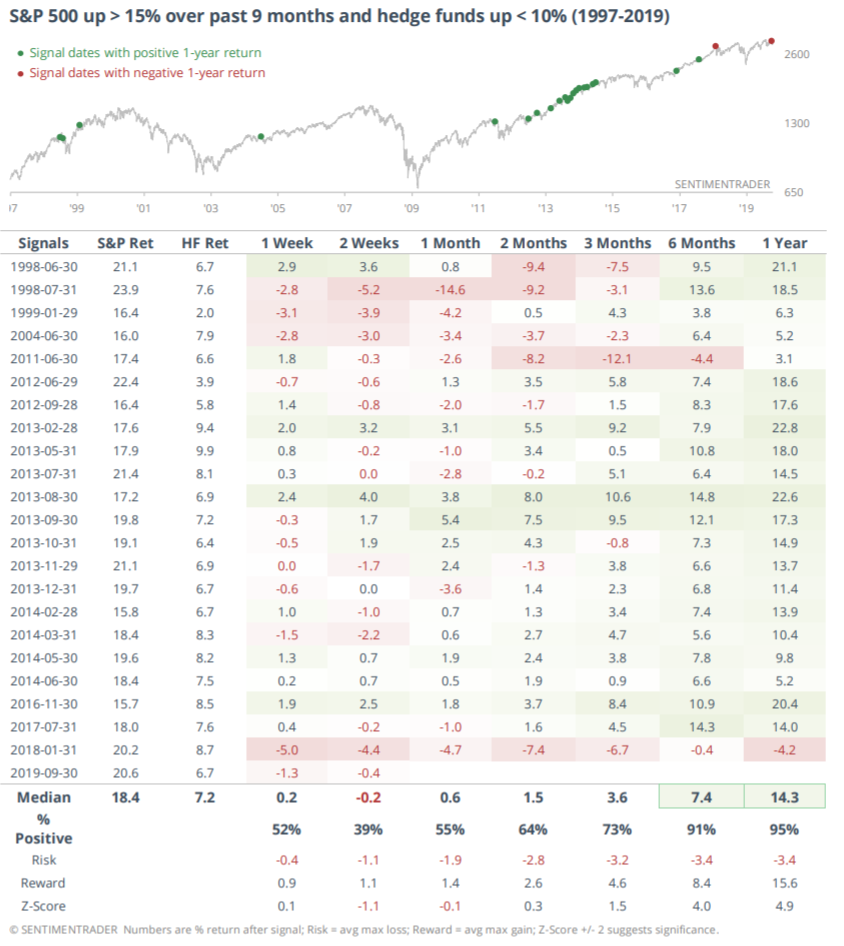
As Jason demonstrated on Tuesday, hedge funds have lagged the S&P 500 significantly over the past 9 months:
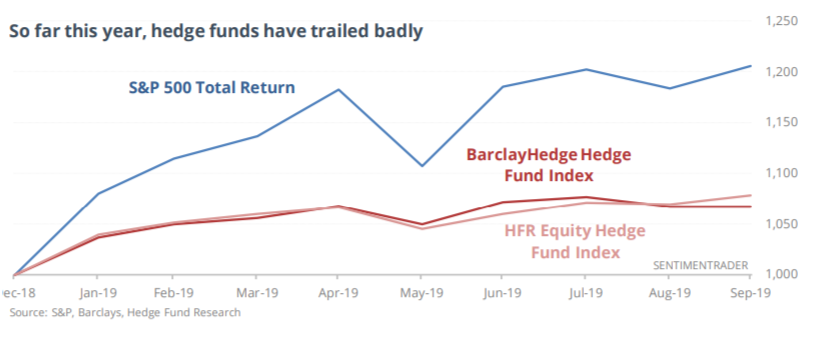
If we look at all 9 month periods in which the S&P was up more than +15% while hedge funds were up less than +10%, the S&P's 6-12 month forward returns were quite bullish. But many of these signals came during 2013-2014 when the S&P surged, so perhaps this bullish stat is merely due to the momentum effect (hedge funds tend to lag when the stock market soars, and what is in motion tends to stay in motion):
Range
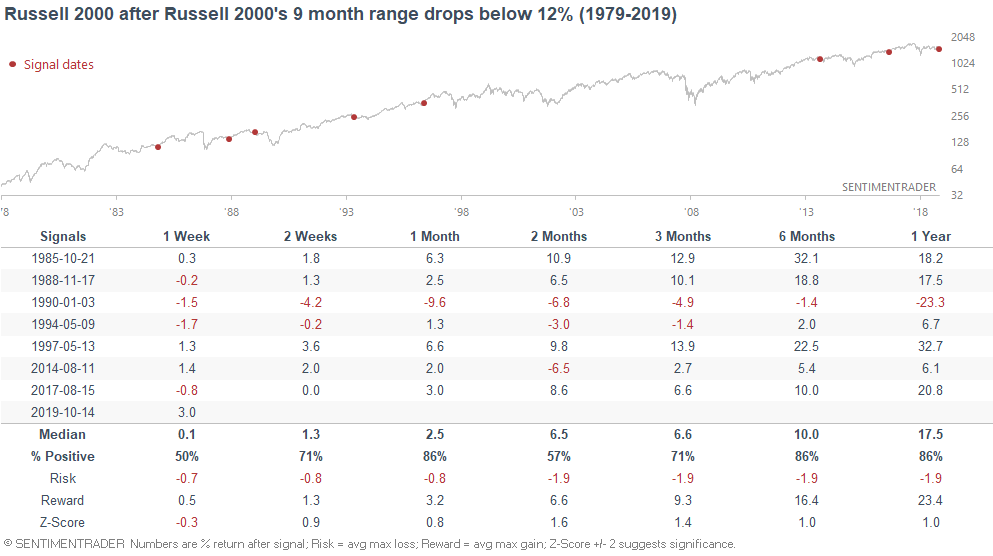
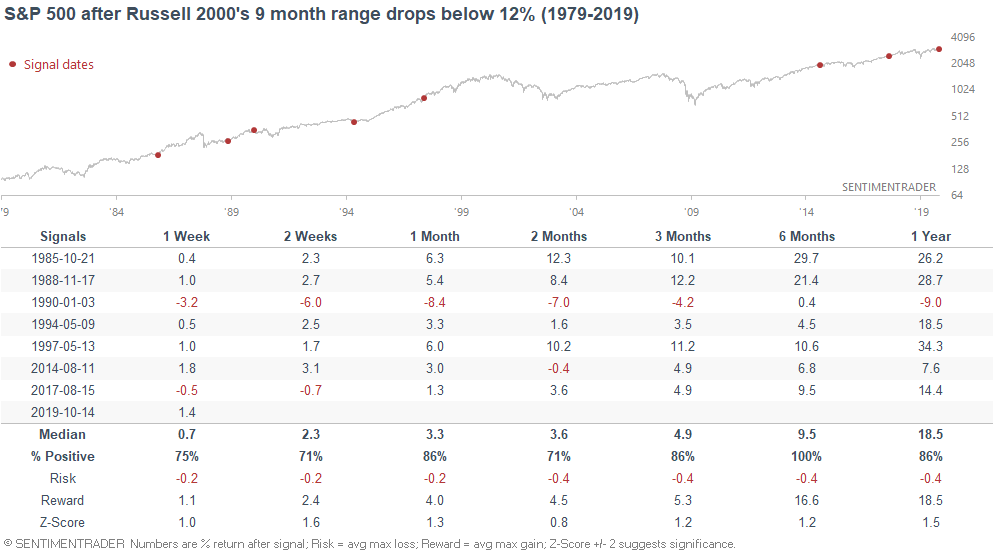
As I noted on Tuesday, the Russell 2000's 9 month range (maximum/minimum) has dropped to less than 12%. In other words, small caps are stuck and have gone nowhere. When the Russell was stuck in a small range in the past, the Russell and the S&P 500 rallied over the next 6 months:
Correlations
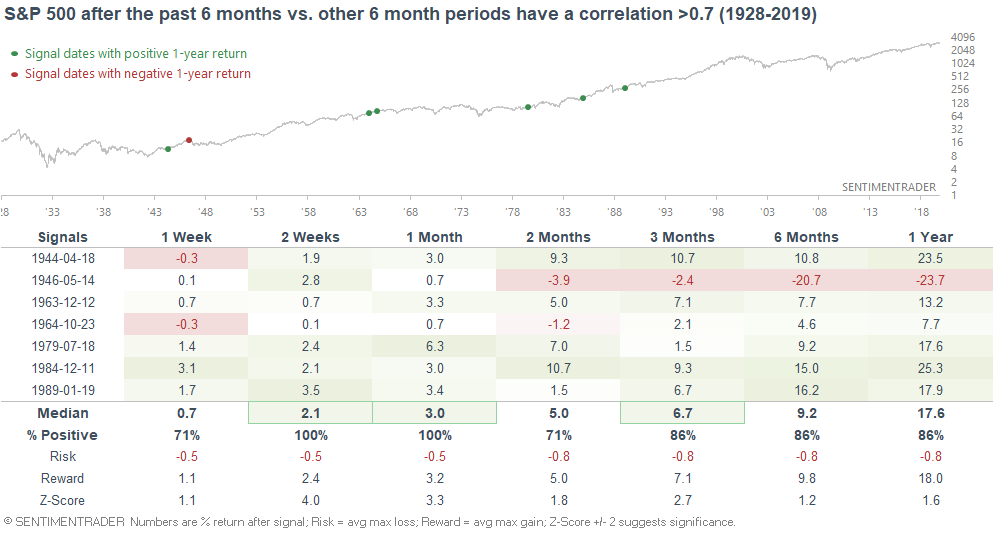
As I mentioned on Wednesday, the S&P has chopped sideways for the past 6 months. When we compare this with other 6 month periods and see which have the strongest correlations, the S&P performed well on all time frames:
Neutral/bearish:
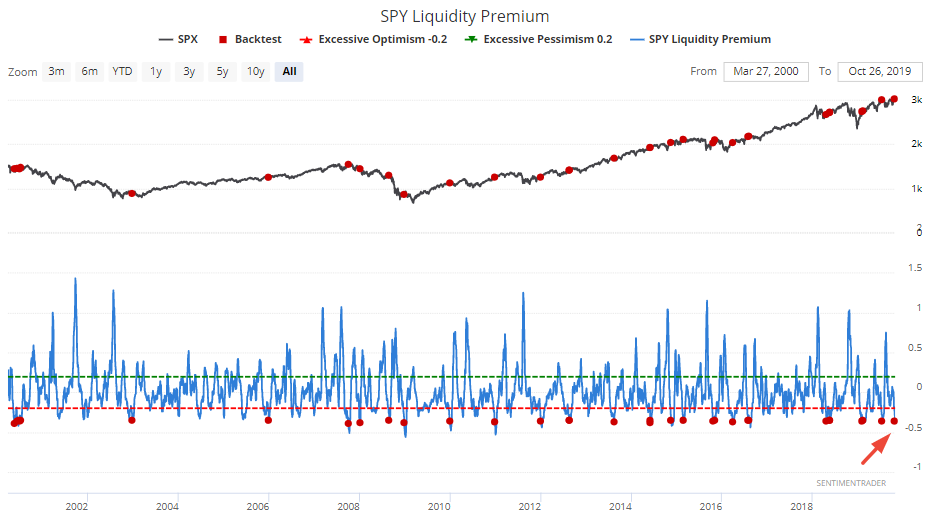
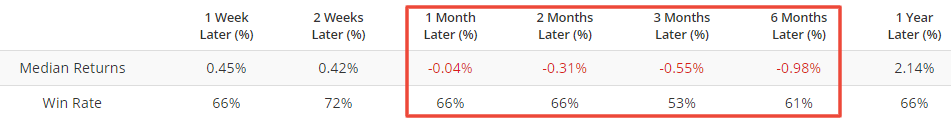
SPY Liquidity Premium
Our SPY Liquidity Premium indicator has fallen to -0.36. When it did so in the past, the S&P's returns over the next year weren't consistently bearish, but were certainly worse than random:
Technicals (1-2 months)
I don't have a strong conviction on the U.S. stock market over a 1-2 month period. The short term is usually hard to predict, unless there is a compelling extreme. There are few compelling short term extremes right now.
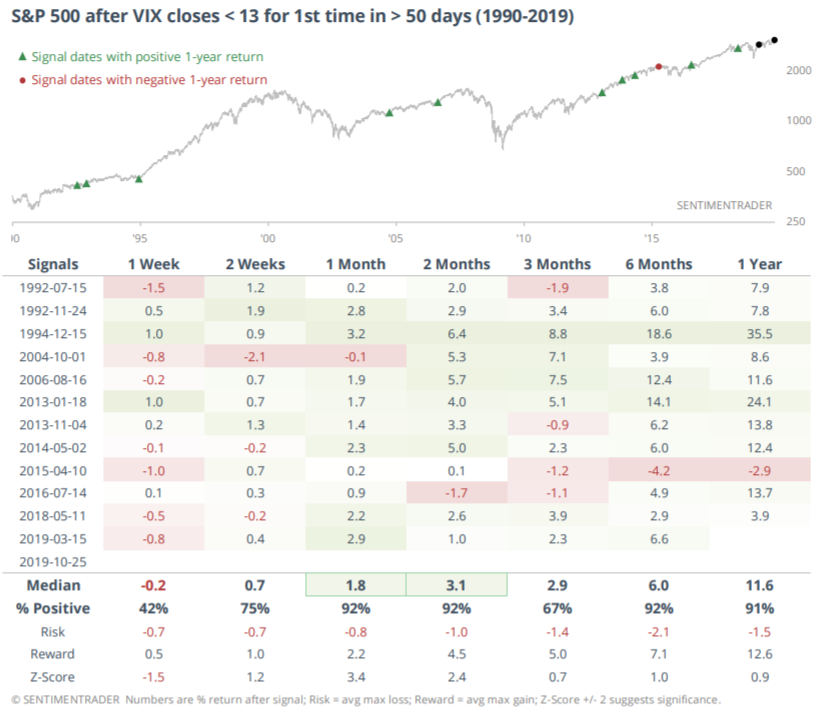
Volatility
As Jason noted on Friday, VIX fell below 13 for the first time in more than 50 days. When it did so in the past, the S&P was very bullish over the next 1-2 months. Moreover, the S&P only witnessed one minor loss over the next 6-12 months:
To recap
- Long term risk:reward doesn’t favor bulls.
- Fundamentals (6-12 months): still bullish because there is no significant U.S. macro deterioration.
- Technicals (3-6 months): neutral/bullish
Got any questions/comments? Feel free to email me at [email protected]