What I'm looking at - correlations, Fidelity Funds Breadth, KBW Bank Index, SPY Liquidity Premium, Value
Here's what I'm looking at:
Correlations
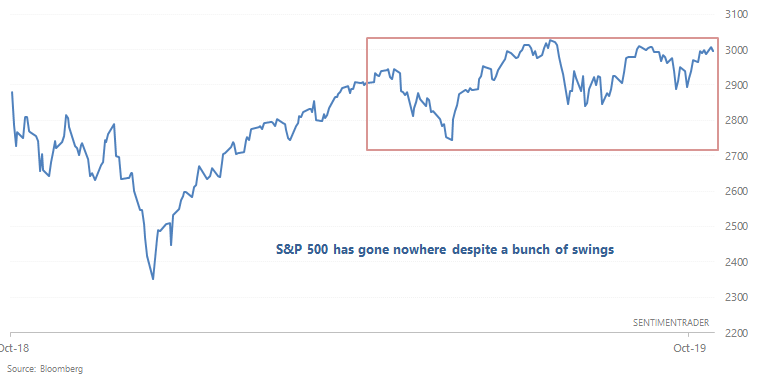
The U.S. stock market has swung around over the past 6 months, plenty of market watchers have called for crashes/surges, but overall, the stock market has gone nowhere. This outcome was not unexpected. After a big rally in January-April, it's hard for stocks to keep rallying at the same pace it did earlier this year. But now that the stock market has been consolidating in a narrow range for months, can it breakout on the upside? Will stocks rally into year-end?
The following table compares the S&P over the past 6 months with other 6 month historical periods, and looks for correlations that are greater than 0.7:
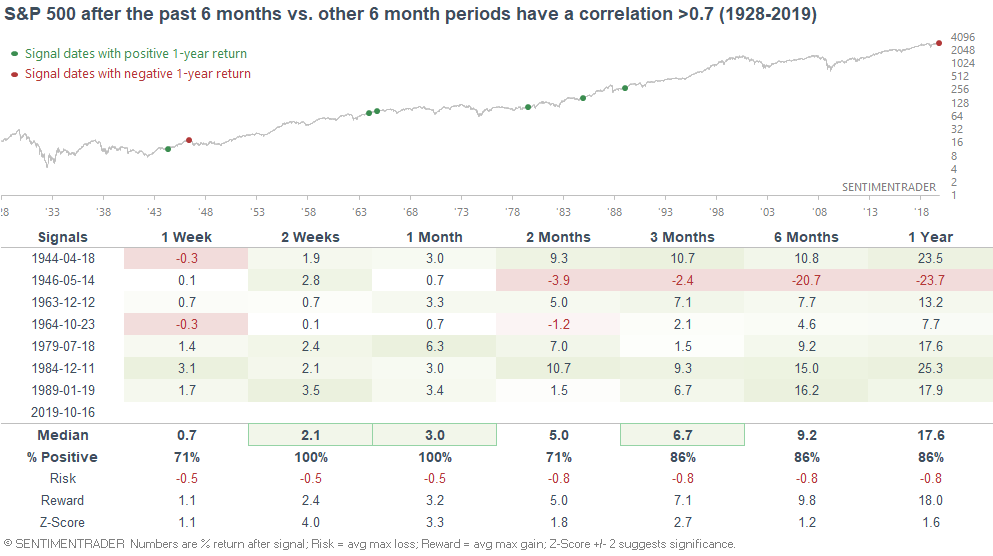
As you can see, the most similar periods (with a correlation >0.7) were mostly bullish for stocks over the next year. The one big exception was 1946, as investors assumed that the end of WWII would lead to an economic slowdown (as the end of WWI did).
Fidelity Funds Breadth
With the stock market near all-time highs, our Fidelity Funds Breadth indicator has remained quite low over the past 3 weeks.
*Fidelity Funds Breadth tracks the % of Fidelity Select mutual funds that have outperformed short term Treasury Bills over the past quarter.
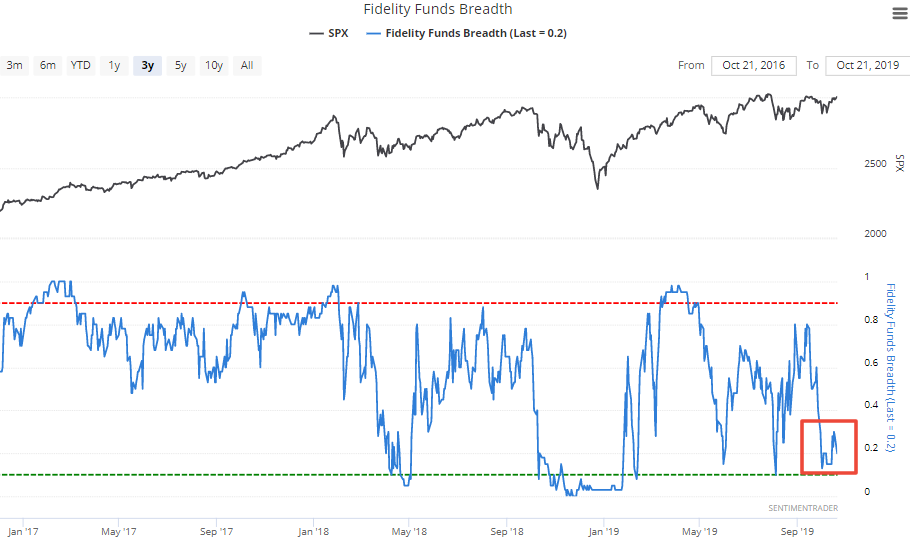
Looking at historical cases in which Fidelity Funds Breadth was less than or equal to 30% for 16 days...
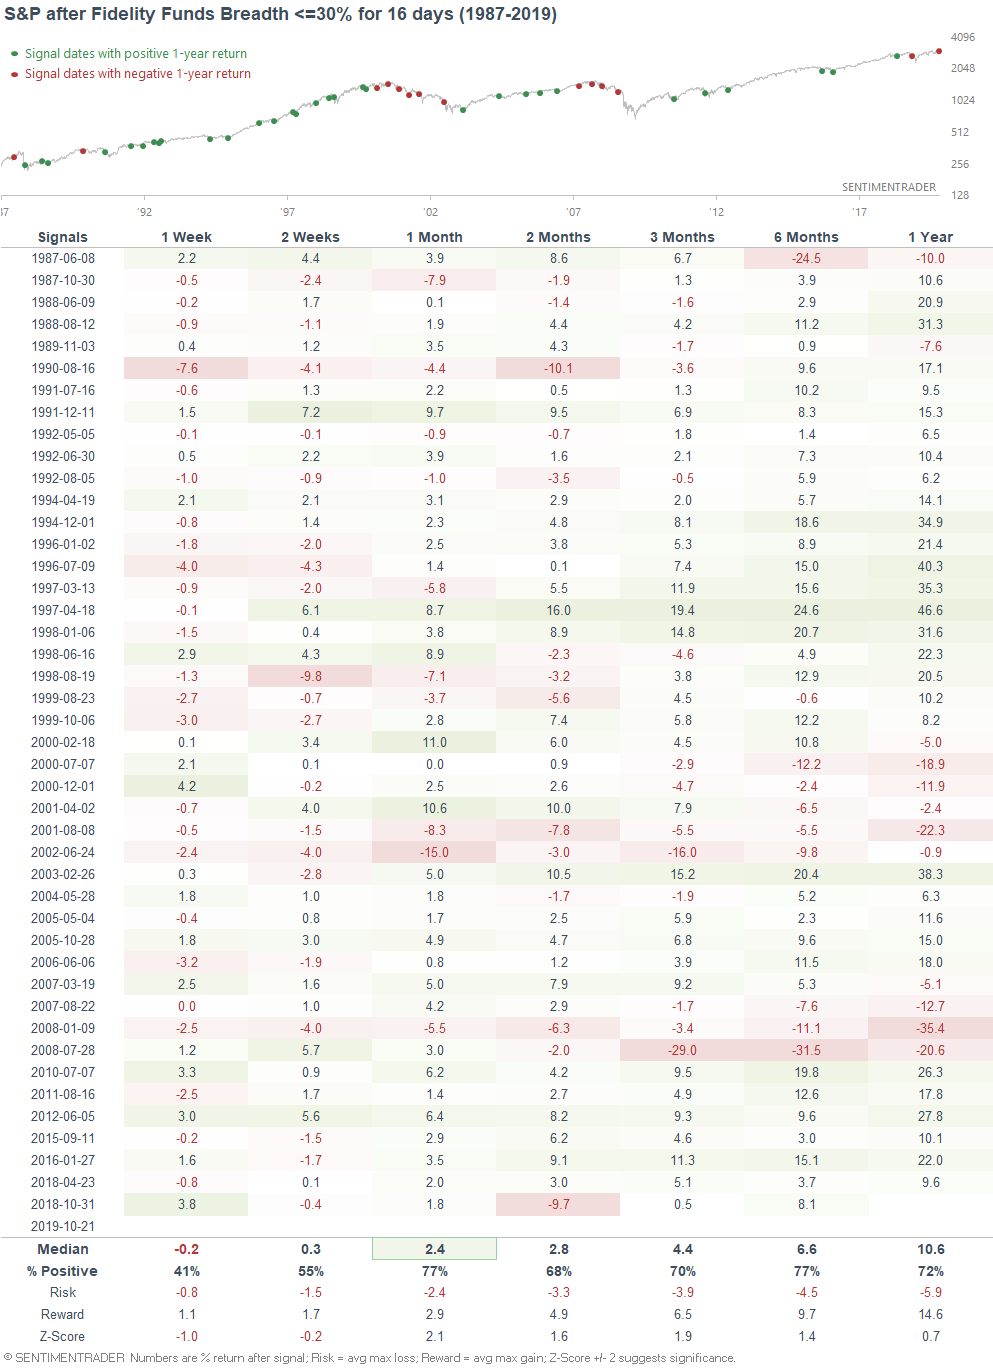
...the S&P's returns over the next month are mostly bullish. If we isolate for cases that occurred while the S&P was within 5% of a 1 year high...
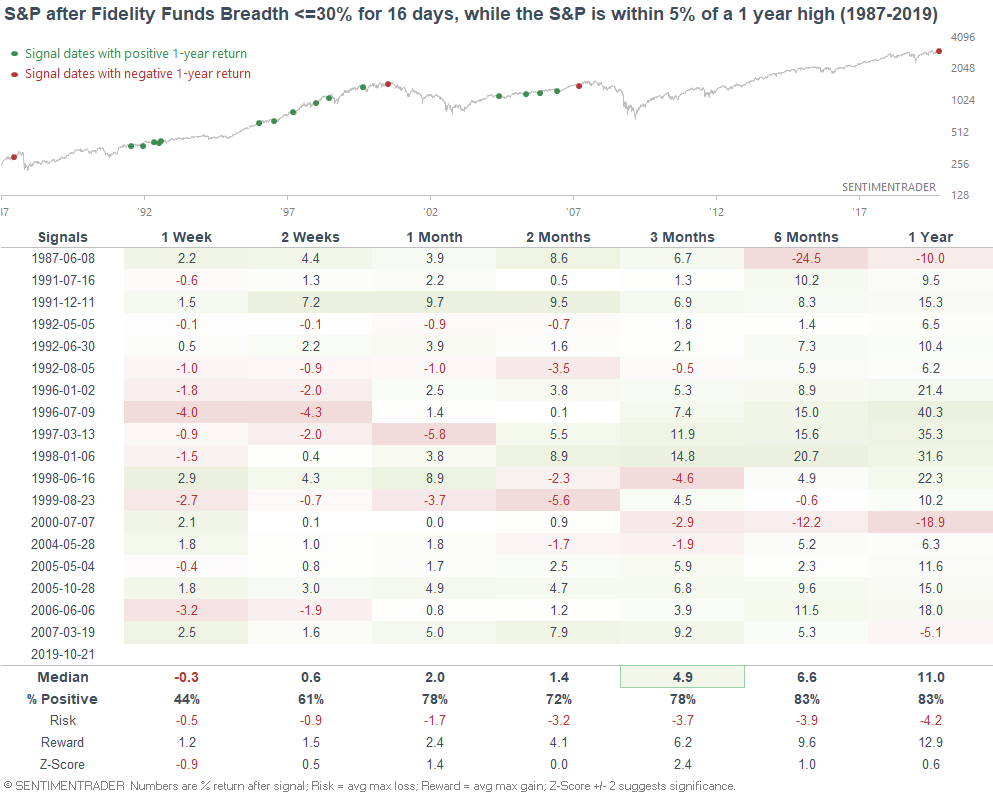
...the S&P's returns over the next 3 months become more bullish.
KBW Bank Index breakout
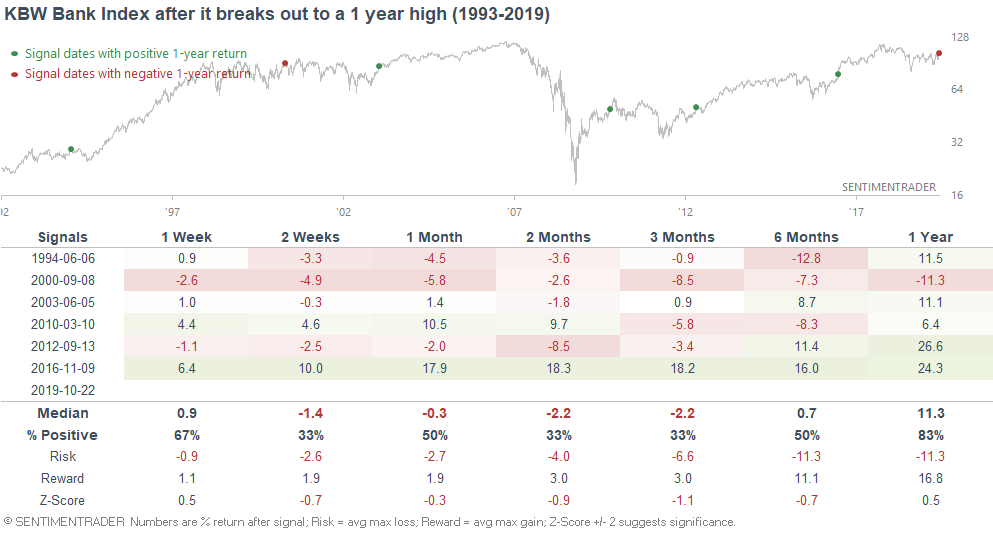
With the yield curve steepening recently, financial stocks have outperformed over the past 2 weeks. As a result, the KBW Bank Index has broken out to the highest level since October 2018:

When this bank index broke out to a 1 year high in the past, it typically faced weakness over the next 2-3 months, even if there were more gains over the next year:
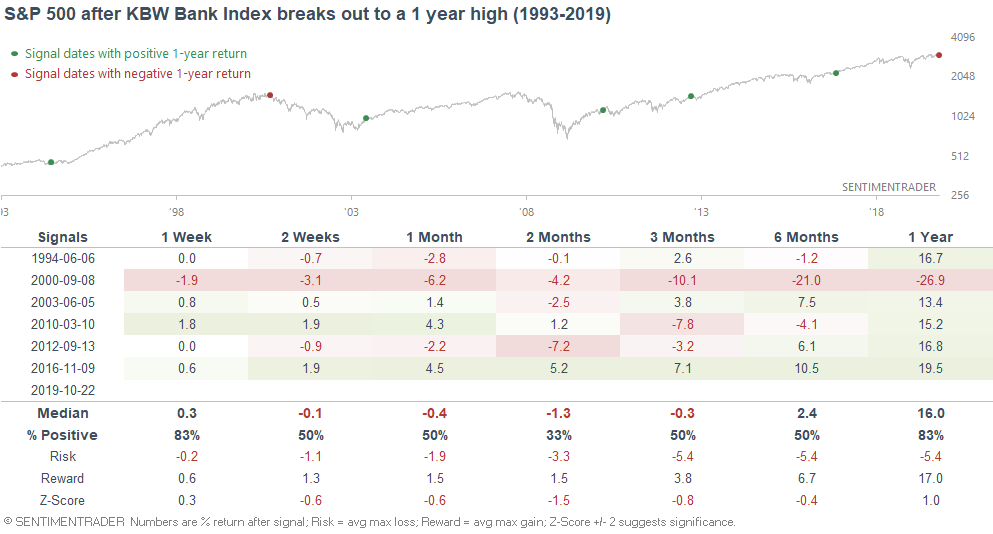
For what it's worth, here's what the S&P 500 did next:
SPY Liquidity Premium
Our SPY Liquidity Premium indicator has dropped below -0.25. This implies that market participants are becoming less interested in liquid instruments such as popular index ETFs such as SPY and more interested in less liquid instruments such as the S&P's underlying stocks.
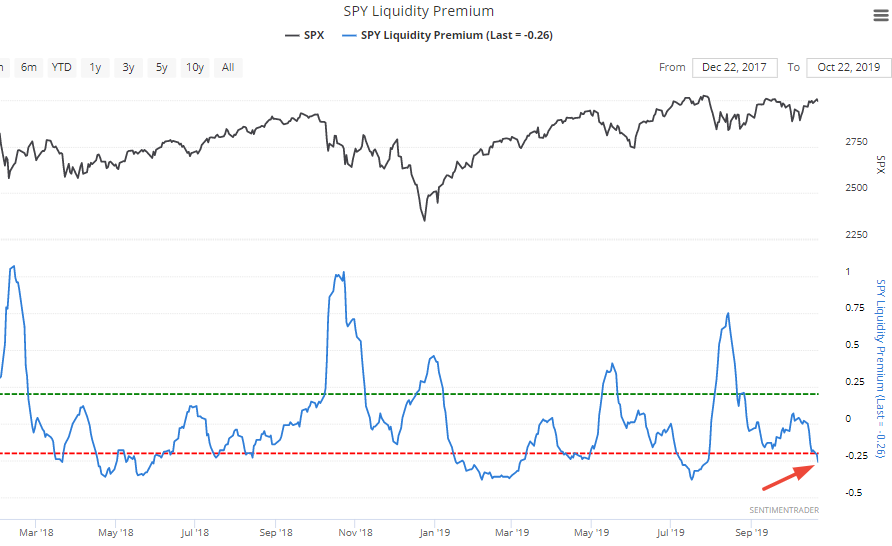
As I examined last month, readings below -0.3 are not quite consistently bearish for the stock market, but do represent worse-than-random returns.
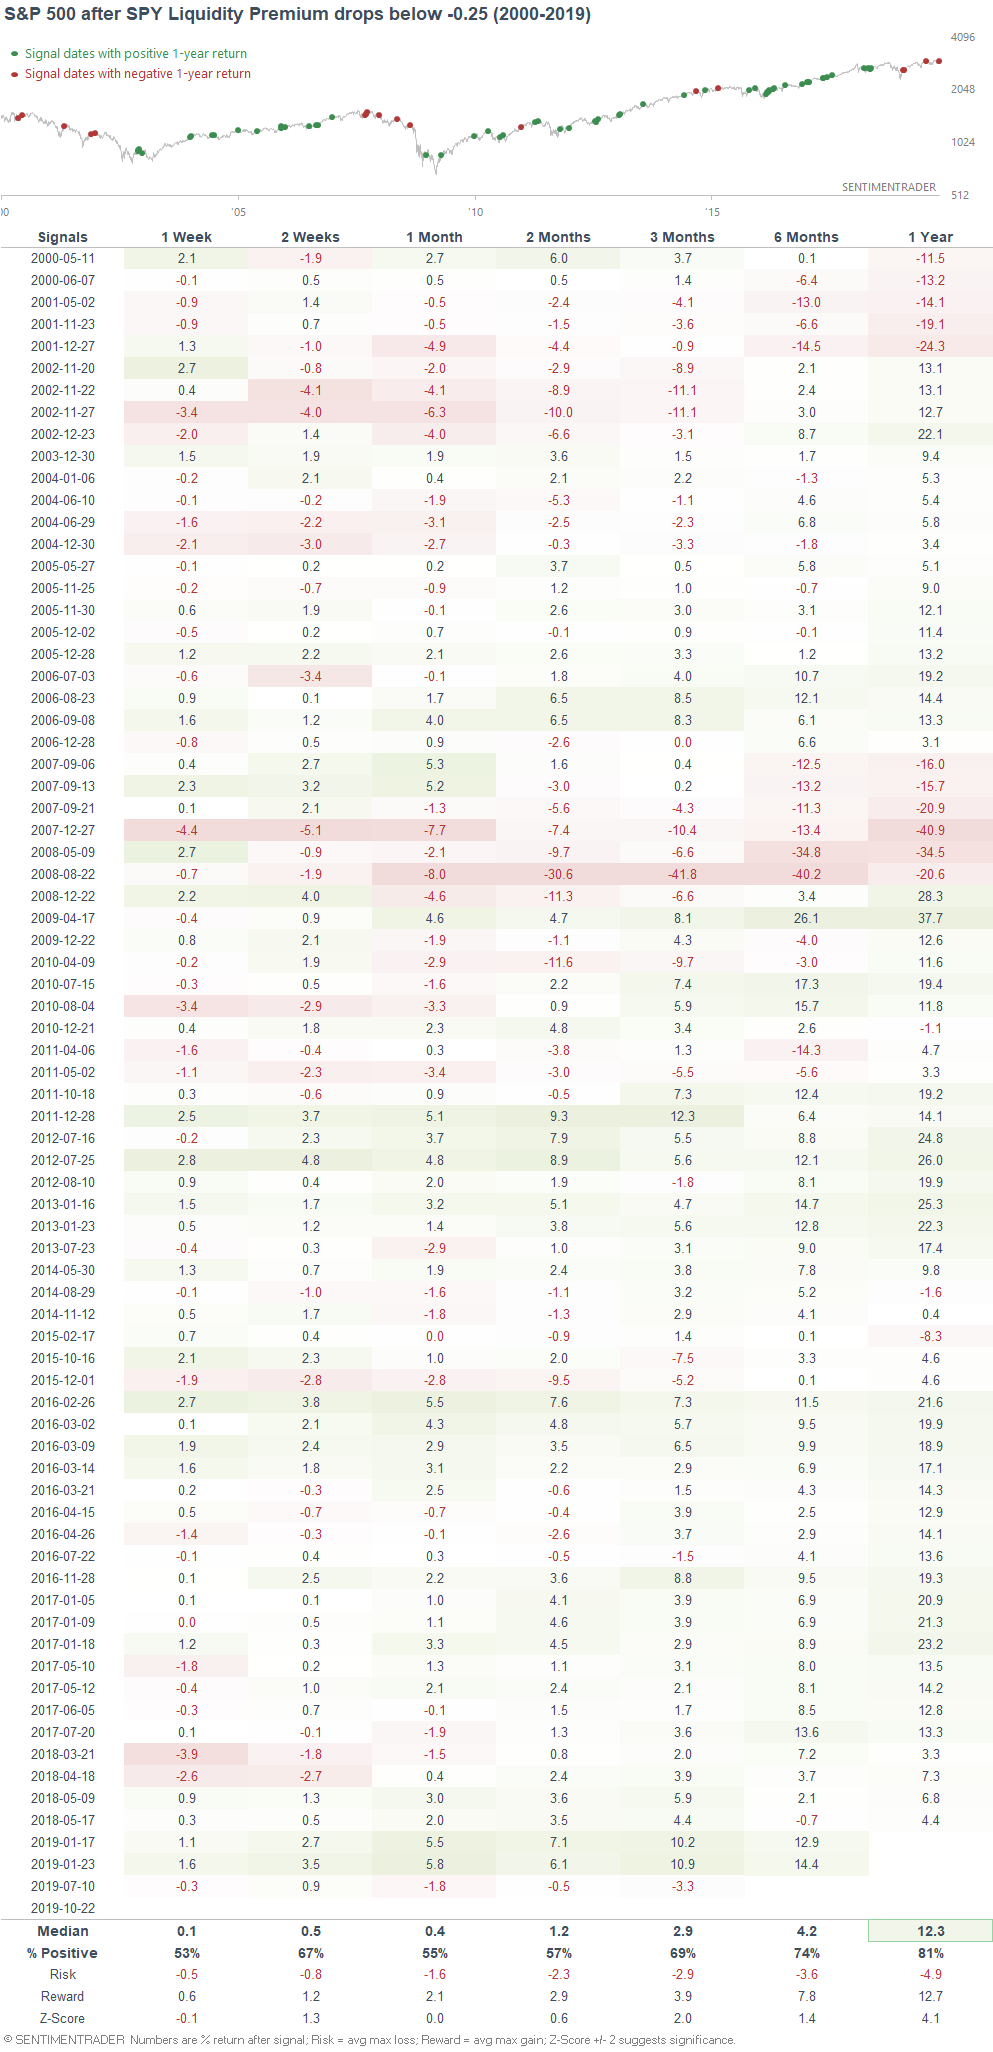
Similarly, readings below -0.25 aren't necessarily bearish for the S&P over the next month. However, it is typically better to hold bonds instead of stocks when the Liquidity Premium drops below -0.25
Overall, I wouldn't consider this to be a significant bearish factor for stocks right now, but watch out if SPY Liquidity Premium drops to -0.3 or lower.
Value
As Zerohedge and Jason noted, value is having its day in the sun again. I agree with Jason's bullish assessment on value over the next 1-3 years. Even if we do get a bear market or recession sometime over the next 1-3 years, value tends to outperform growth in a bear market or recession.
However, I'm not sure about the short-medium term.
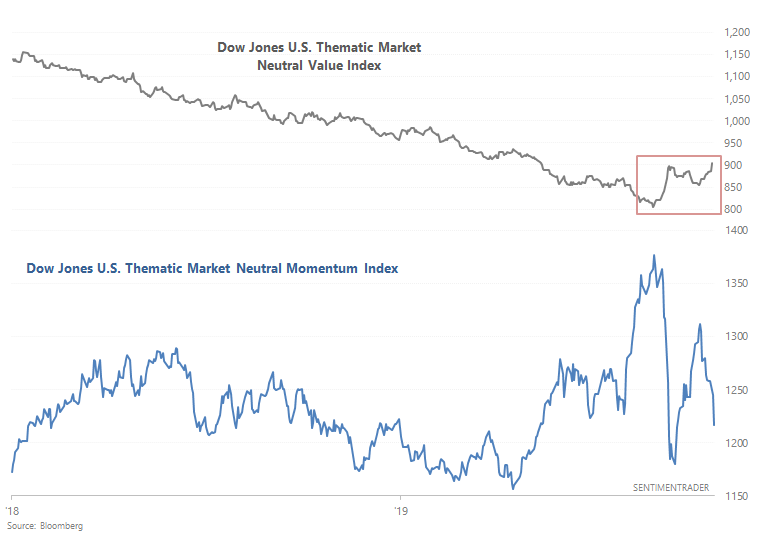
Here's what happened next to the Dow Jones U.S. Thematic Market Neutral Value Index after it broke out to a 5 month high:
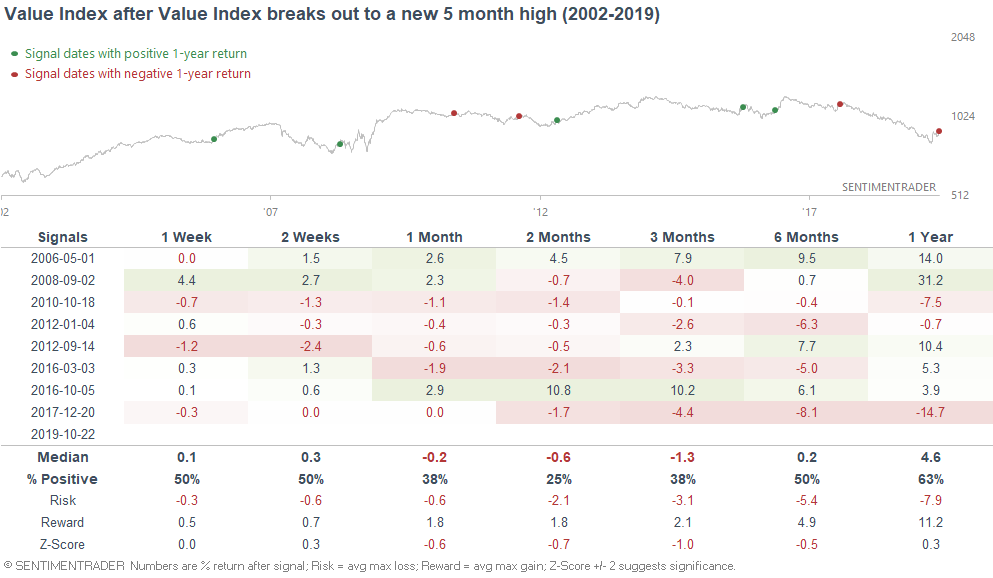
As you can see, value didn't necessarily go up over the next 1-3 months. But perhaps this time is different, with value/growth being at a long term extreme. As a rule of thumb, when different time frame studies conflict with eachother, the higher time frame usually overrides the lower time frame. Macro over micro, big picture over small picture.
Moreover, the Dow Jones U.S. Thematic Market Neutral Value Index's historical data is limited. So this skews the results, considering that value has done underperformed during this long bull market.
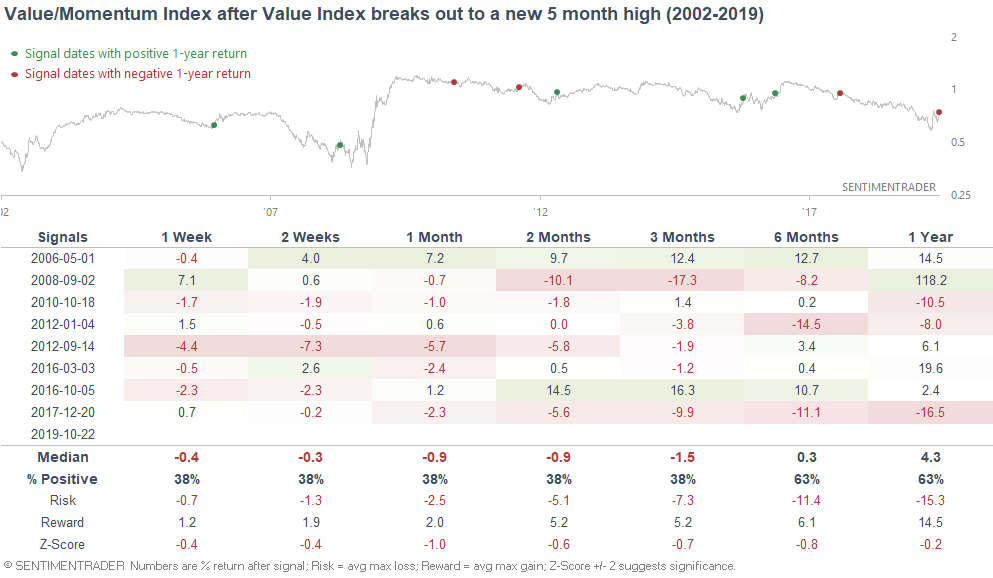
As a side note, here's what Value/Momentum did next: