Headlines
|
|
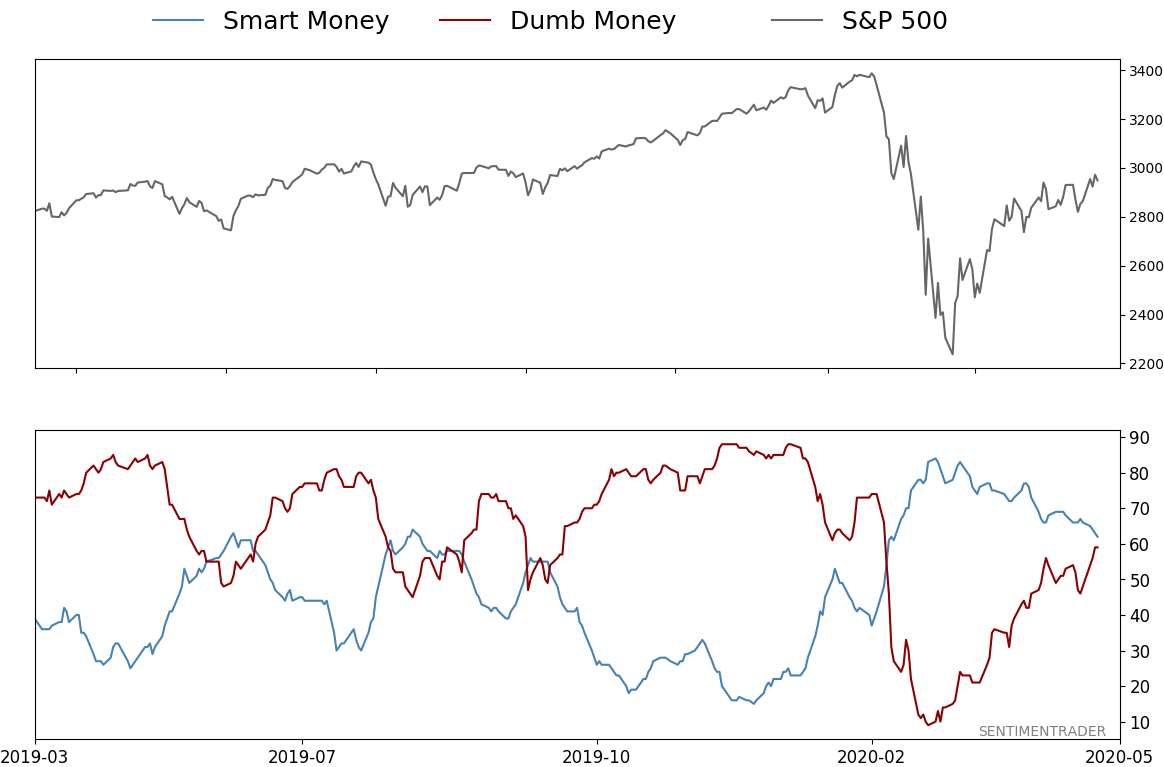
The spread between Smart and Dumb Money is narrowing:
For the first time in months, sentiment is becoming equal between "smart money" and "dumb money" indicators. When that happens and stocks are still in longer-term downtrends, it has tended to lead to poor returns. The biggest caveat to that is if buyers persist shorter-term, it has indicated powerful longer-term recoveries.
The options market hasn't done this since 2002:
Over the past 3 days, the Equity-only Put/Call Ratio has been below 0.5, meaning options traders turned over half has many puts as calls, typically a sign of optimism. Stocks have struggled when the ratio was this low over a 3-day period, and it hasn't happened since 2002 when the S&P 500 was below its 200-day average.
Nasdaq's recent run: In early April, we noted that while people were obsessed with the percentage rally off the low, the most important part was the speed and amount of the decline's retracement. That was among the most bullish aspects of the rally, and suggested it wasn't just "another bear market rally." The Nasdaq, for its part, has nearly erased a bear market within two months. In a premium note, Troy shows that the other times the Nasdaq did this, it was higher a year later all 6 times. There are definitely reasons to worry, though those are mostly focused on the short- to medium-term. The speed and amount of the recovery so far is on a scale where it has rarely failed longer-term.
|
Smart / Dumb Money Confidence
|
Smart Money Confidence: 62%
Dumb Money Confidence: 59%
|
|
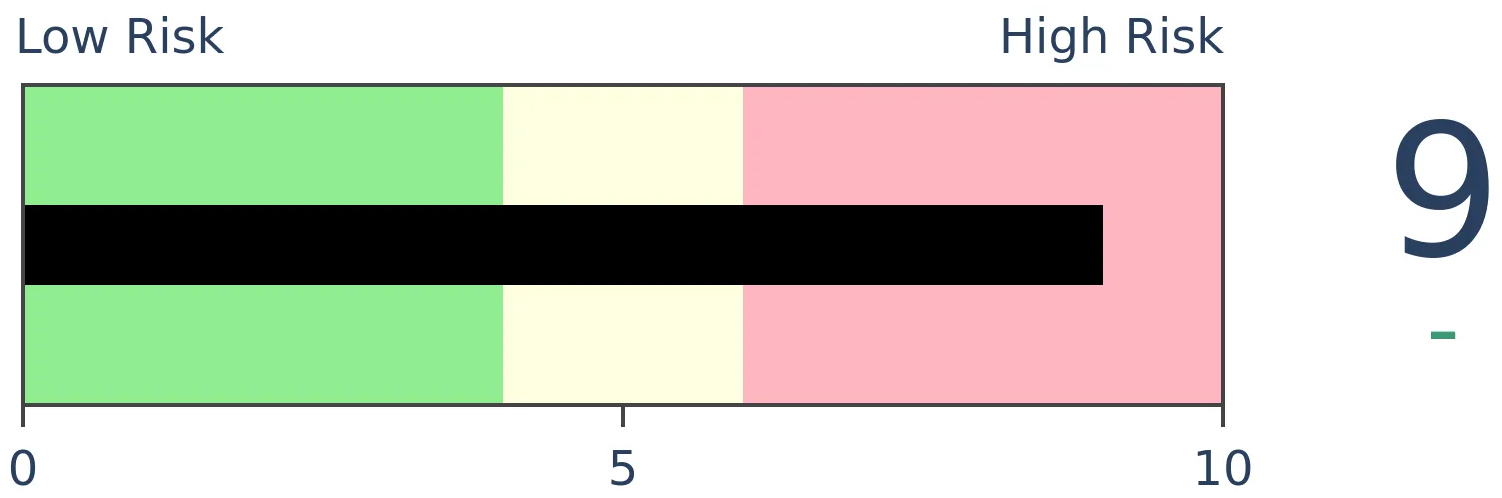
Risk Levels
Stocks Short-Term
|
Stocks Medium-Term
|
|
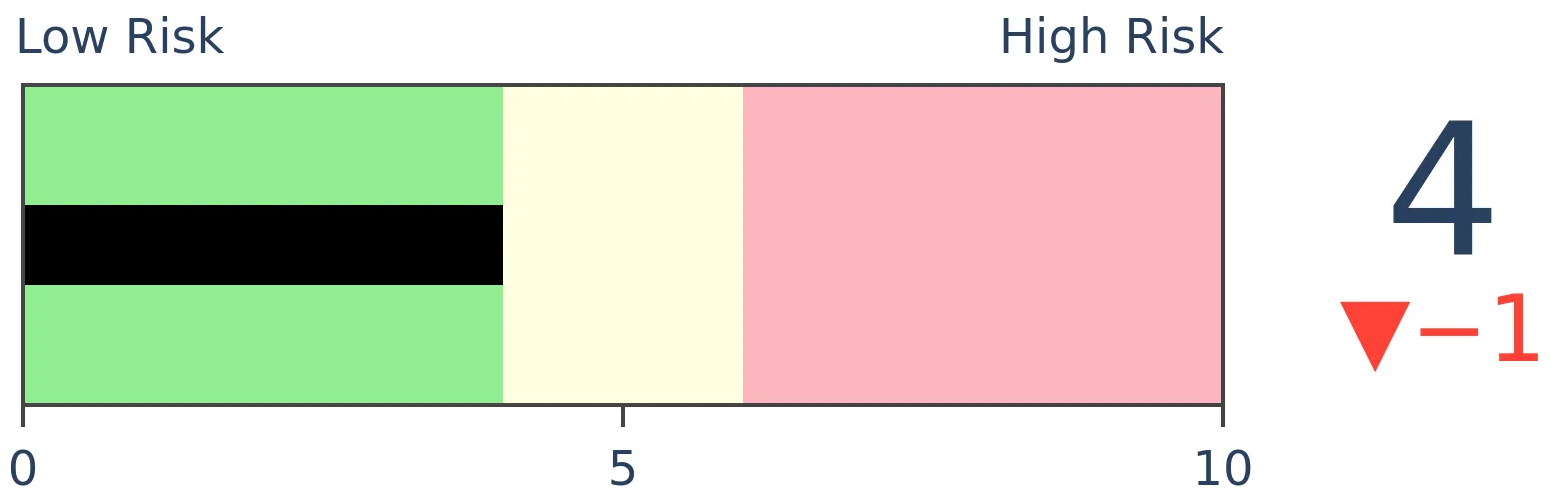
Bonds
|
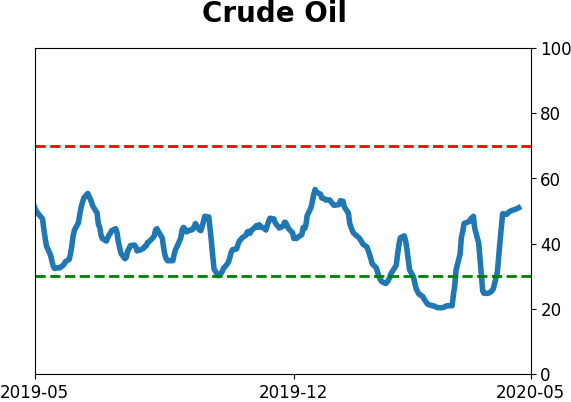
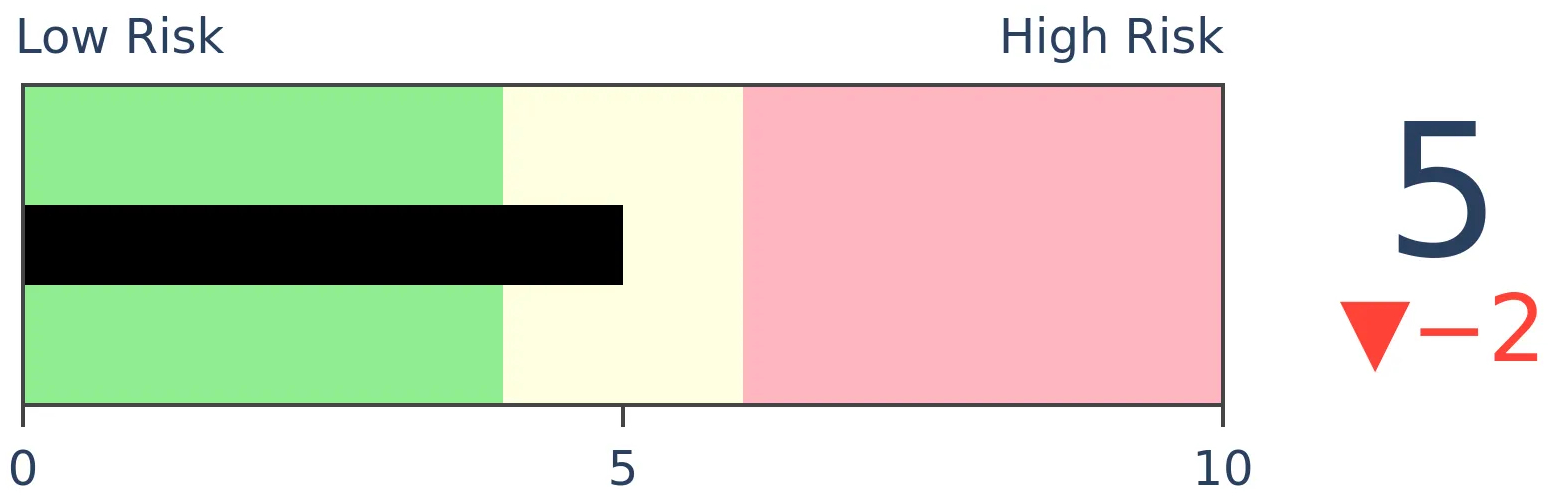
Crude Oil
|
|
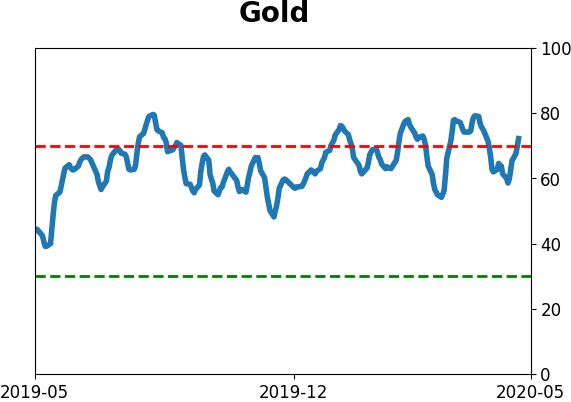
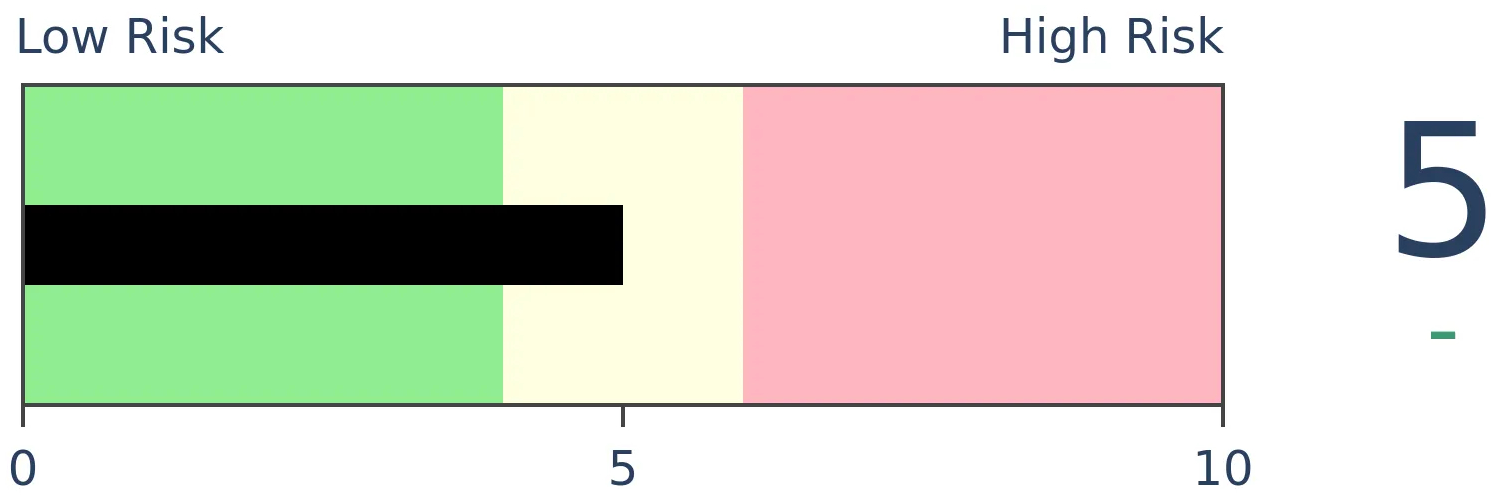
Gold

|
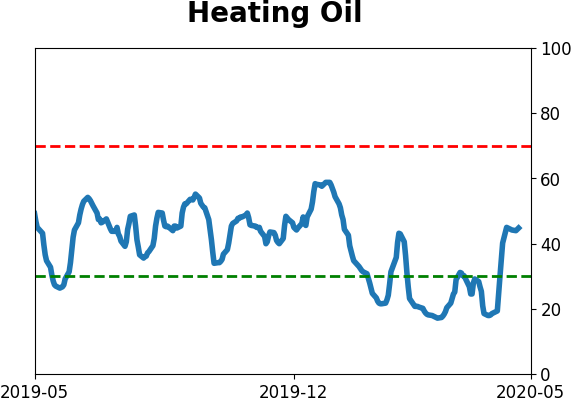
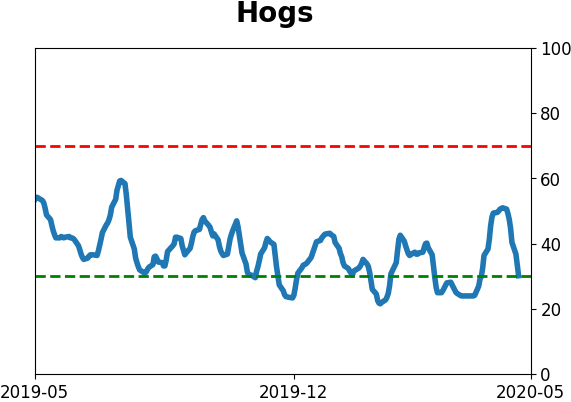
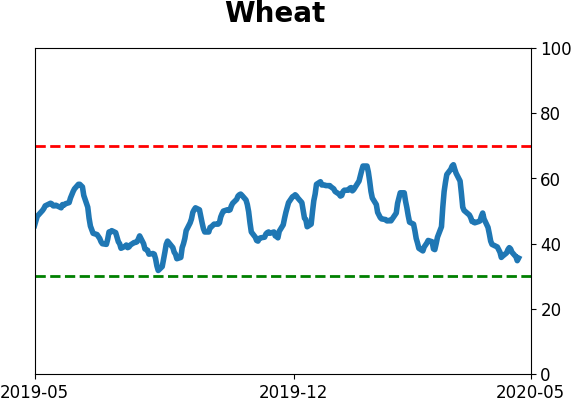
Agriculture

|
|
Research
BOTTOM LINE
For the first time in months, sentiment is becoming equal between "smart money" and "dumb money" indicators. When that happens and stocks are still in longer-term downtrends, it has tended to lead to poor returns. The biggest caveat to that is if buyers persist shorter-term, it has indicated powerful longer-term recoveries.
FORECAST / TIMEFRAME
SPY -- Down, Medium-Term
|
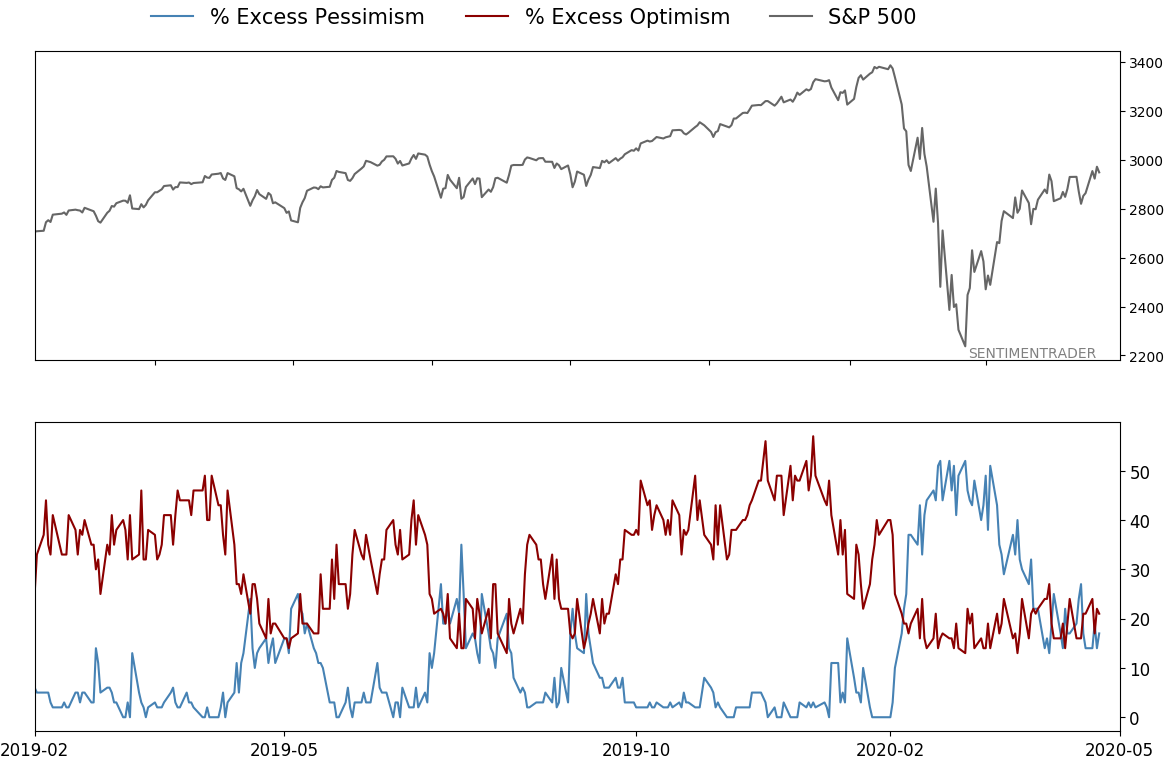
In January and February, there was a pretty clear consensus among our indicators - sentiment was extremely optimistic. In March, that consensus had flipped 180 degrees.
Now that we're in the post-panic chop, there is much less of a unified picture. We've discussed this several times recently, like some surveys and other measures showing pessimism while the behavior of options traders suggests overwhelming optimism.
It gets confusing, which is why we like to rely more heavily on aggregate models that take most of those factors into account. When we do that, we can see that both Smart Money Confidence and Dumb Money Confidence are both high, which is confusing in itself. Normally, the two move opposite each other.
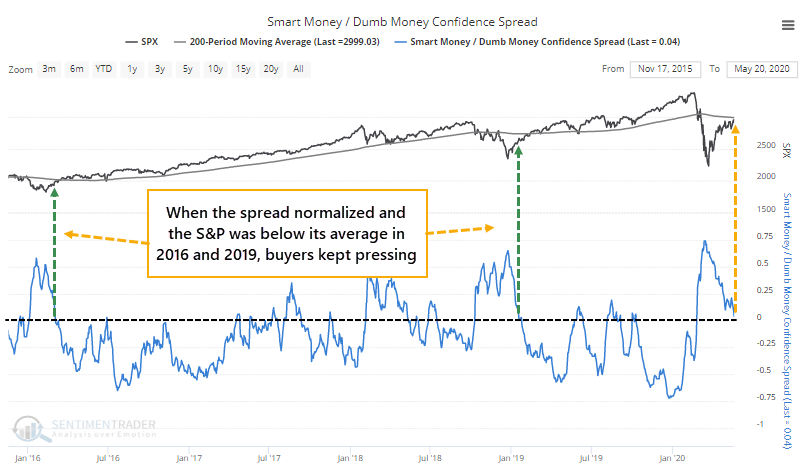
Even so, the spread between them is nearing zero. During bear markets, we start to enter the danger zone when sentiment becomes neutral after bouts of severe pessimism. That's where we are now.
This happened in 2016 and 2019 as well. The spread neared zero while the S&P 500 was still below its 200-day average. After those, buyers persisted and that was a good sign longer-term.
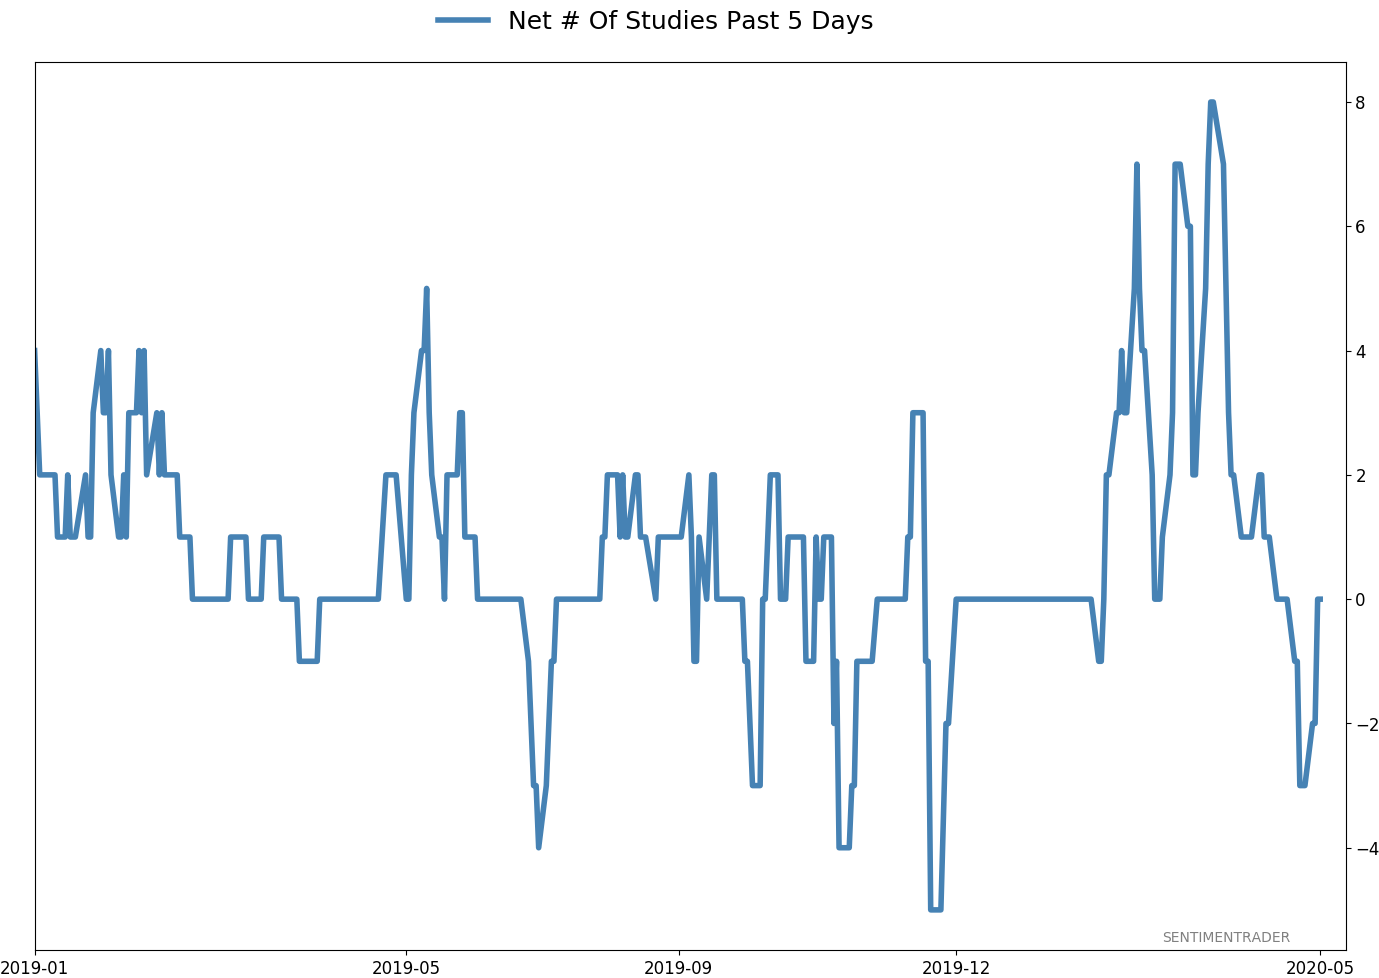
Below, we can see other times when the spread narrowed after at least a month of being above +5%. These are only times when the S&P was below its 200-day average at the time.
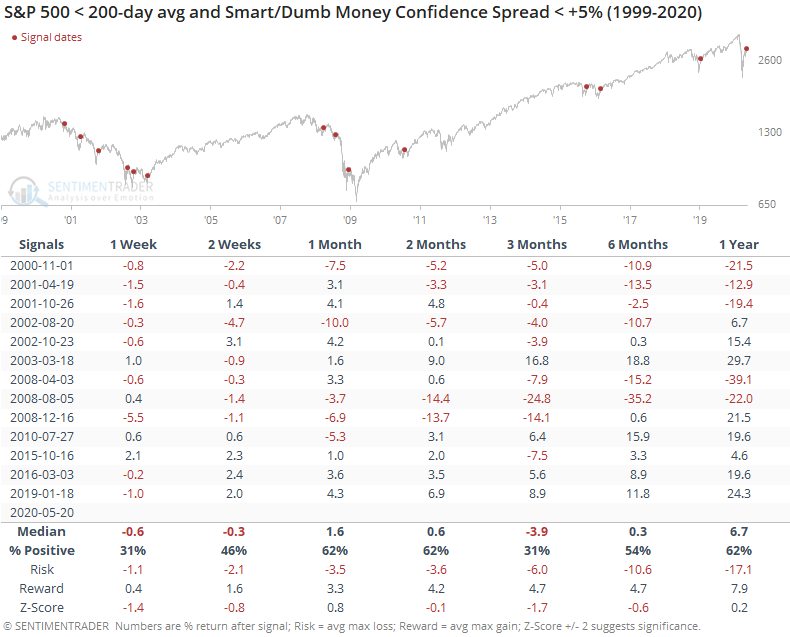
There was a decent correlation between the S&P's returns over the next two weeks and its returns over the next year. That suggests at least a weak pattern like we saw the last two times - if buyers persisted shorter-term, then they were likely to persist longer-term, too.
All but three of these signals showed a negative return either 1, 2, or 3 months later. Those were the recovery in early 2003, then again in 2016 and 2019 as shown above. Stocks are in a vulnerable stretch here, with the tailwind of excessive pessimism mostly gone. Now it has to trade on its merits. If those are strong enough to continue to propel it higher in the coming weeks to months, then it suggests a much longer recovery is in store.
BOTTOM LINE
Over the past 3 days, the Equity-only Put/Call Ratio has been below 0.5, meaning options traders turned over half has many puts as calls, typically a sign of optimism. Stocks have struggled when the ratio was this low over a 3-day period, and it hasn't happened since 2002 when the S&P 500 was below its 200-day average.
FORECAST / TIMEFRAME
None
|
On Monday, we saw that the smallest of options traders had become so aggressively optimistic about a continued rally that they established a record number of bullish versus bearish trades.
That sentiment seems to have spread to the options market at large. Over the past three sessions, options traders have turned over only half as many put contracts as call contracts. This is the first time in months that the 3-day average of the Equity-only Put/Call Ratio has been below 0.5.
The Backtest Engine shows that the S&P 500 has struggled when the ratio was this low. This is only the last 20 years - prior to that, the ratio was persistently low. The pricking of the internet bubble triggered an overall higher range in put/call ratios.
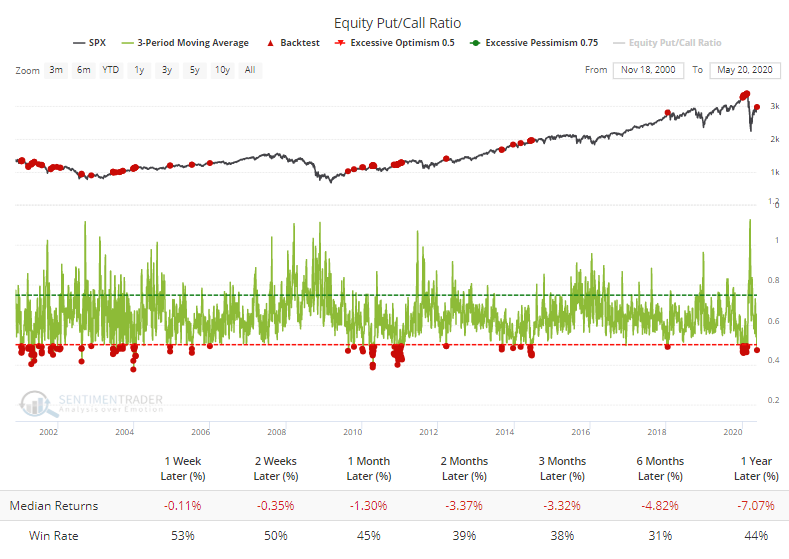
If we focus only on the first time that the 3-day average of the ratio fell below 0.5 in at least 30 sessions, then we get the following returns for the S&P 500.
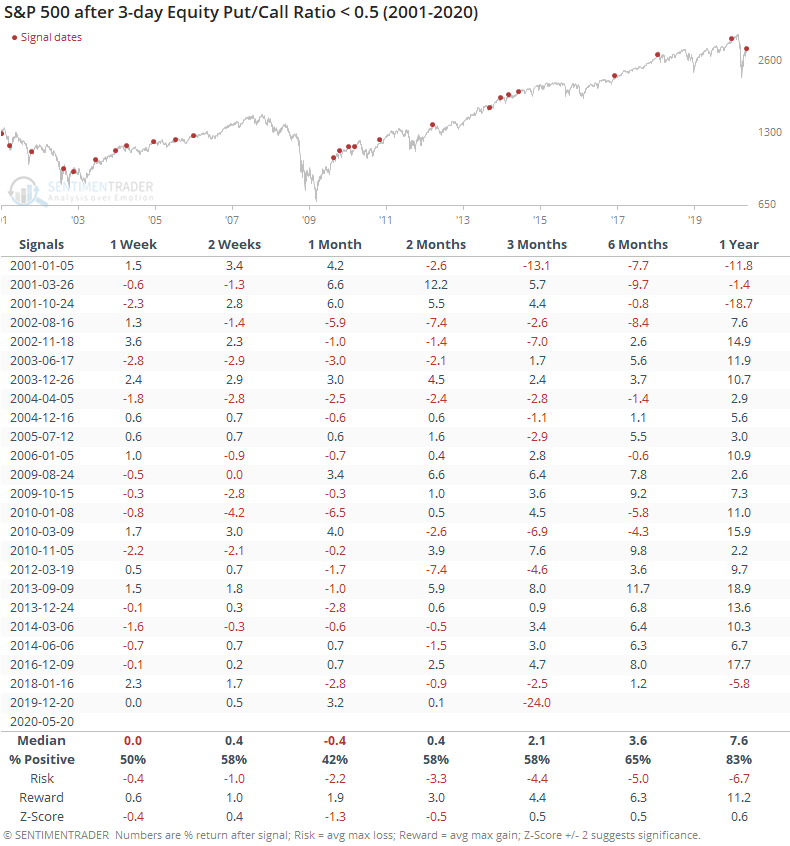
It still showed a flat to negative bias up to three months later in the risk/reward ratio. Of the 24 signals, 19 of them showed a negative return either 1, 2, or 3 months later.
What's especially notable now is that this apparent optimism is occurring while the S&P is still trading below its 200-day average. That has only happened in 2001 and 2002, never since.
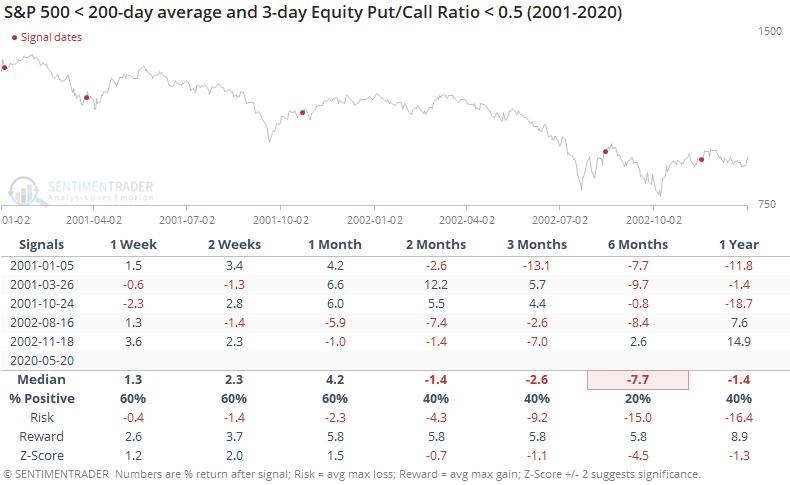
Returns were mixed after those, with it taking various lengths of time before the optimism wore off with lower prices. Because it was a protracted bear market, these bouts of optimism led to poor results over the next 2-6 months.
When we see readings like this lead to poor returns even during bull markets, the current level of options activity is a worry. The saving grace might be that we're early enough in a new bull market to run over any negatives like this, but that's placing a lot of faith in the idea that we've passed the worst of the damage.
Active Studies
| Time Frame | Bullish | Bearish | | Short-Term | 0 | 7 | | Medium-Term | 12 | 4 | | Long-Term | 37 | 3 |
|
Indicators at Extremes
Portfolio
| Position | Weight % | Added / Reduced | Date | | Stocks | 38.9 | Reduced 10% | 2020-05-13 | | Bonds | 0.0 | Reduced 6.7% | 2020-02-28 | | Commodities | 5.1 | Added 2.4%
| 2020-02-28 | | Precious Metals | 0.0 | Reduced 3.6% | 2020-02-28 | | Special Situations | 0.0 | Reduced 31.9% | 2020-03-17 | | Cash | 56.0 | | |
|
Updates (Changes made today are underlined)
In the first months of the year, we saw manic trading activity. From big jumps in specific stocks to historic highs in retail trading activity to record highs in household confidence to almost unbelievable confidence among options traders. All of that came amid a market where the average stock couldn't keep up with their indexes. There were signs of waning momentum in stocks underlying the major averages, which started triggering technical warning signs in late January. The kinds of extremes we saw in December and January typically take months to wear away, but the type of selling in March went a long way toward getting there. When we place the kind of moves we saw into March 23 into the context of coming off an all-time high, there has been a high probability of a multi-month rebound. After stocks bottomed on the 23rd, they enjoyed a historic buying thrust and retraced a larger amount of the decline than "just a bear market rally" tends to. While other signs are mixed that panic is subsiding, those thrusts are the most encouraging sign we've seen in years. Shorter-term, there have been some warning signs popping up and our studies have stopped showing as positively skewed returns. I reduced my exposure some in late April and was looking for a pattern of lower highs and lower lows to reduce it further. With weakness on May 12, our studies turned even more negative over the short- to medium-term so I reduced a bit more. Some short-term indicators are already nearing oversold so we may get a quick rebound but it is what it is. If we see a clear pattern of lower lows, I may reduce even further in the week(s) ahead. Long-term prospects look decent because of the thrusts we saw off the low, but I'm more comfortable in cash in the interim. I'd consider adding back if we see our indicators and studies start to skew to the upside again, or if price action turns clearly better, indicating my caution is wrong.
RETURN YTD: -7.9% 2019: 12.6%, 2018: 0.6%, 2017: 3.8%, 2016: 17.1%, 2015: 9.2%, 2014: 14.5%, 2013: 2.2%, 2012: 10.8%, 2011: 16.5%, 2010: 15.3%, 2009: 23.9%, 2008: 16.2%, 2007: 7.8%
|
|
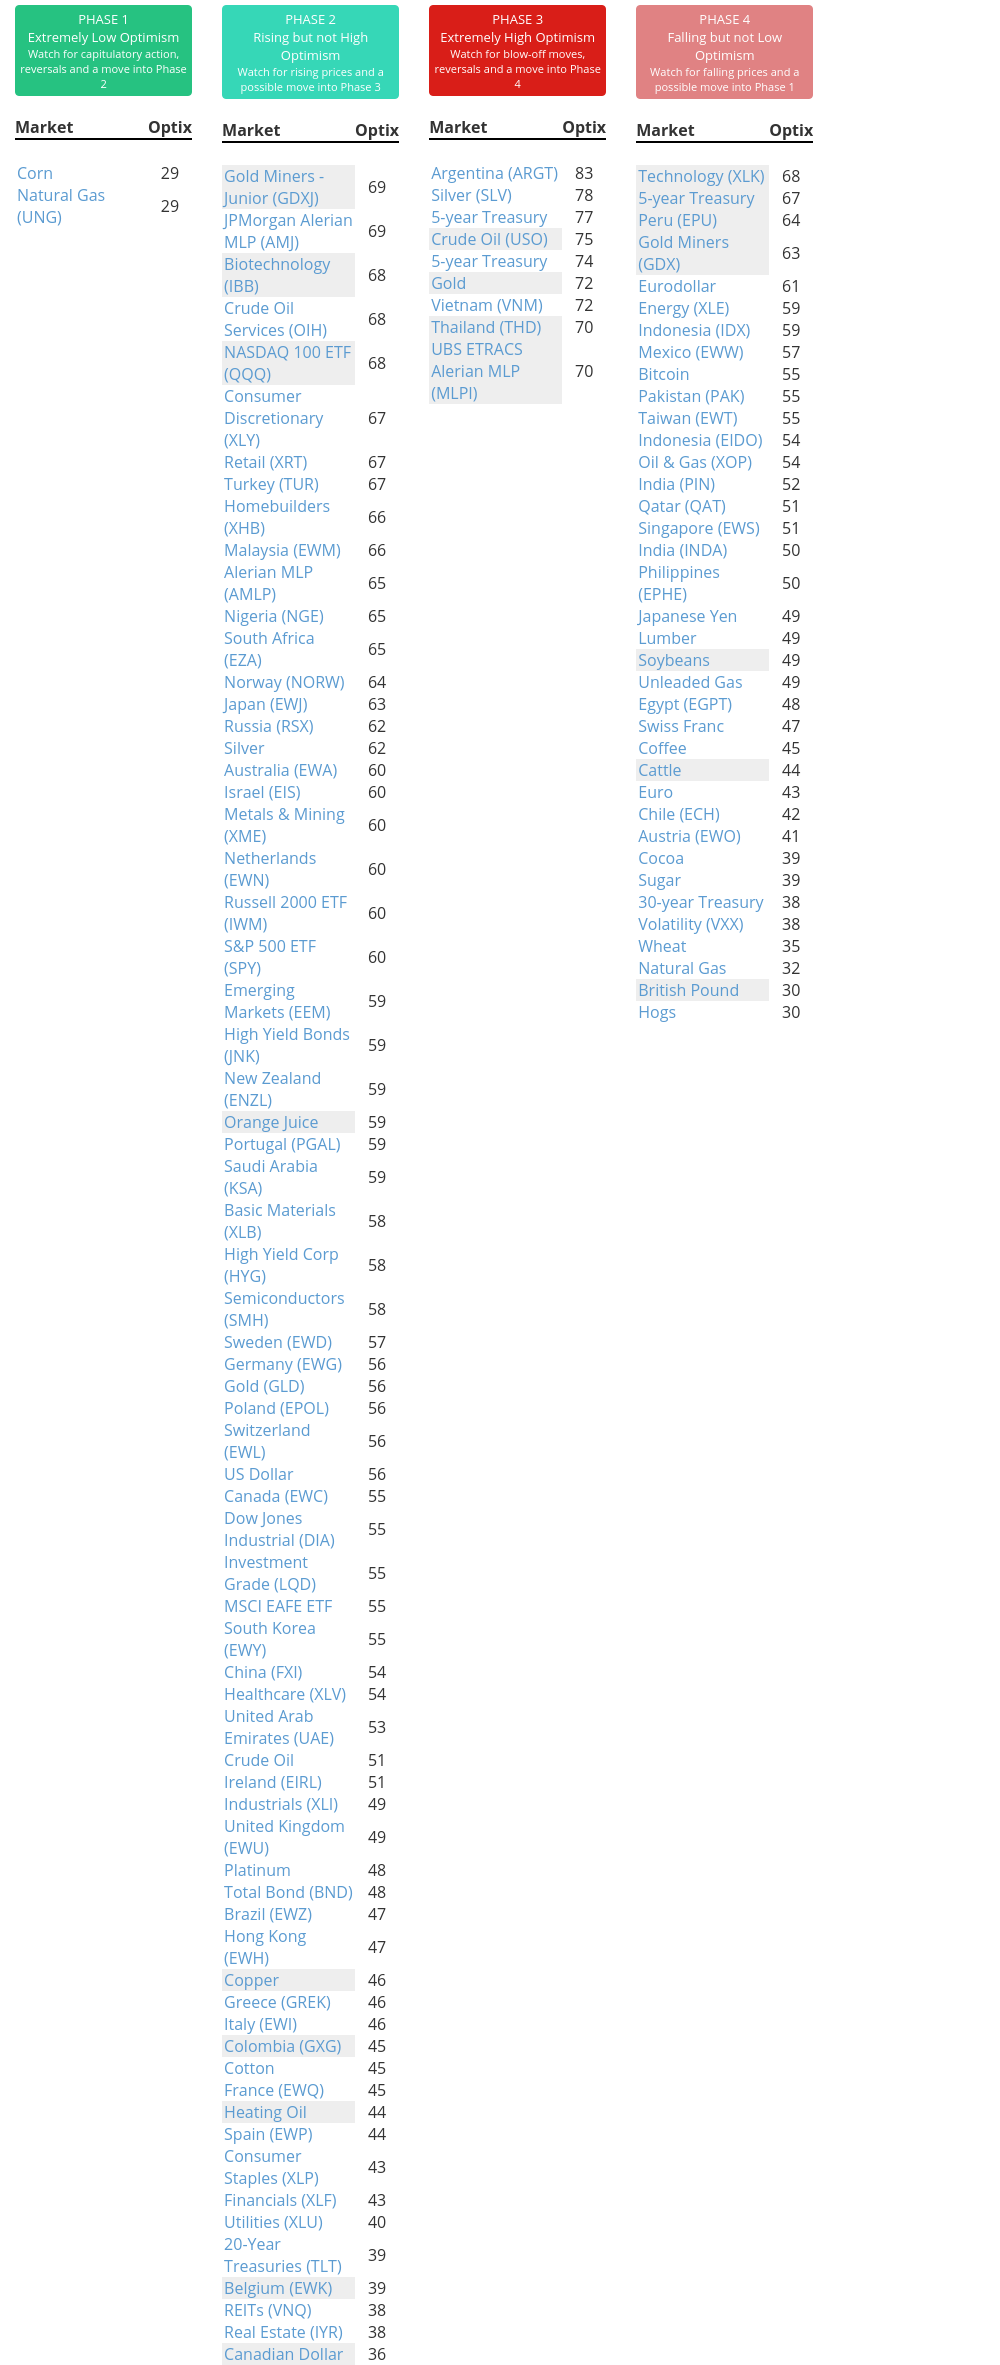
Phase Table
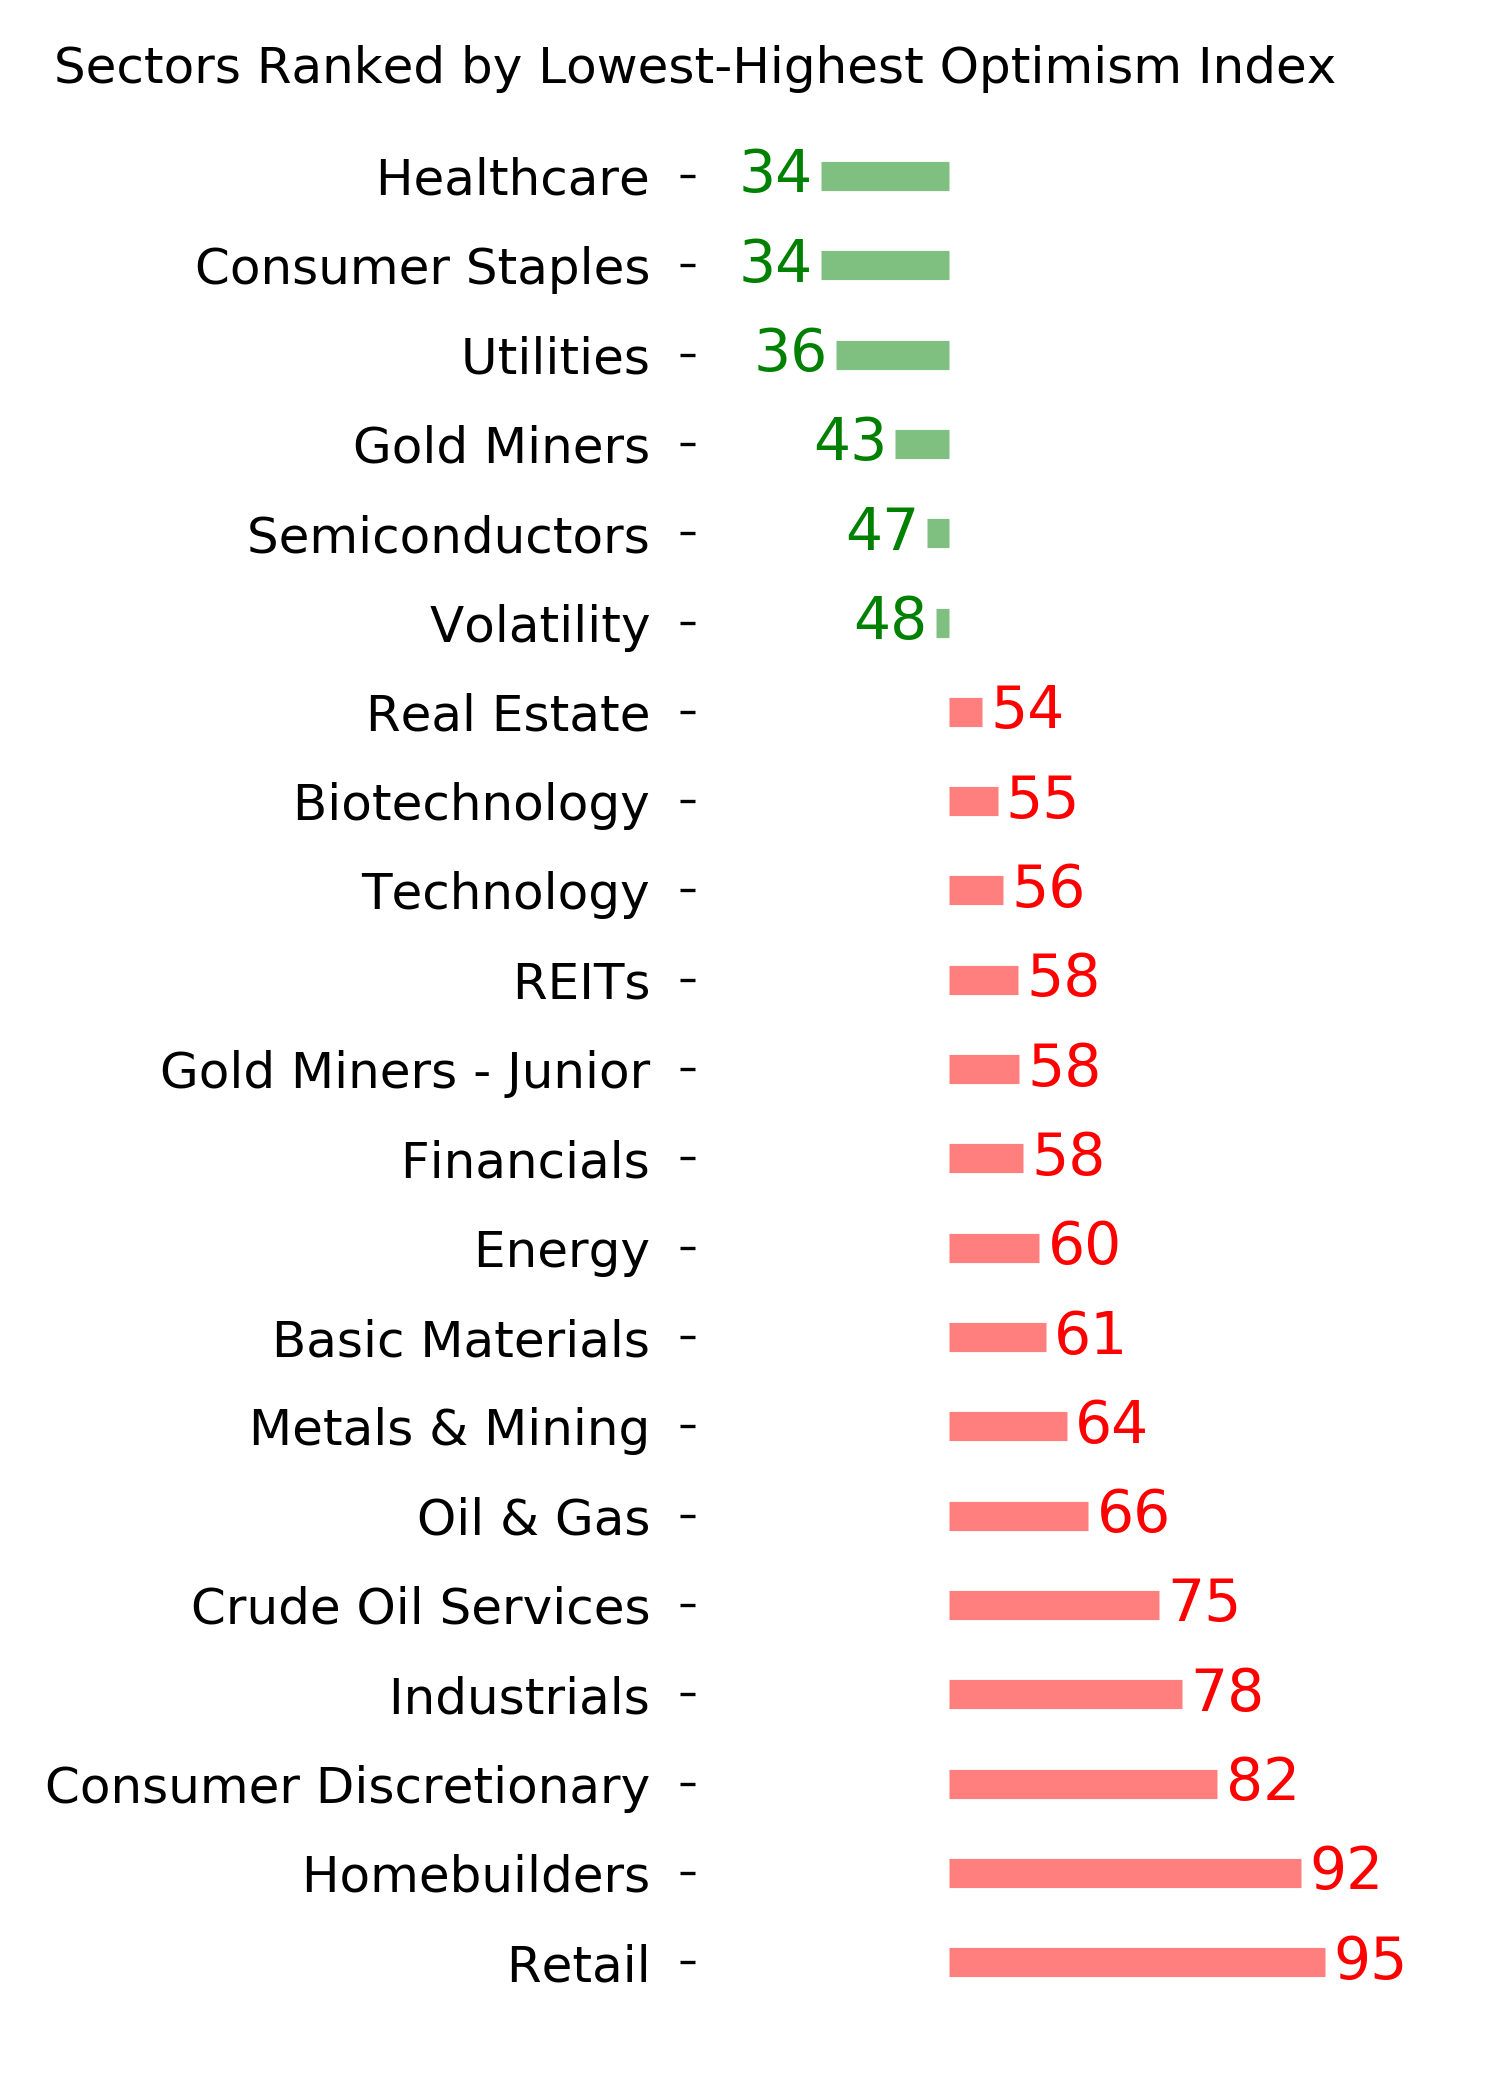
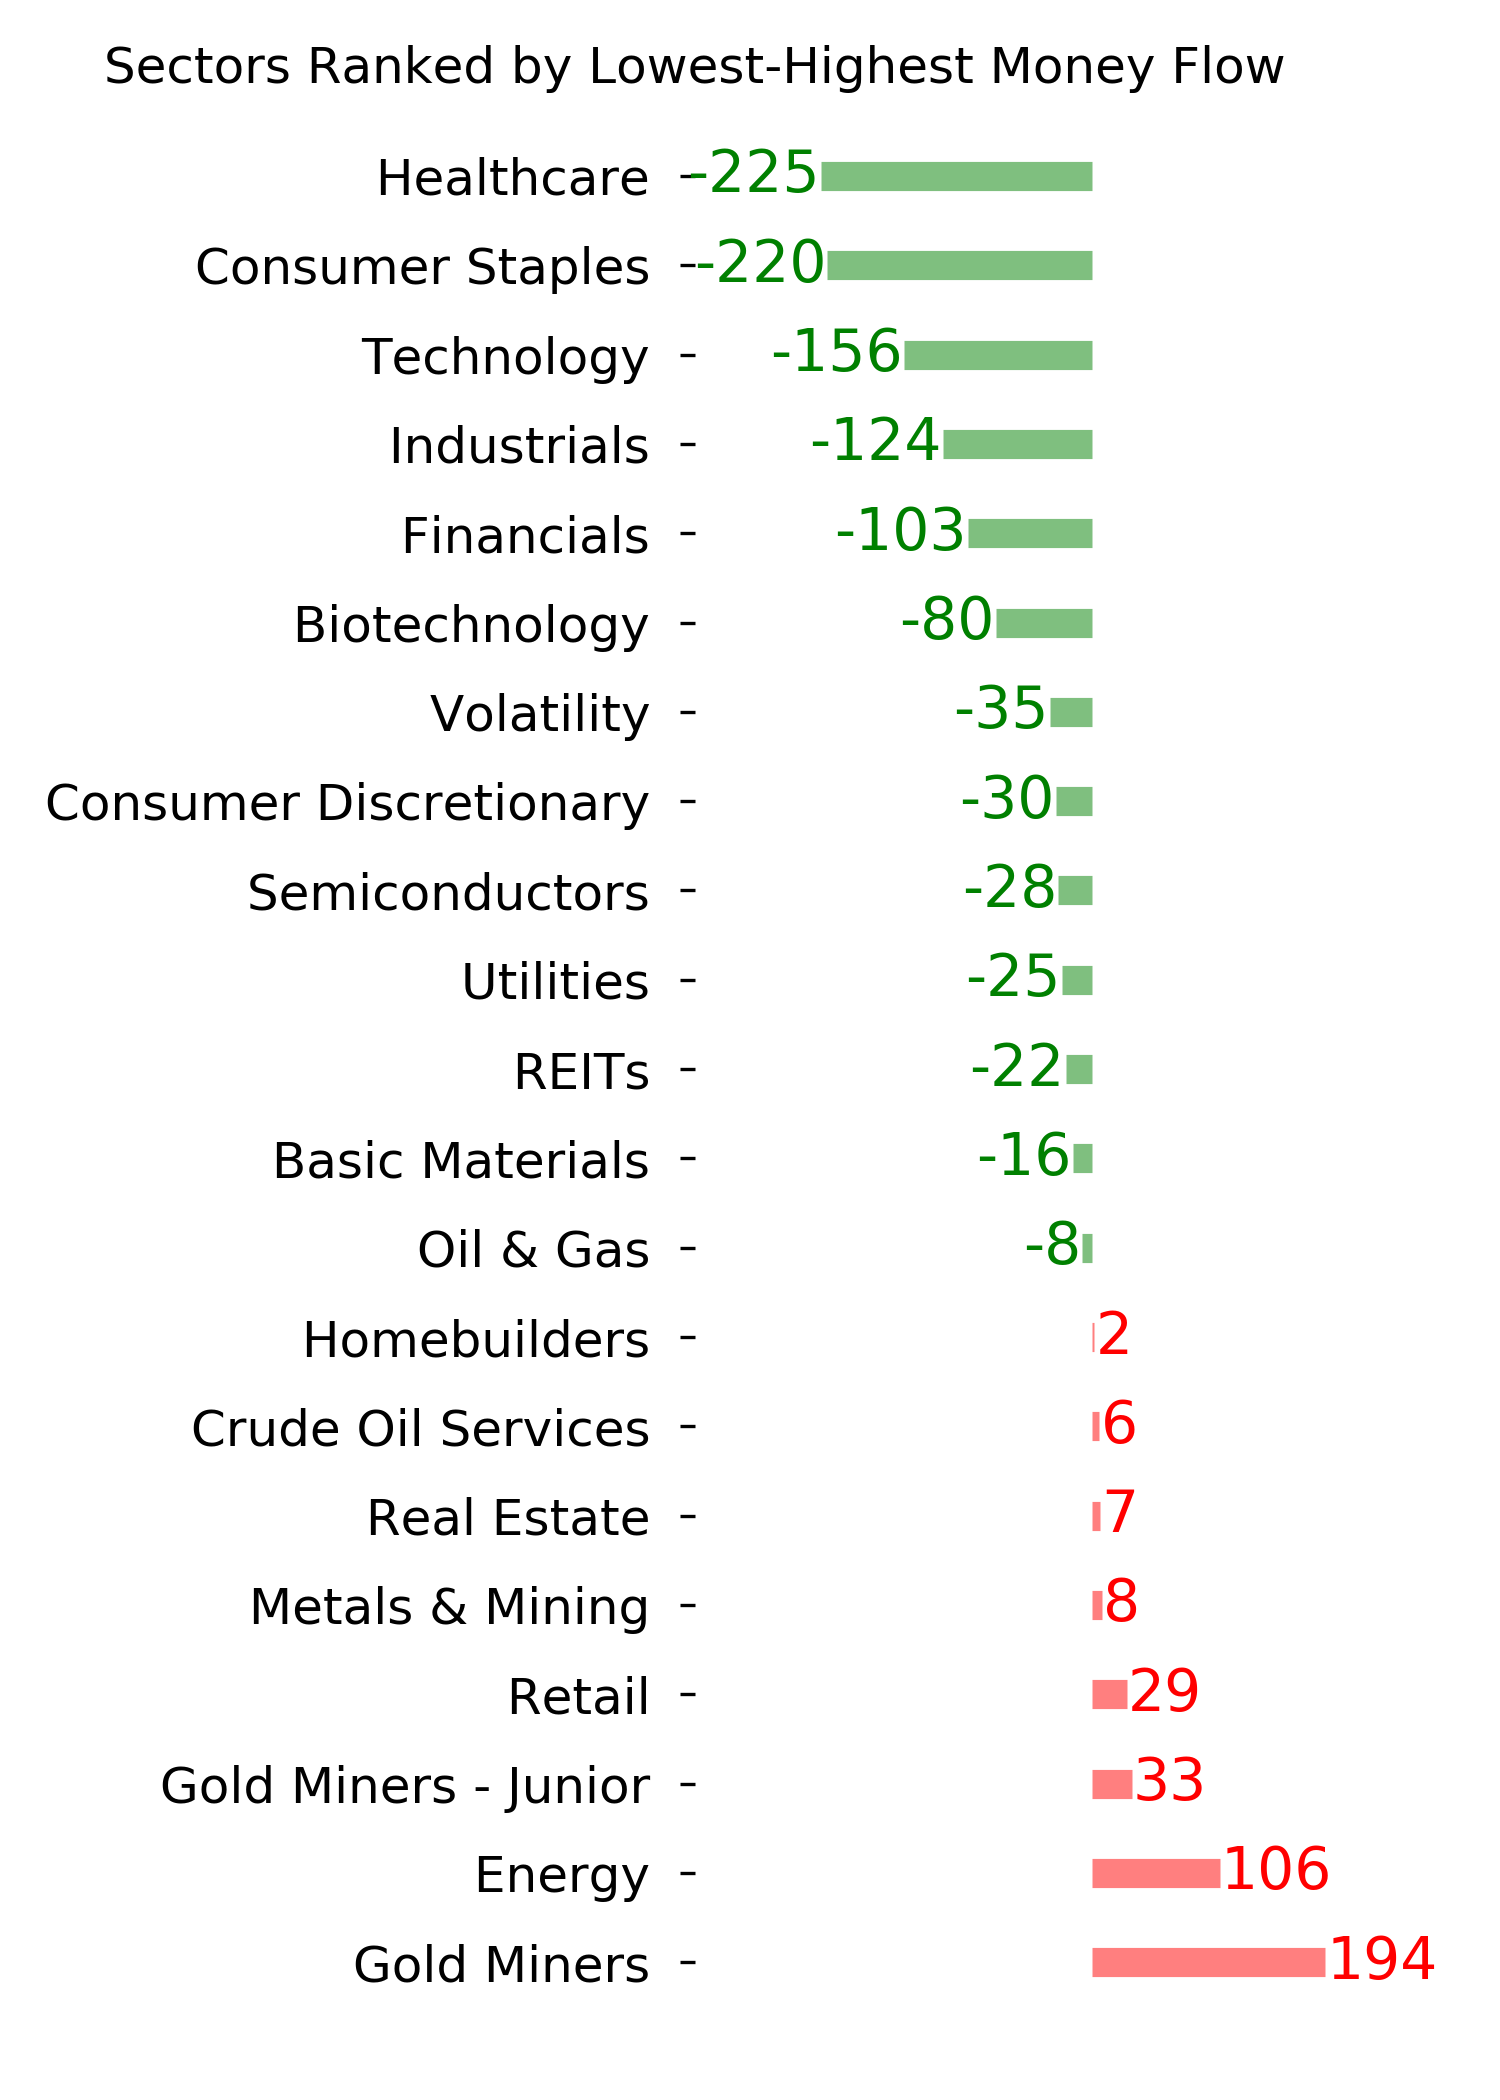
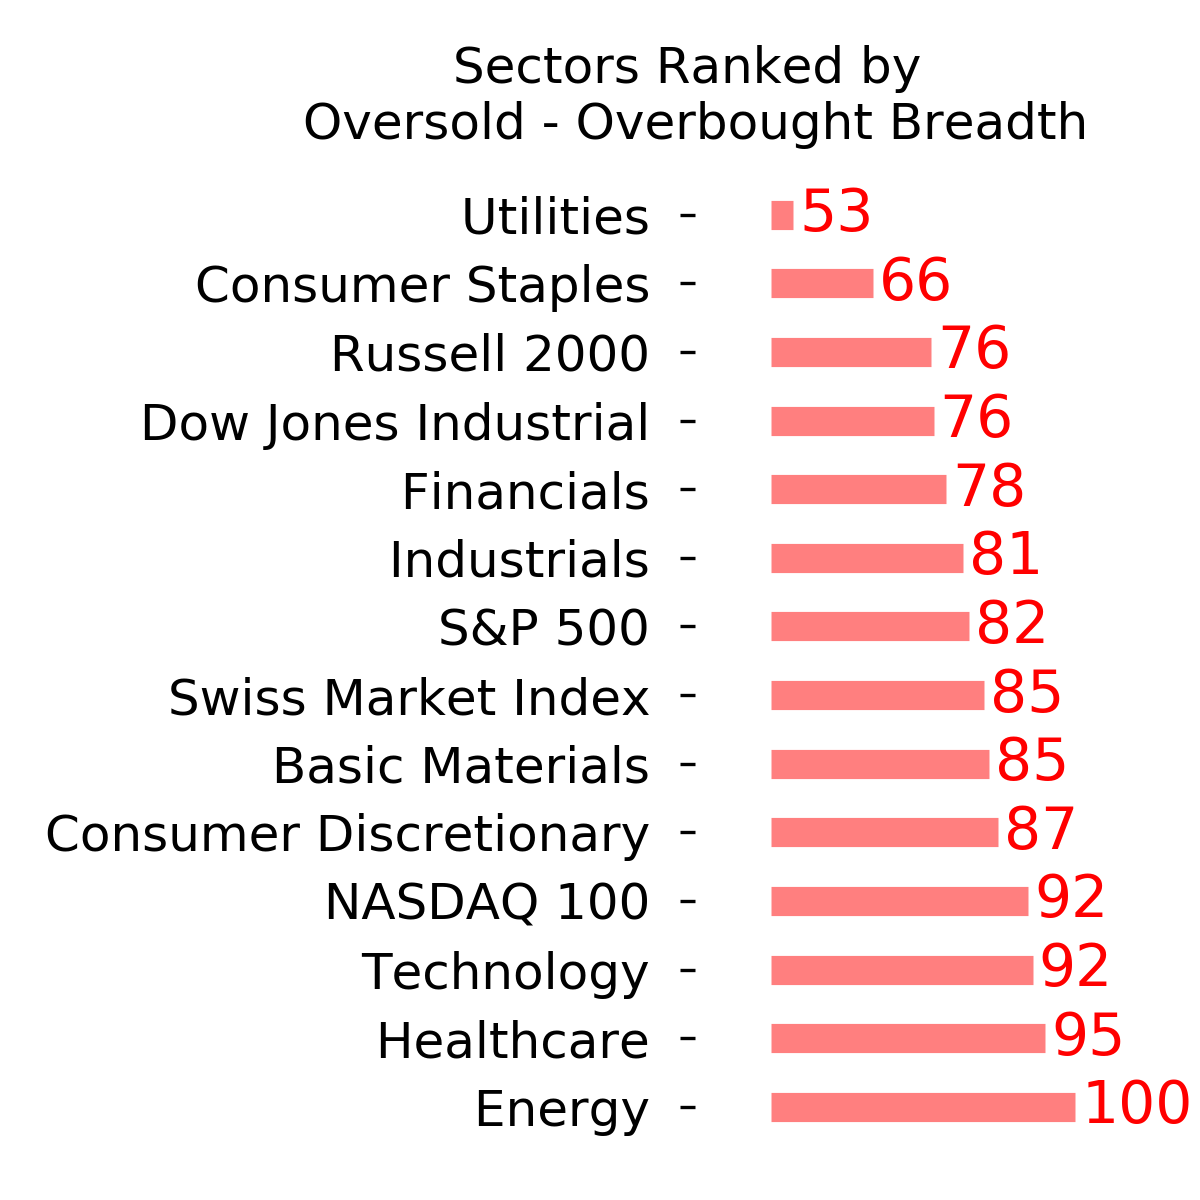
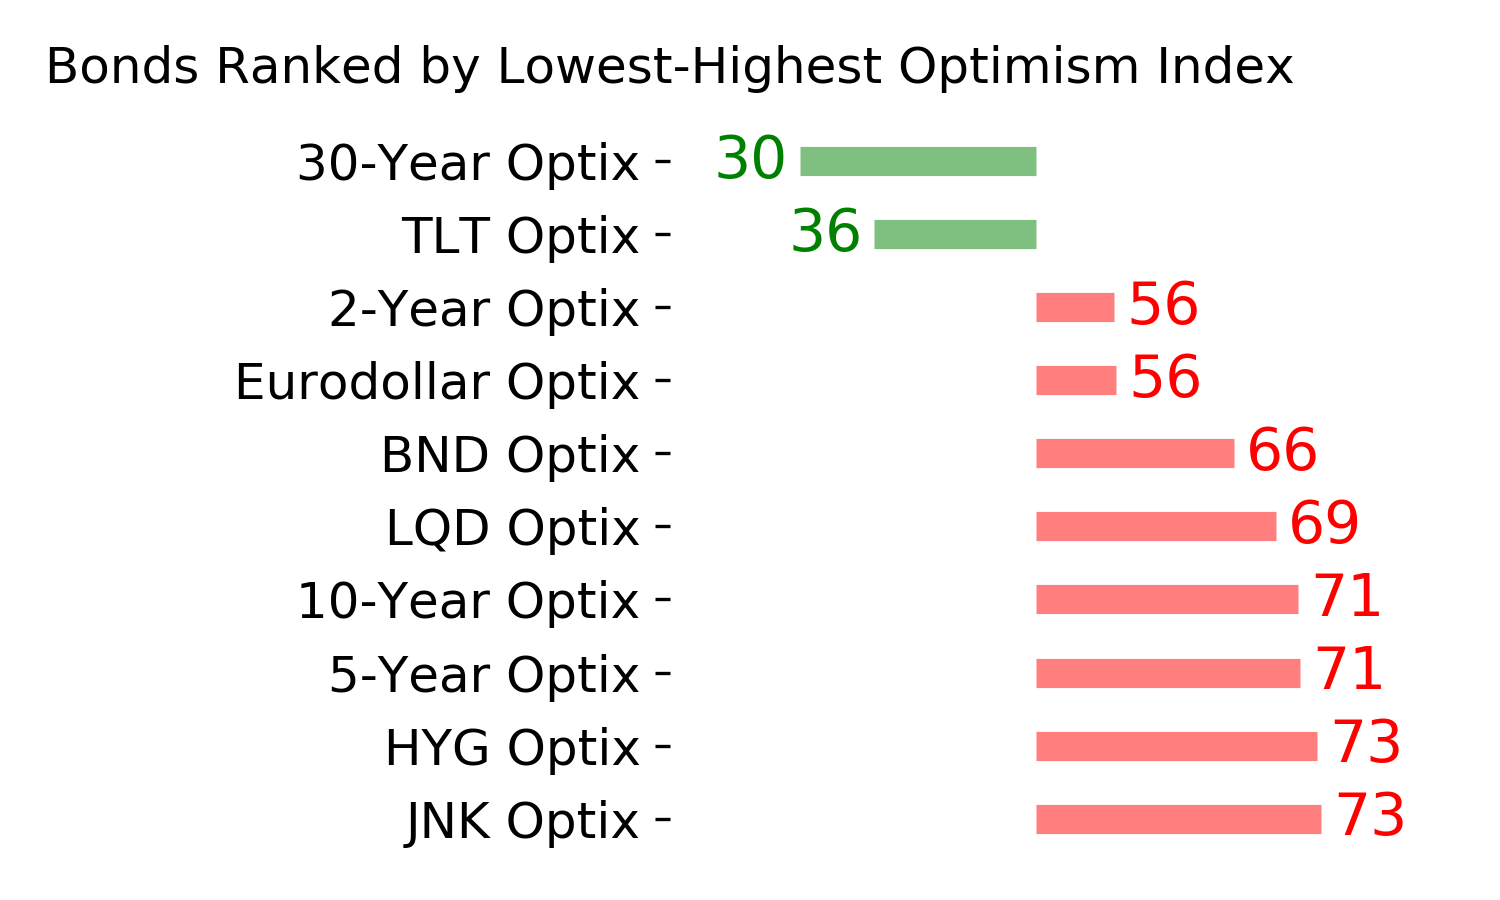
Ranks
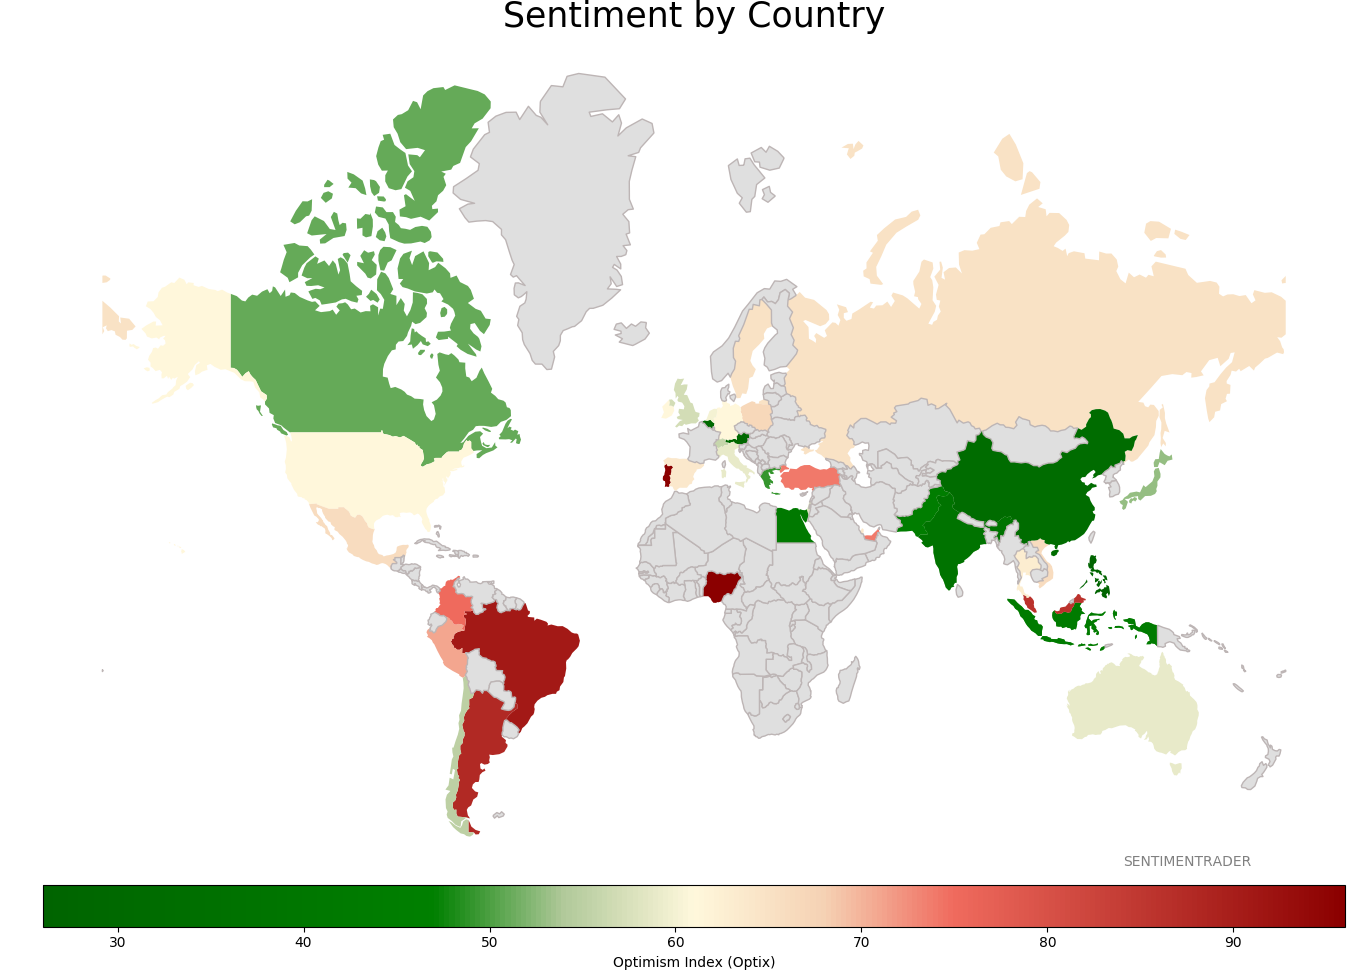
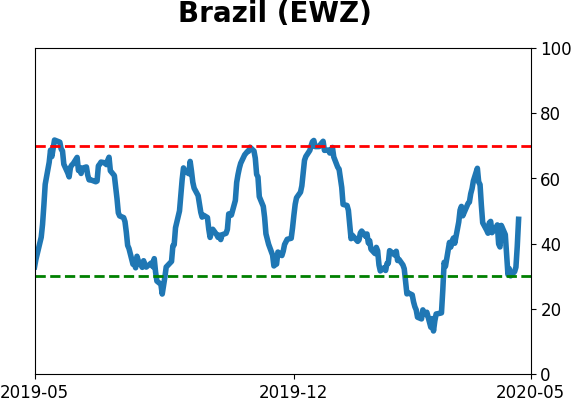
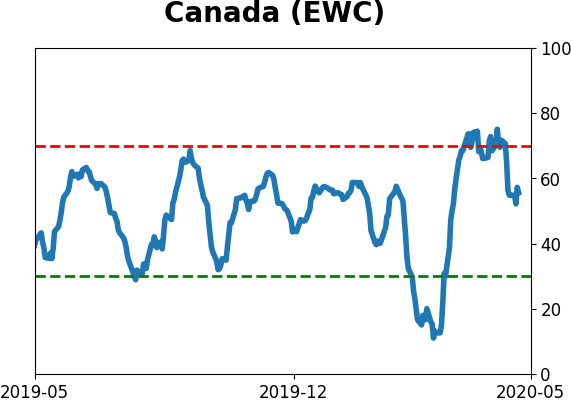
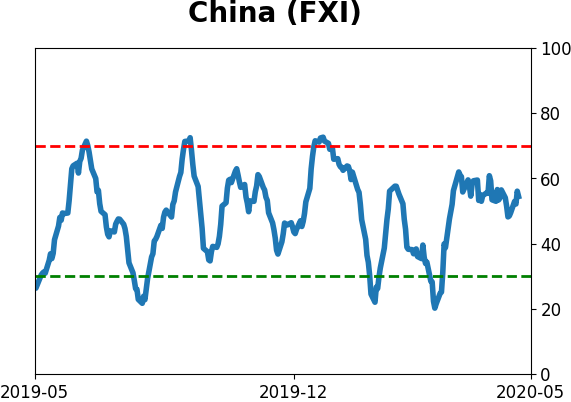
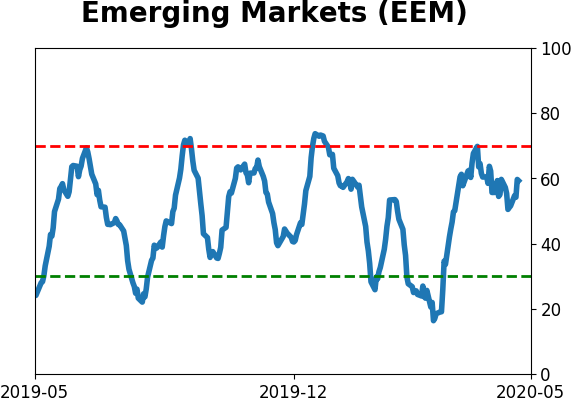
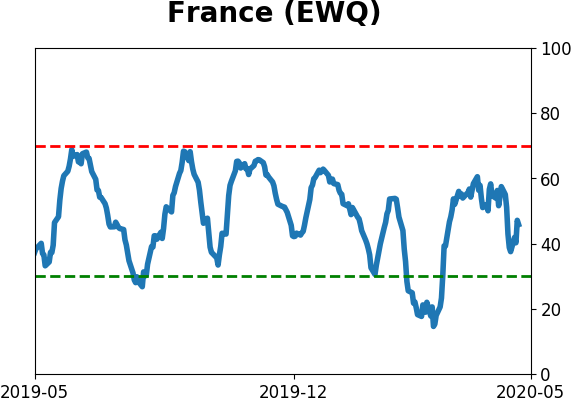
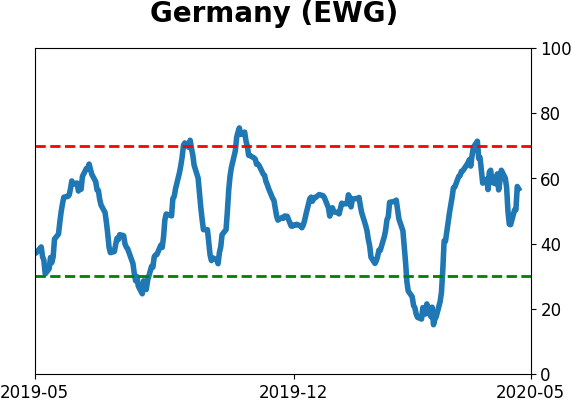
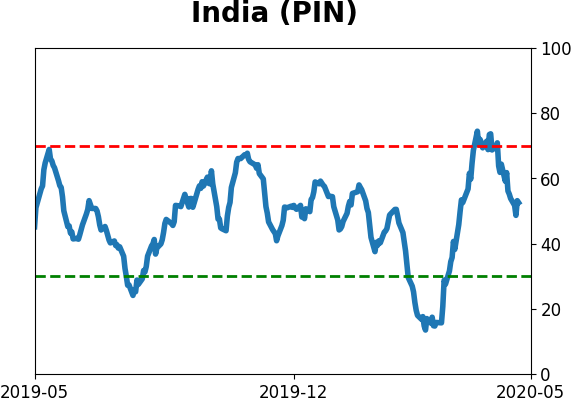
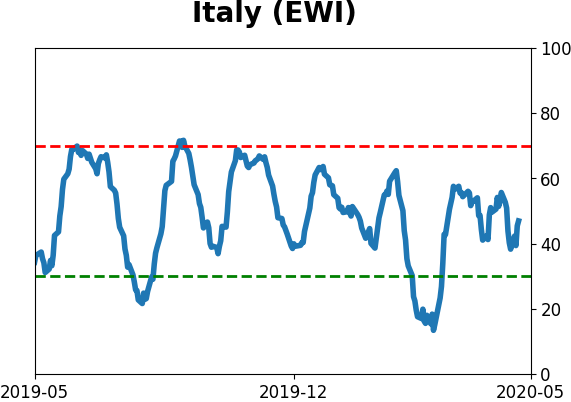
Sentiment Around The World
Optimism Index Thumbnails
|
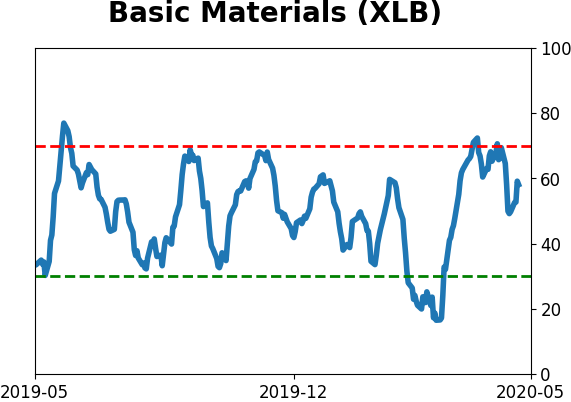
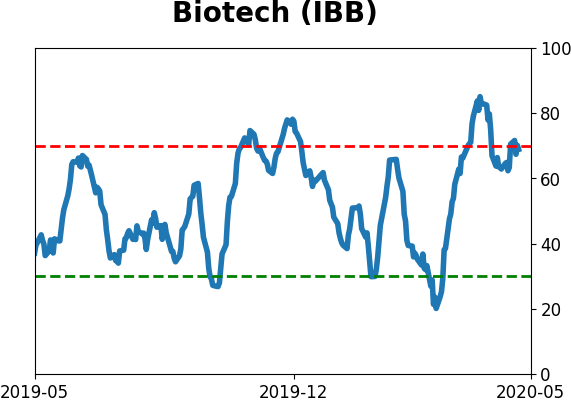
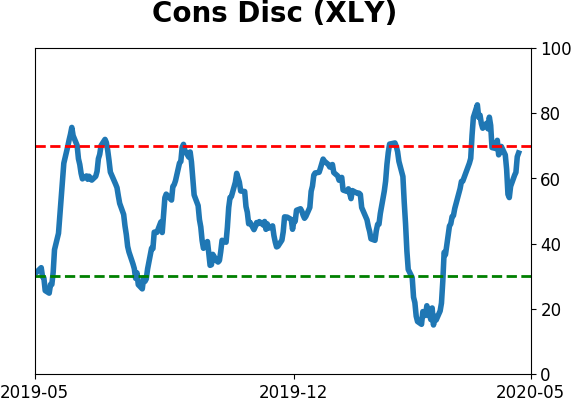
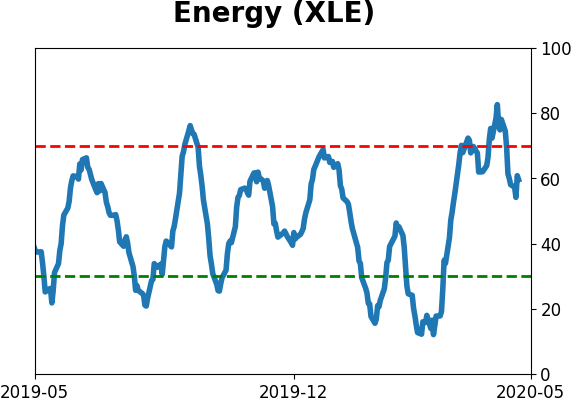
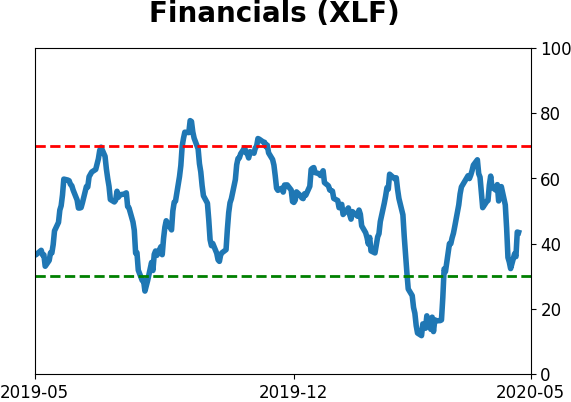
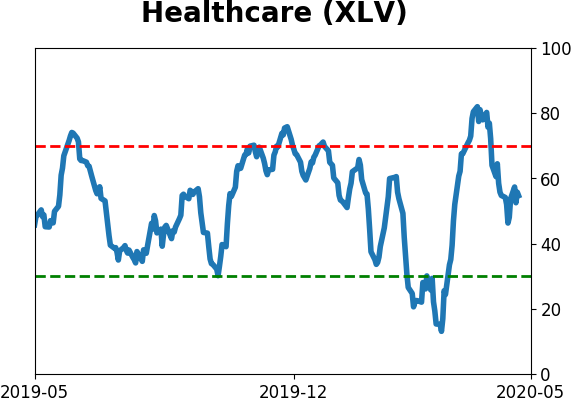
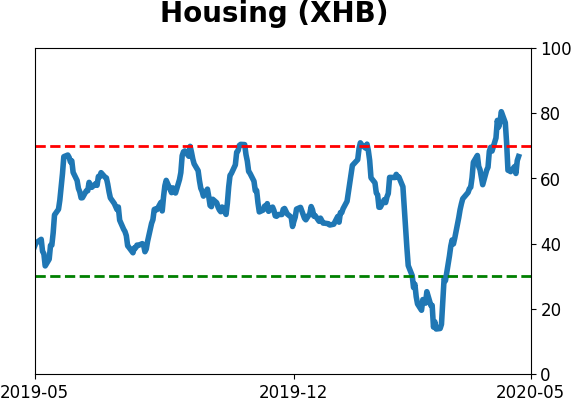
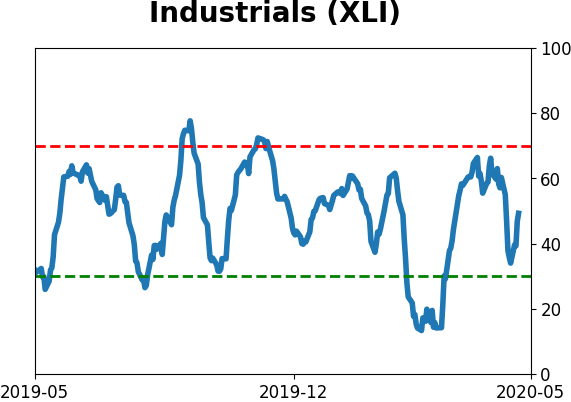
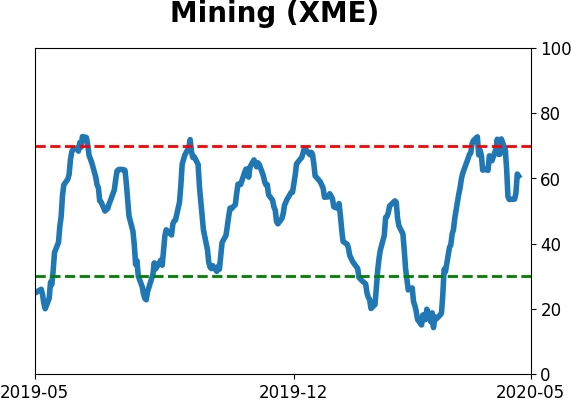
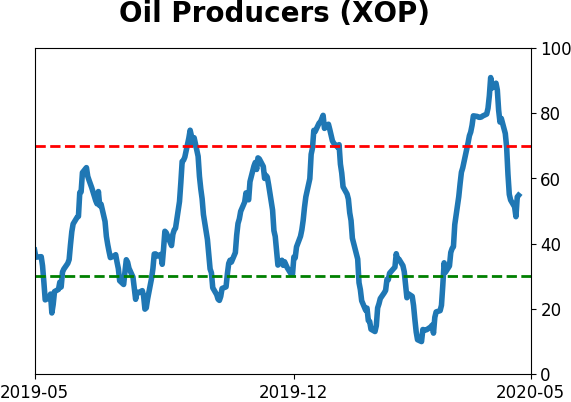
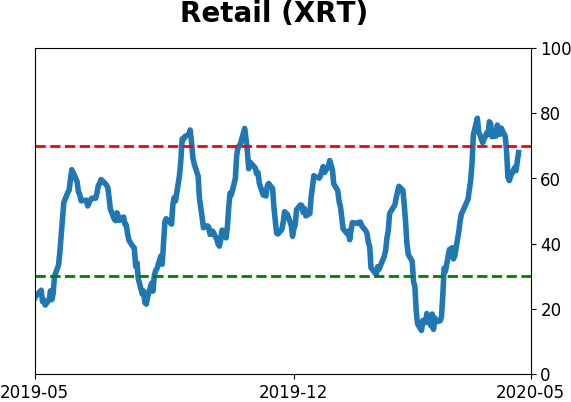
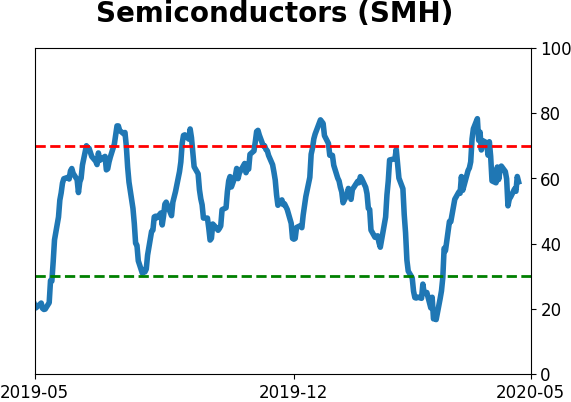
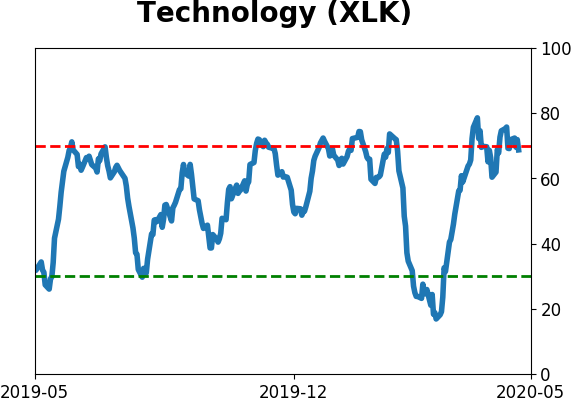
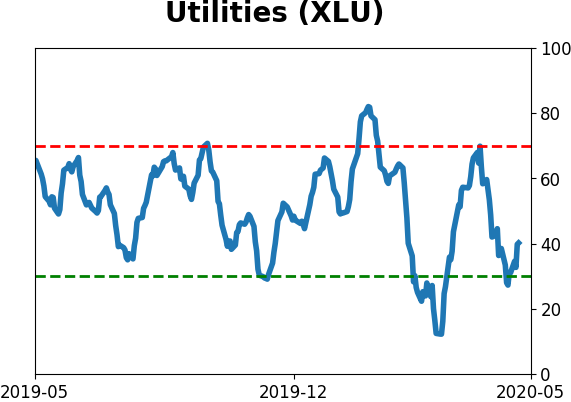
Sector ETF's - 10-Day Moving Average
|
|
|
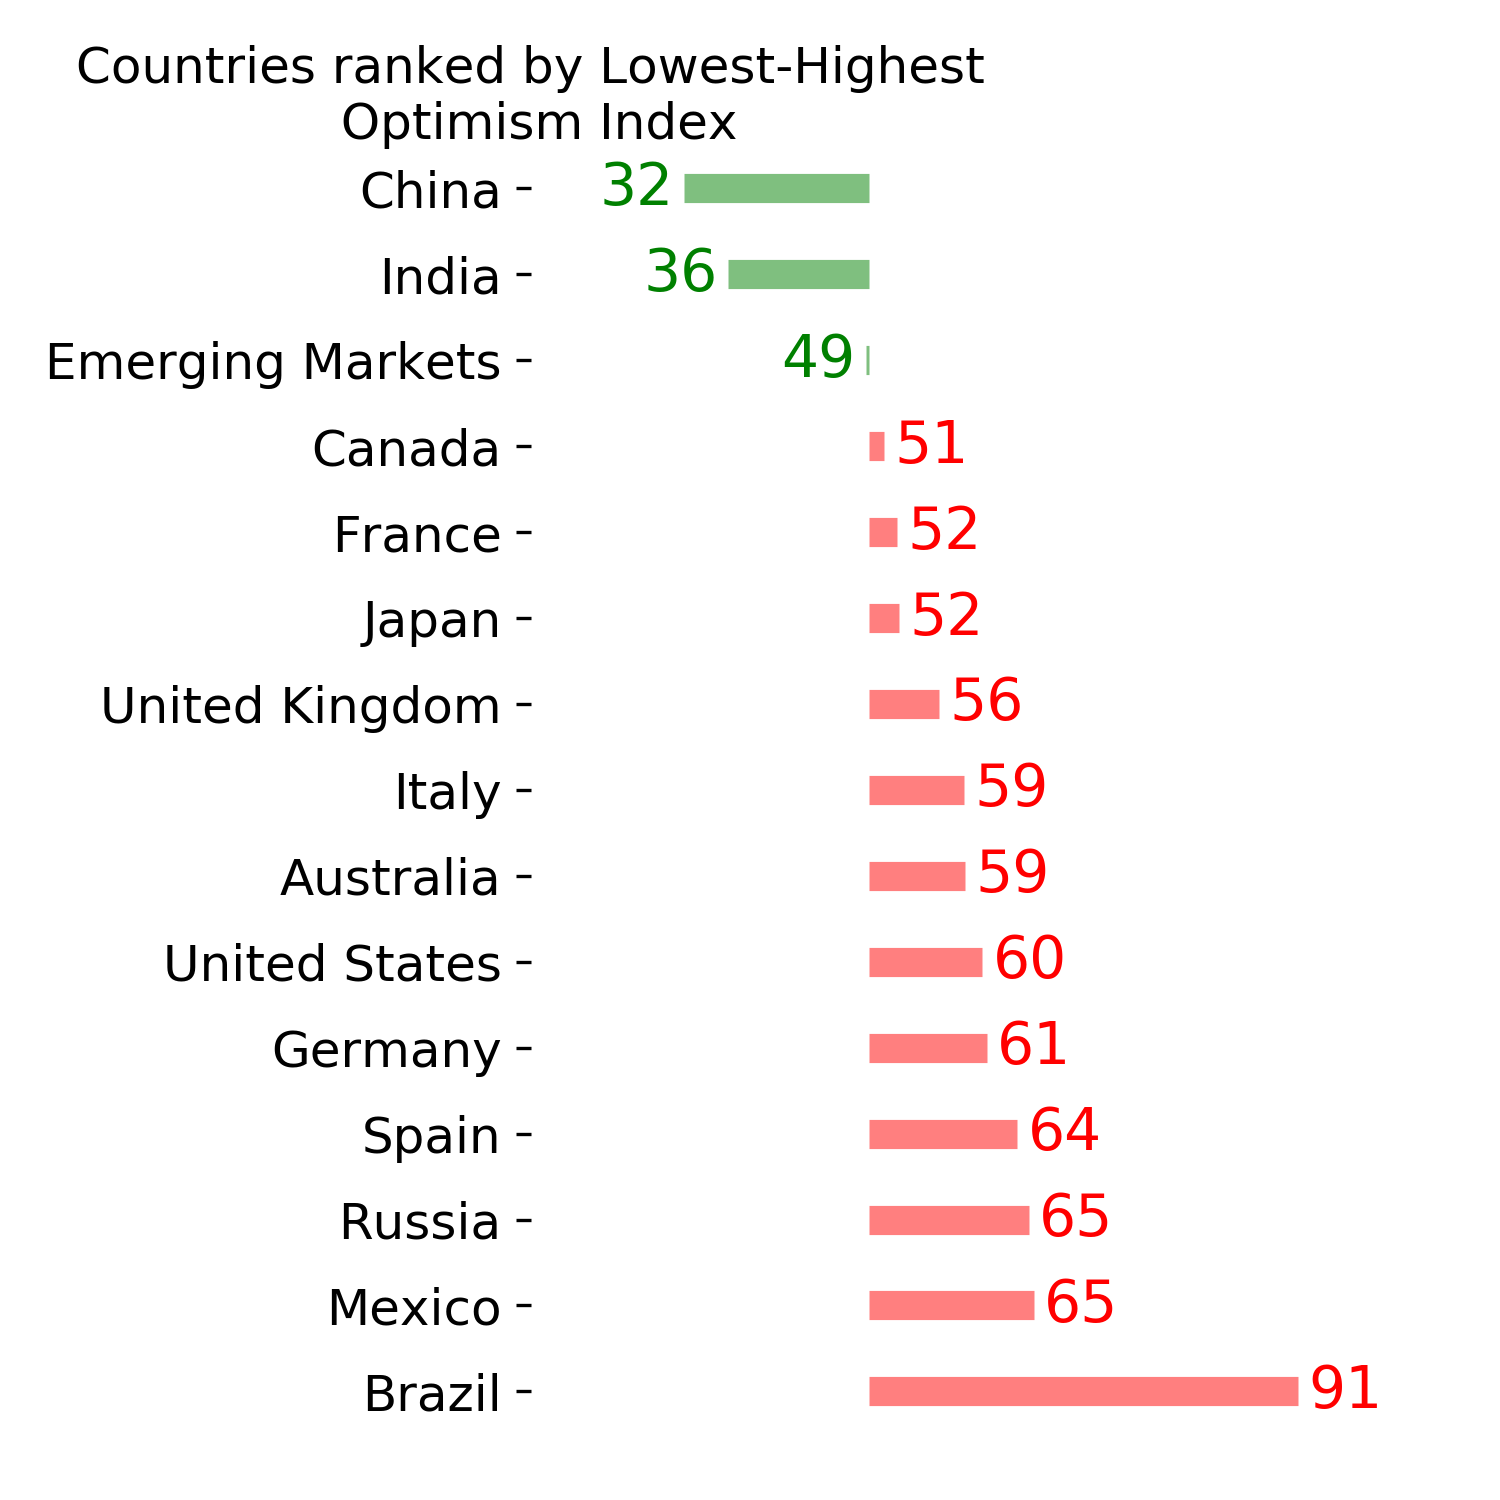
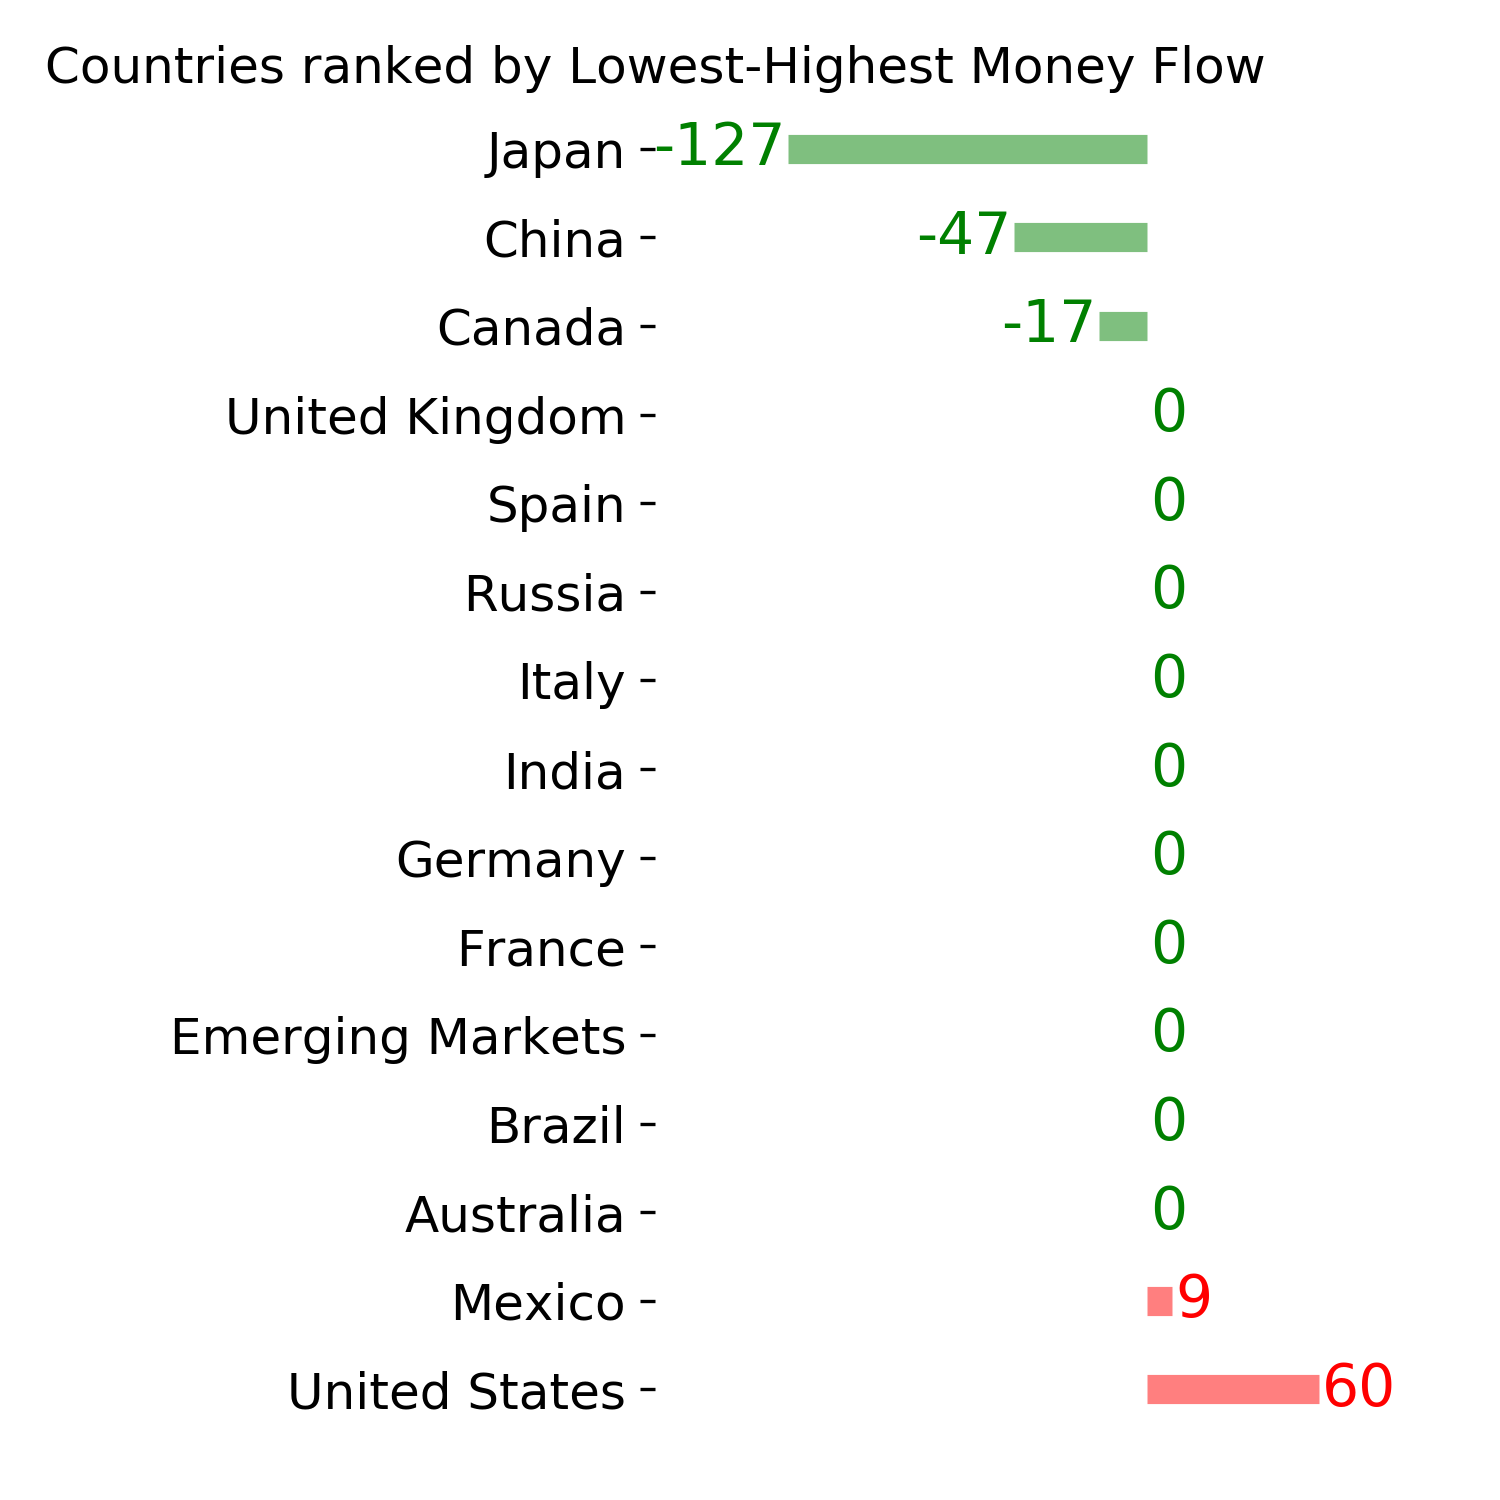
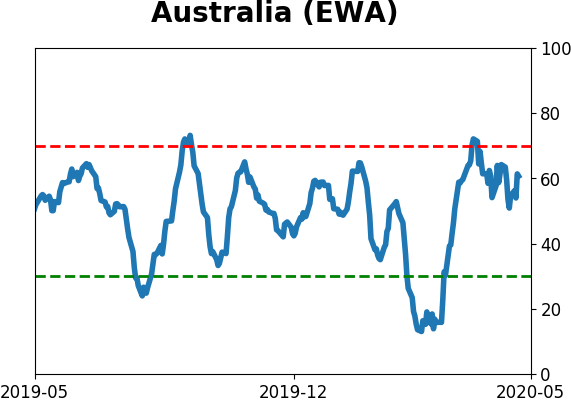
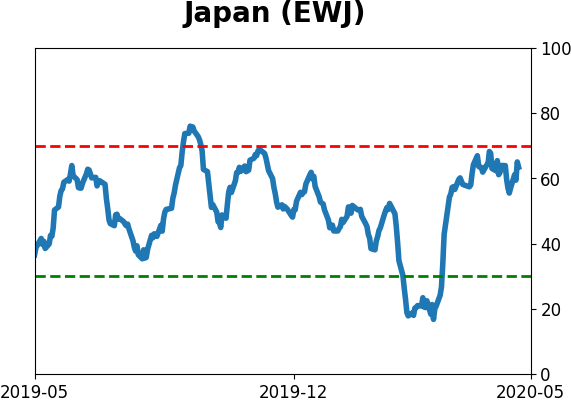
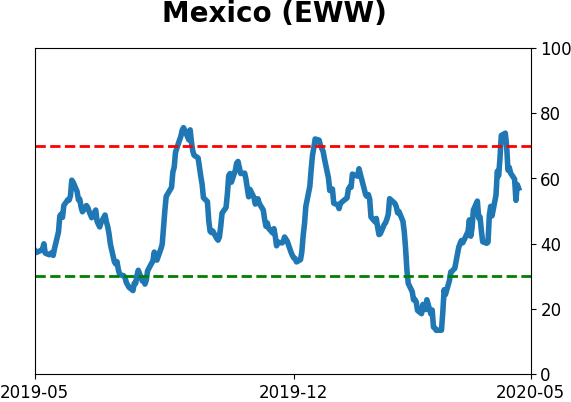
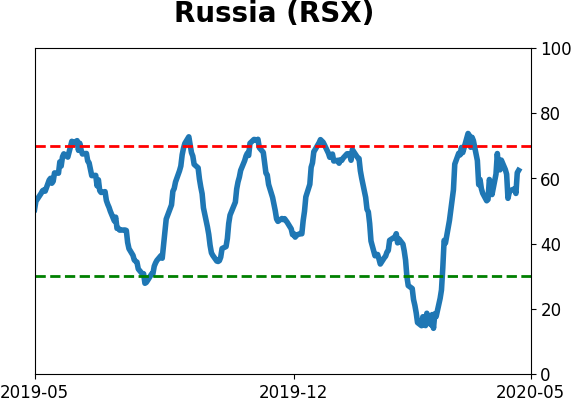
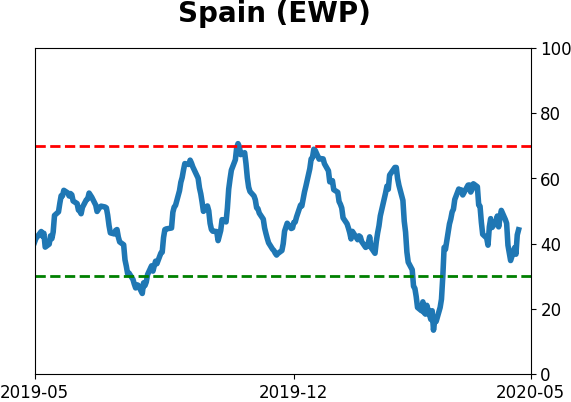
Country ETF's - 10-Day Moving Average
|
|
|
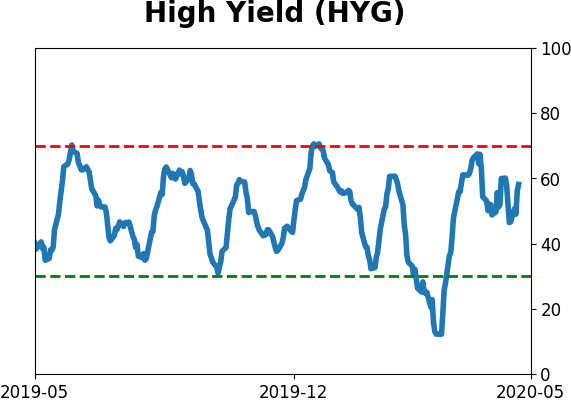
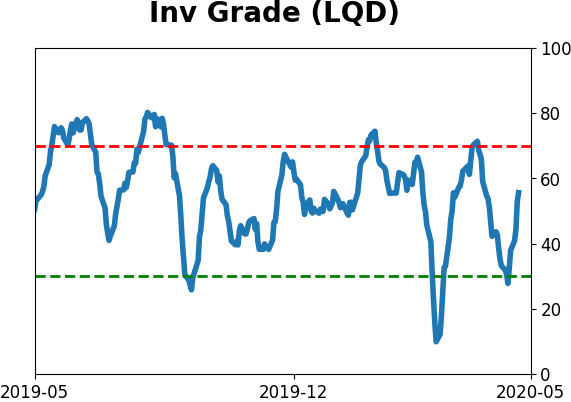
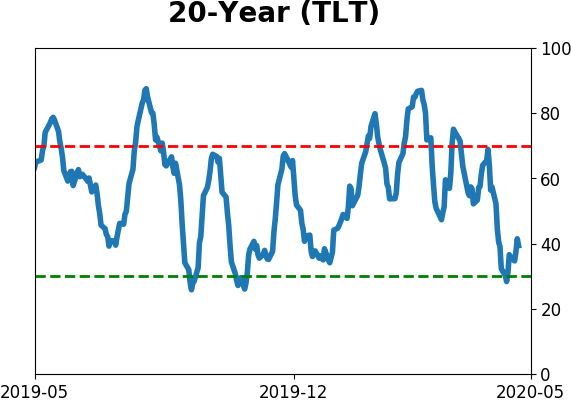
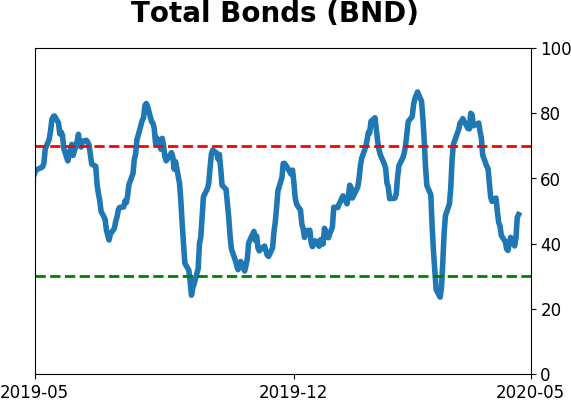
Bond ETF's - 10-Day Moving Average
|
|
|
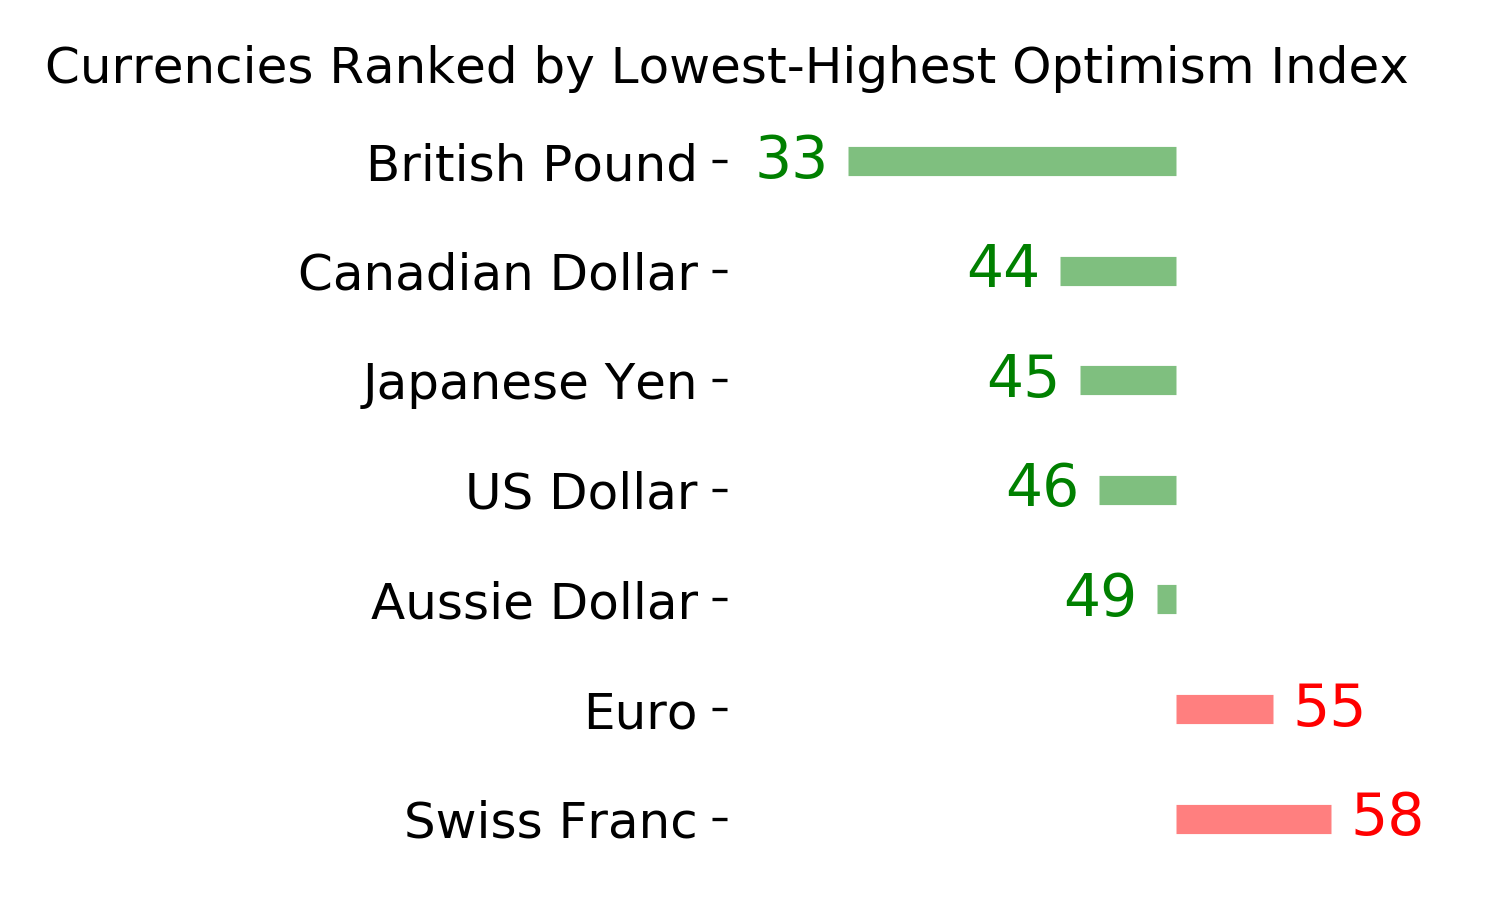
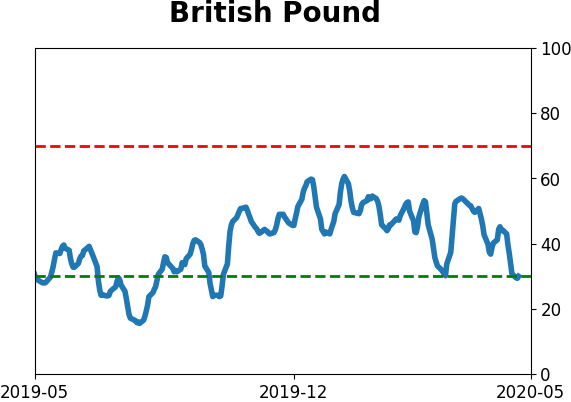
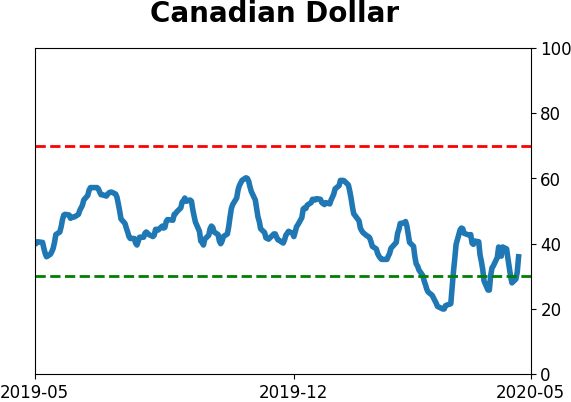
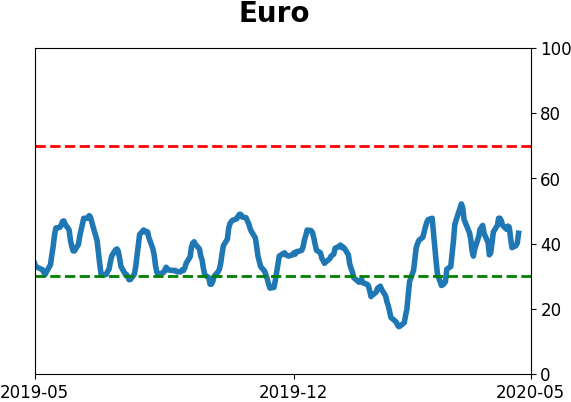
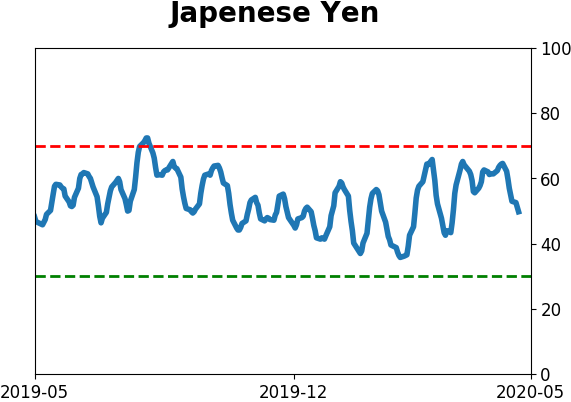
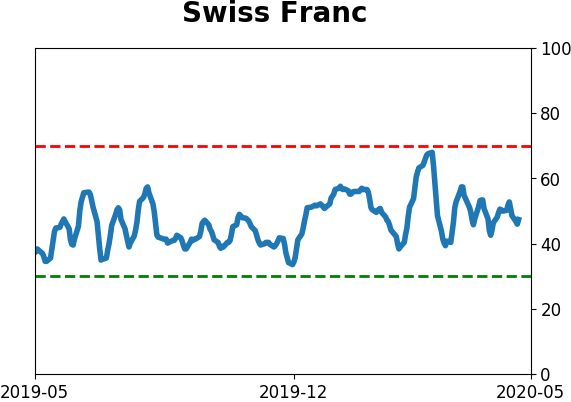
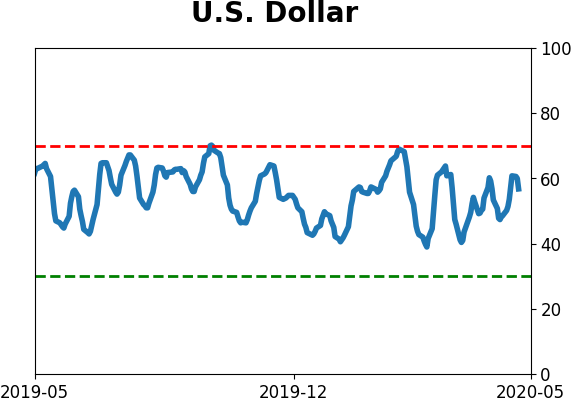
Currency ETF's - 5-Day Moving Average
|
|
|
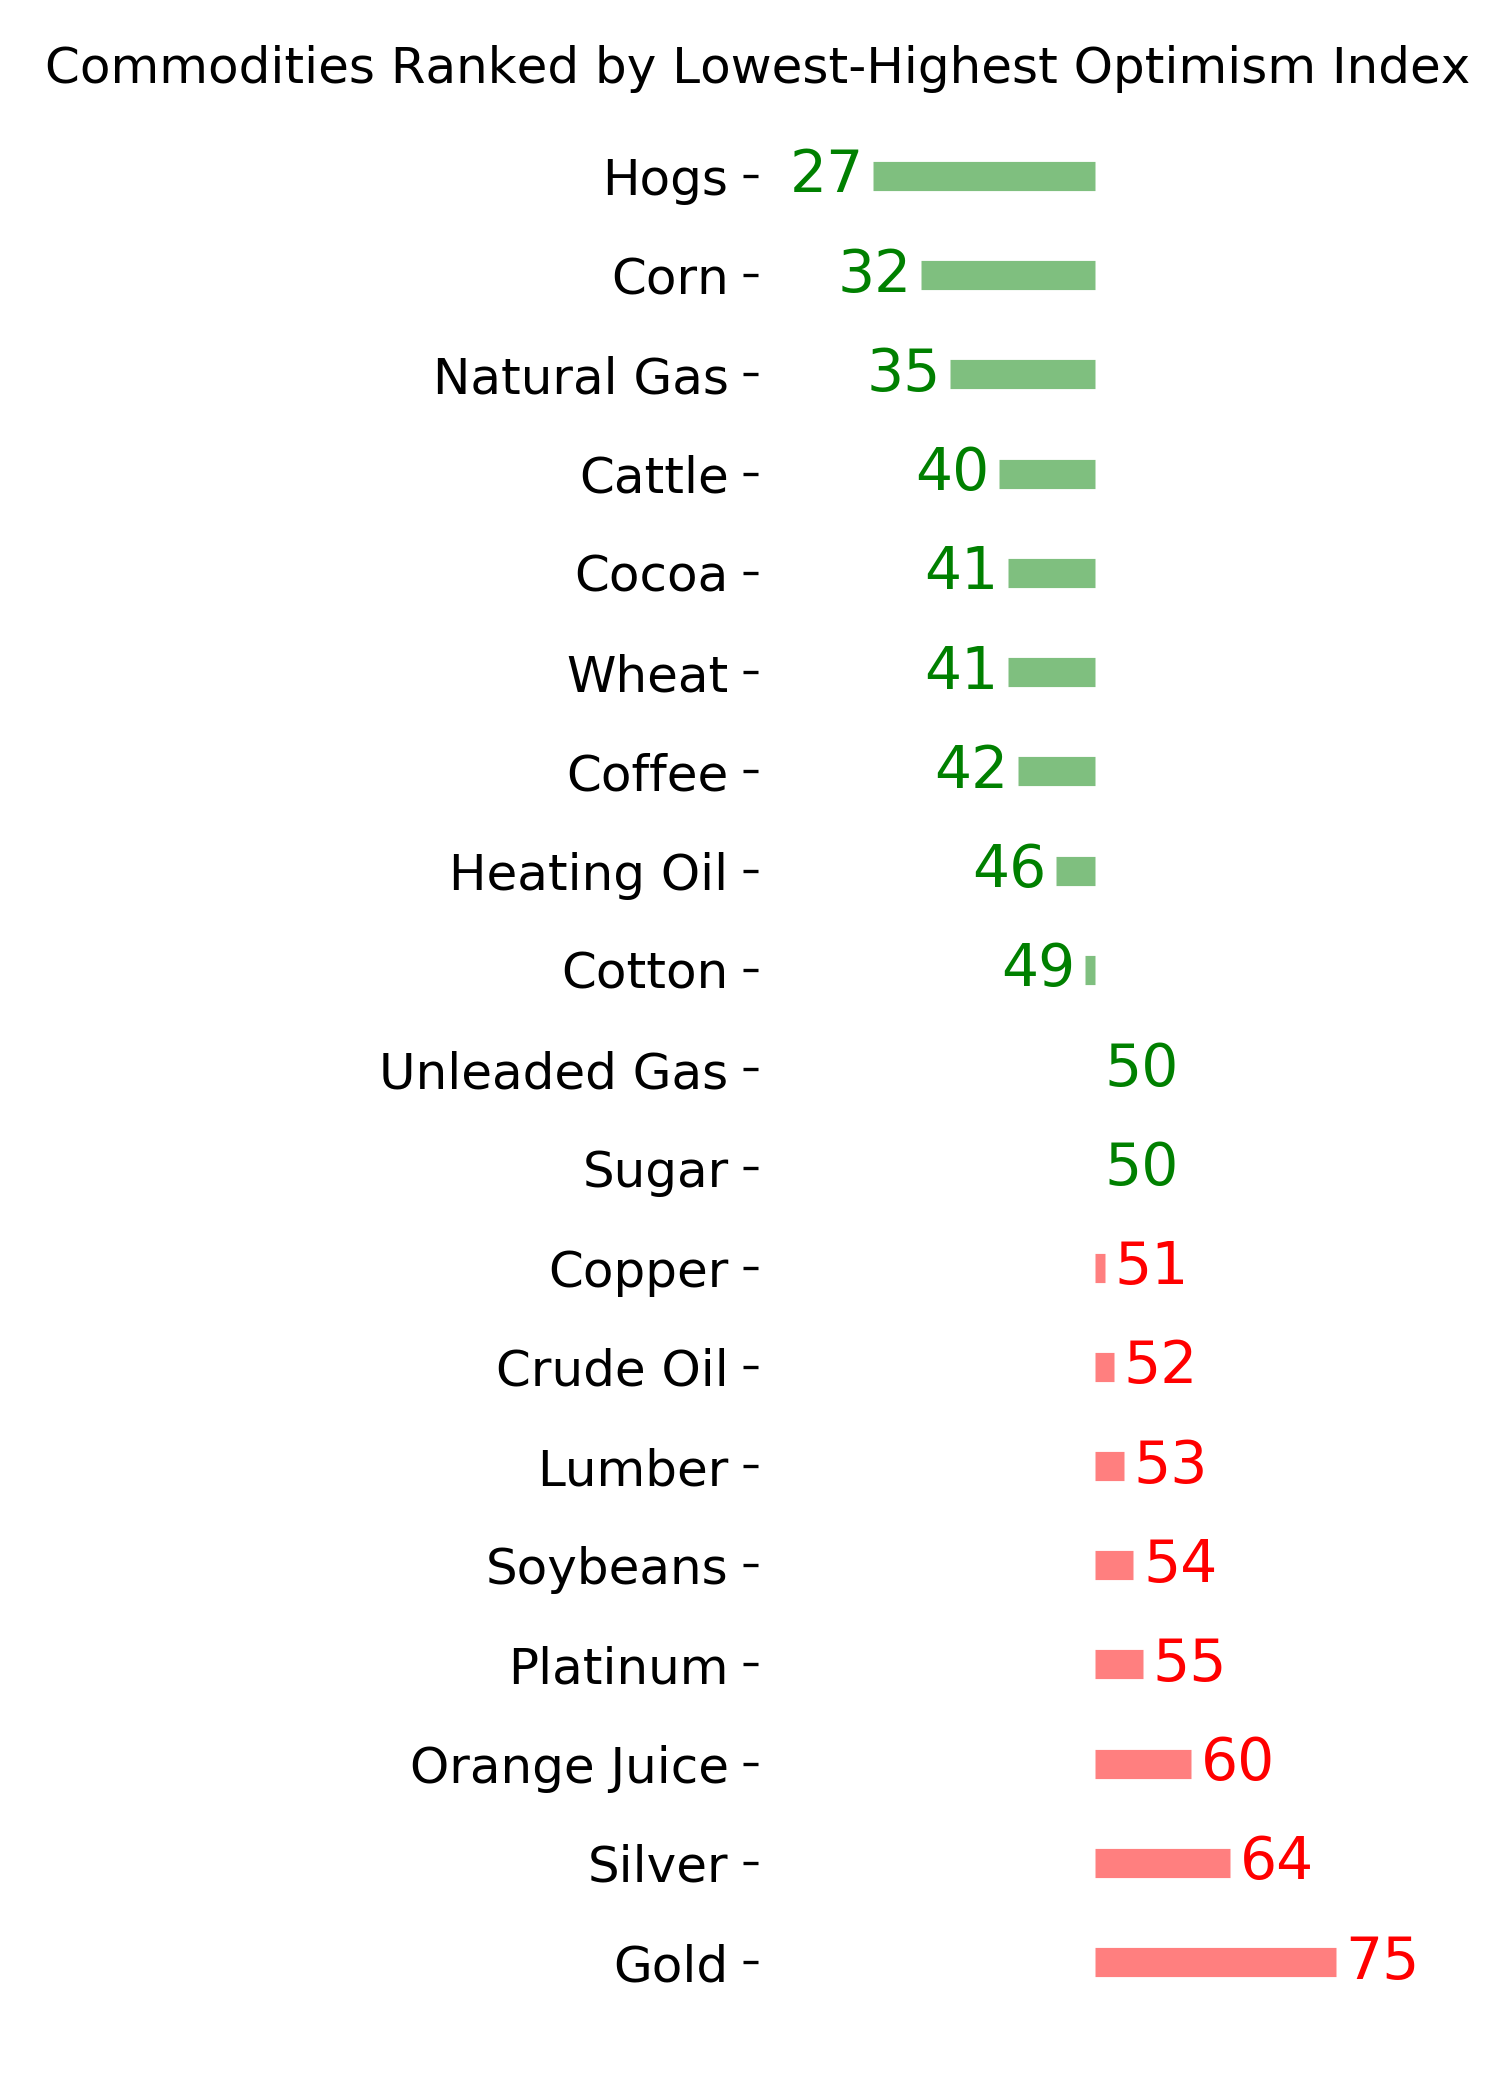
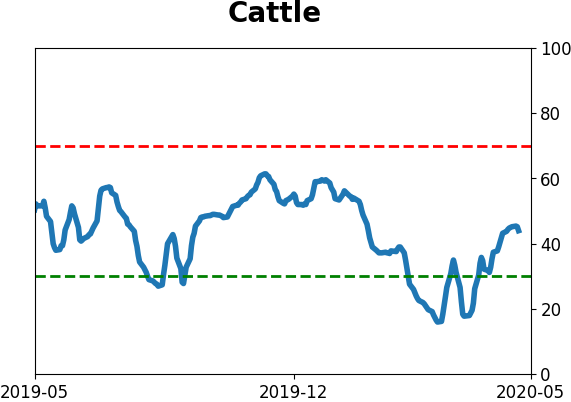
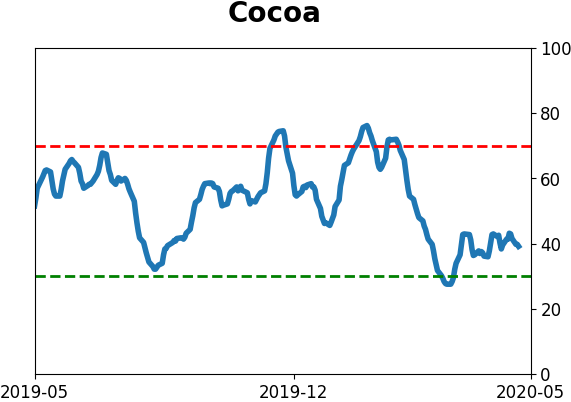
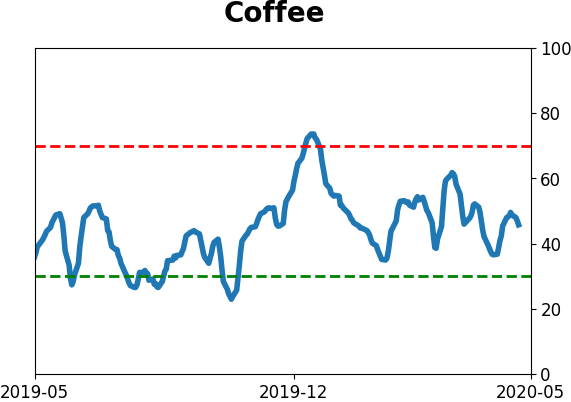
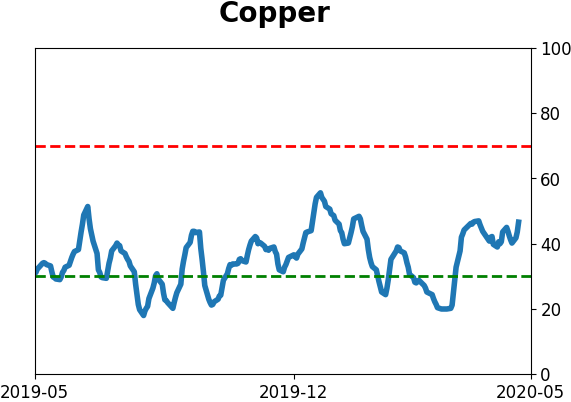
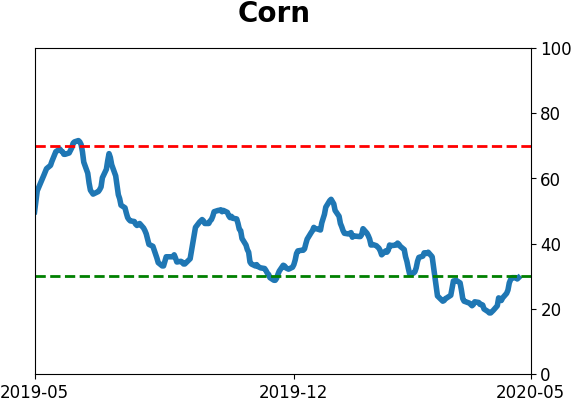
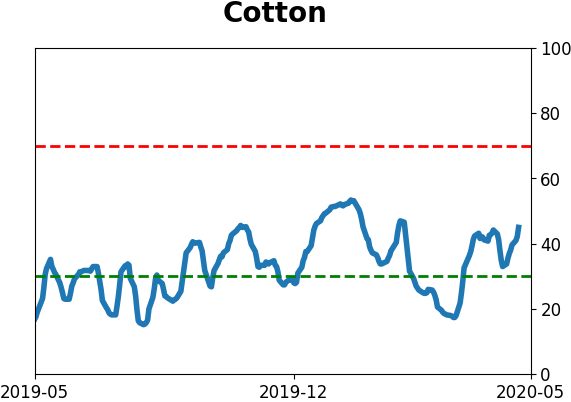
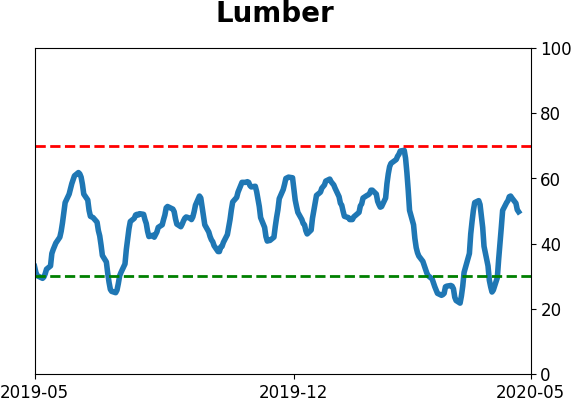
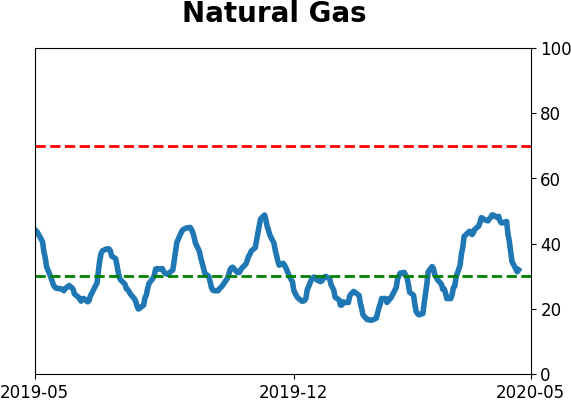
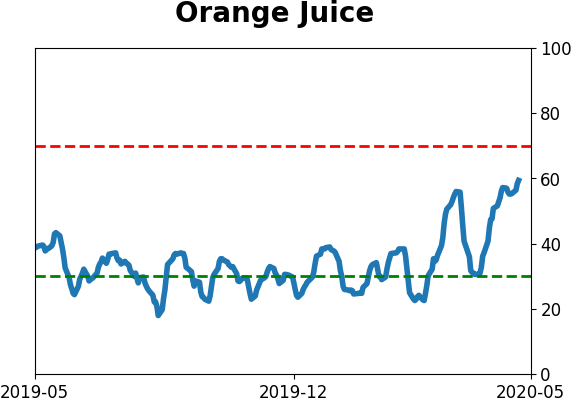
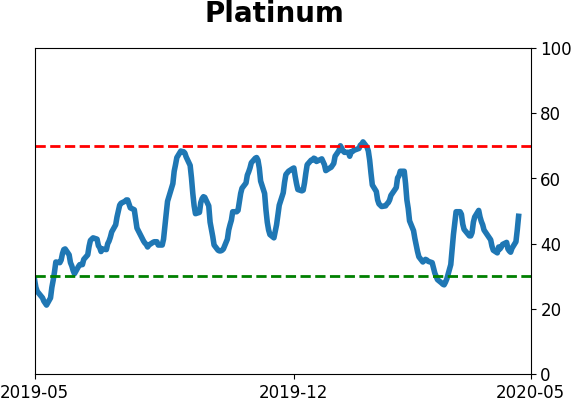
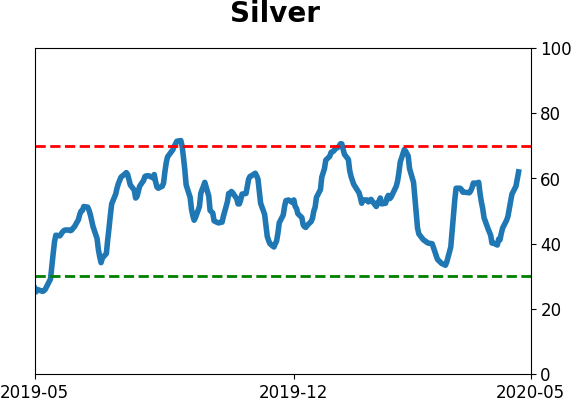
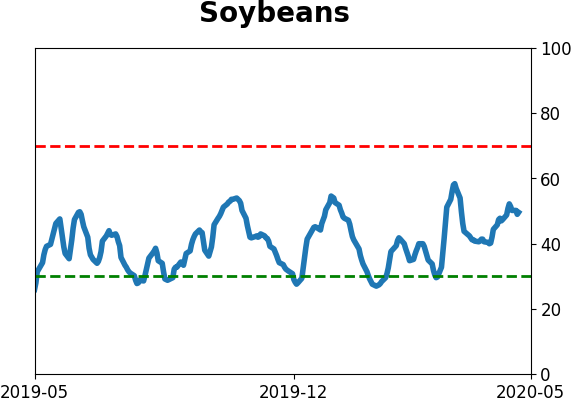
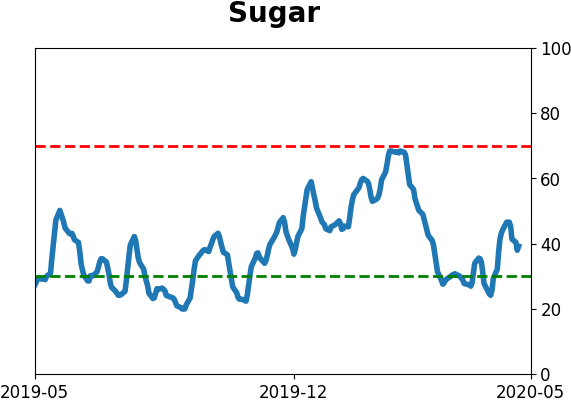
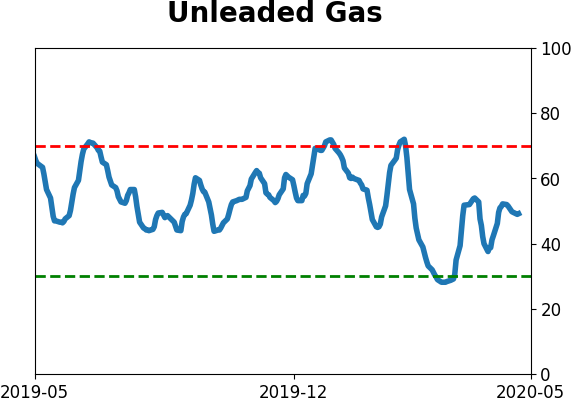
Commodity ETF's - 5-Day Moving Average
|
|