
It's the retracement that counts

One of the most popular knocks about the rally over the past couple of weeks is that it's "Just another bear market rally." There was an avalanche of notes about how the biggest rallies occur in bear markets. That's a given because volatility is higher during downtrends.
But since late March, we've touched a couple of times on the idea that this time is different. It wasn't just a 20% rally (or whatever), because that's not what matters. What matters is how much of the decline is made up during the rally.
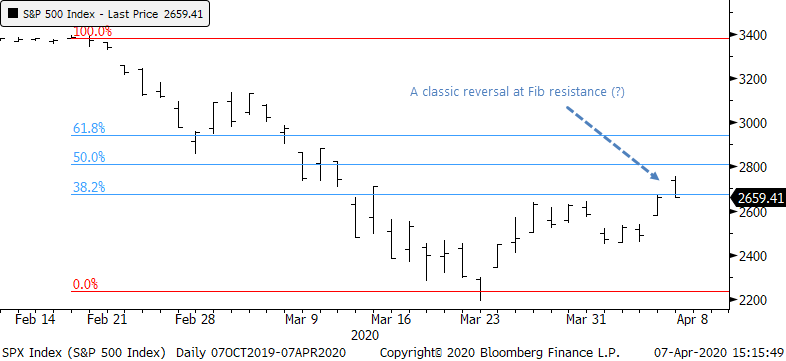
And this has been the most impressive recovery in history, even after Tuesday's intraday reversal. Classic technicians will be all over the idea that stocks suffered an intraday reversal at the "classic" 38.2% Fibonacci resistance level.
While it's common knowledge that stocks enjoyed multiple large rallies during prior bear markets, at no point during the rallies in the 1930s or 2008 did stocks manage to claw back as much of the losses as quickly as they've done this time. That's the kind of thing that can really help sentiment - if stocks rally 20% but that only claws back 20% of the drop, then it's not going to have much of an impact.
The S&P 500 bottomed 11 days ago. In that short span, it's retraced nearly 37% of its decline. Below, we can see every date since 1928 when the S&P fell to at least a 52-week low, then retraced at least a third of its decline after 11 days.
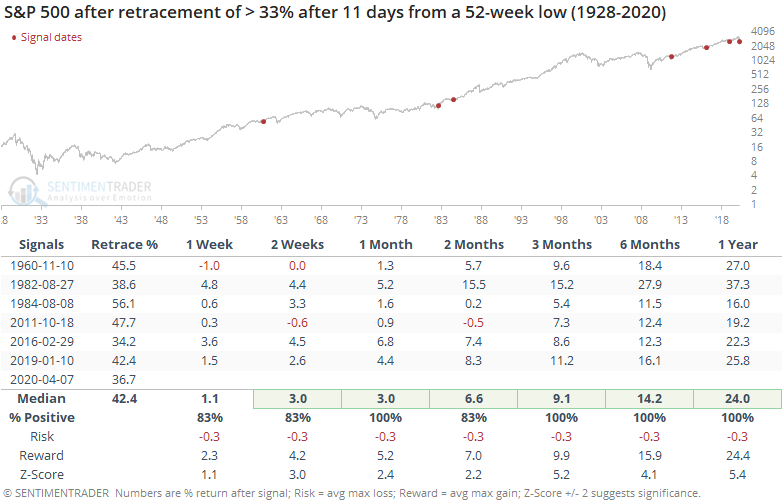
The impressive thing about this table is that none of them proved to be "Just a bear market rally." Compare that to times when stocks rallied for 11 days, sometimes for large gains, but didn't manage to retrace even 10% of the decline.
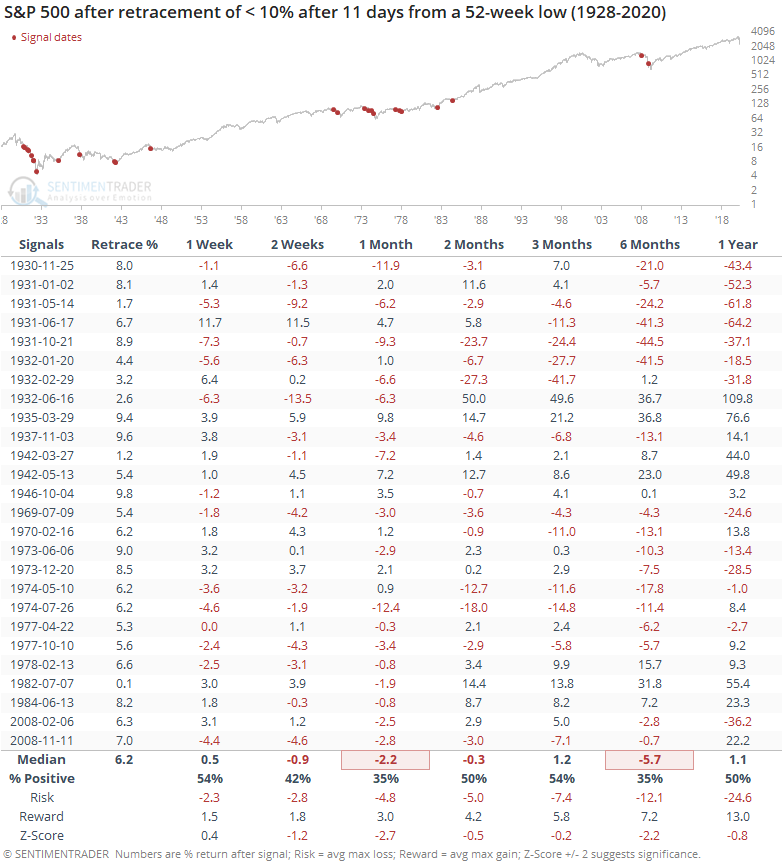
Some of these ended up being true bottoms, but most of the time, they ended up leading to lower lows. This is further confirmation of the idea that it's the retracement of a decline that can shift sentiment in a sustainable way, not just big gains.
Before the intraday reversal on Tuesday, the S&P was on track for an even more impressive retracement, obviously.
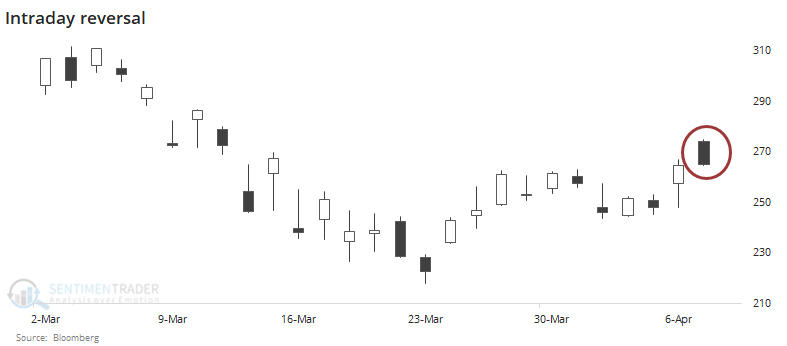
That selling pressure looks nasty on a chart, but does it matter? Below, we can see every time in the history of SPY when it:
- Was trading below its 200-day average
- Gapped up at least 2% at the open
- Rallied to at least a 10-day high
- Reversed enough to close in the bottom 30% of its intraday range.
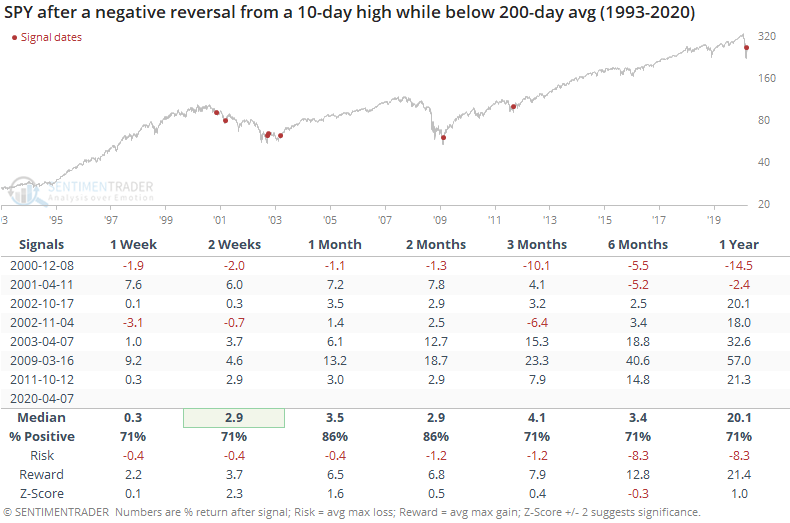
Like we see so often with chart patterns that look obvious, the actual outcome is a lot different than most expect. It seems like it should be a negative, but it has not been a reliable reason to sell.