
Backtest Engine Scans I Have Known and Loved - The-14-Day RSI Edition (Part II)

In Part I, we highlighted the tendency of the stock market to rally strongly after more than 60% of stocks in the S&P 1500 Index saw their 14-day RSI drop below 30%. This was a sign of a "washed out" market and overwhelmingly bearish sentiment.
This piece will explore the opposite end of the spectrum and highlight the little-understood fact that "overbought" can also, at times, be a bullish sign for the stock market.
MARKET THRUST
Just like it takes a great deal of thrust to launch a rocket ship off the ground, major bull markets also have a tendency to be accompanied by periods of great "thrust" - i.e., a large number of stocks acting bullish all at once.
Let's look at a simple way to use the % S&P 1500 RSI 14-day >70 indicator to identify these times of exceptional market thrust.
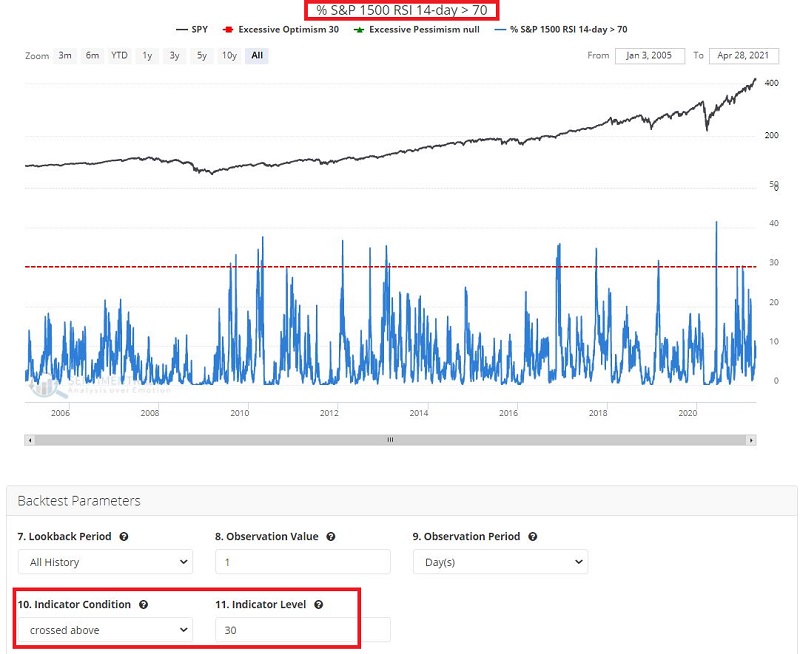
By clicking this link and then clicking "Run Backtest" you can run the following test:
- We look at % S&P 500 1500 RSI 14-day > 70
- We look for a value of 30 or higher
We are looking at 1,500 stocks, and we are identifying those times when at least 30% of those 1,500 stocks have a 14-day RSI reading of 70 or higher on the same day. In other words, a lot of stocks are powering sharply higher all at once.
- The bad news is that this signal does not happen very often AND that human nature causes many investors NOT to trust a strong short burst in the market - particularly after a long and/or sharp market decline. Instinctively they may see such a move as a "trap"
- The good news is that when it does, it strongly suggests that the stock market is about to continue powering higher
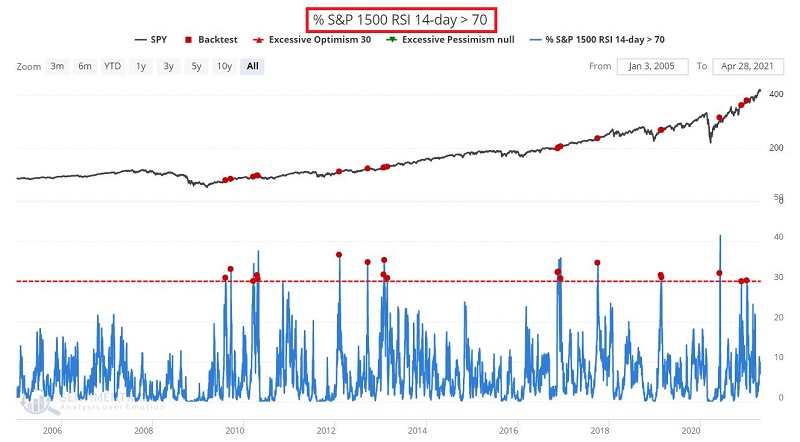
% S&P 500 RSI 14-day > 70 ABOVE 30
The chart below displays the signals.
The figure below displays a summary of results 1 week to 1 year after each signal. The results are quite bullish.
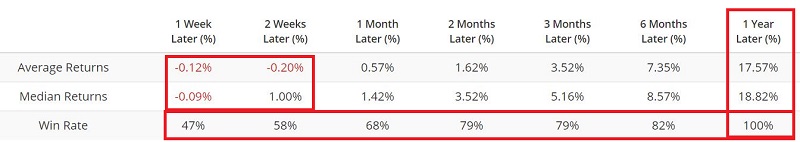
Note that:
- Performance was so-so in the 2 weeks after a signal, as the market often pauses briefly after a sharp advance (Warning: This can reinforce the idea in an investor's mind that the initial thrust was nothing more than a "trap")
- The Win Rate trends higher the more time that goes by
- The Average and Median returns trend higher the more time that goes by
- The 1-year Win Rate is 100%
- The 1-year Median return is a robust +18.82%
Like the scan highlighted in the previous article, this one is also worth adding to the archives. You can do this by:
- Clicking "Add to Favorites"
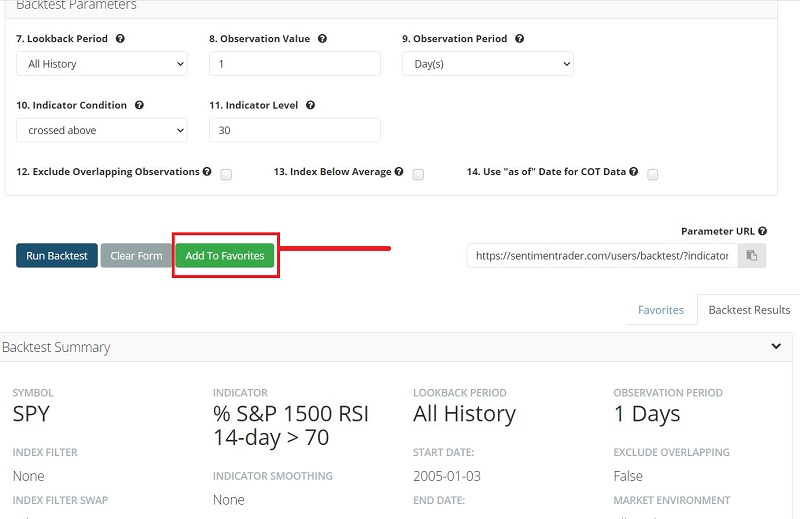
- Typing "% S&P 1500 RSI 14-day > 70 above 30"
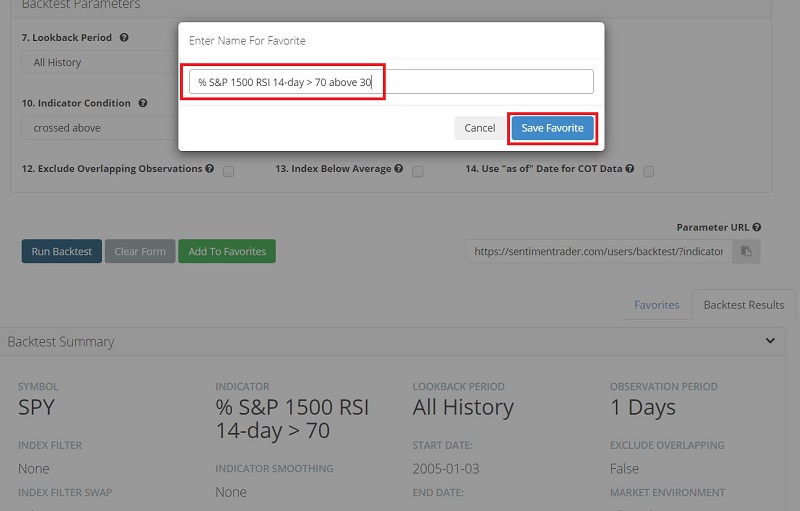
- Then click "Save Favorite"
These steps will add this particular scan to your list of Favorites. Anytime you enter Backtest Engine, it will list your Favorites at the bottom as per below. Any time one of your Favorite Backtests is triggered, it will also appear in the bottom section of the Evening Digest email that's sent out after the close of each trading day.
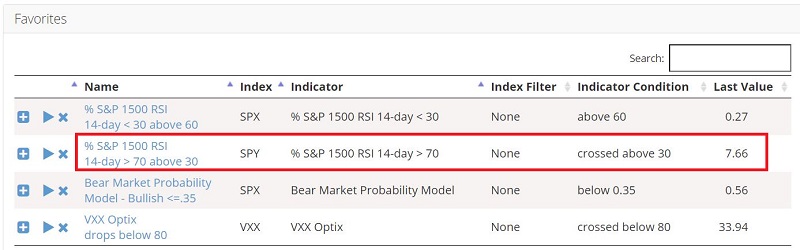
To access the other Favorites listed in the screenshot above, see this article, this article, and this article.