Data &
Technology
Research
Reports
Report Solutions
Reports Library
Actionable
Strategies
Free
Resources
Simple Backtest Calculator
Simple Seasonality Calculator
The Kelly Criterion Calculator
Sentiment Geo Map
Public Research Reports
Free Webinar
Pricing
Company
About
Meet Our Team
In the News
Testimonials
Client Success Stories
Contact
Log inLoginSign up
< BACK TO ALL REPORTS

Backtest Engine Scans I Have Known and Loved - The Bear Market Probability Edition

Jay Kaeppel
2021-04-14
This is another in a series of articles designed to help investors and traders to build an arsenal of useful tools that can be employed when the time is right.

Generally speaking, the mandate is to be "topical", i.e., to write about things that are relevant to investors and traders in the here and now.

However, as I see it, another objective is to help investors and traders to build an arsenal of useful tools that can be employed when the time is right. So, in this periodic series on Backtest Engine scans the material that I present will often NOT be relevant in the here and now.

Take this one for instance.

The Bear Market Probability Model is a model outlined by Goldman Sachs using five inputs covering fundamental, valuation, and price-based metrics. In theory, its readings can range from 0 to 1, but since a few early extreme readings in the early 1950s, the extremes have been 0.11 in March 2009 and 0.81 in August of 2018.  

The chart below displays the S&P 500 Index on top and the Bear Market Probability Model at the bottom.

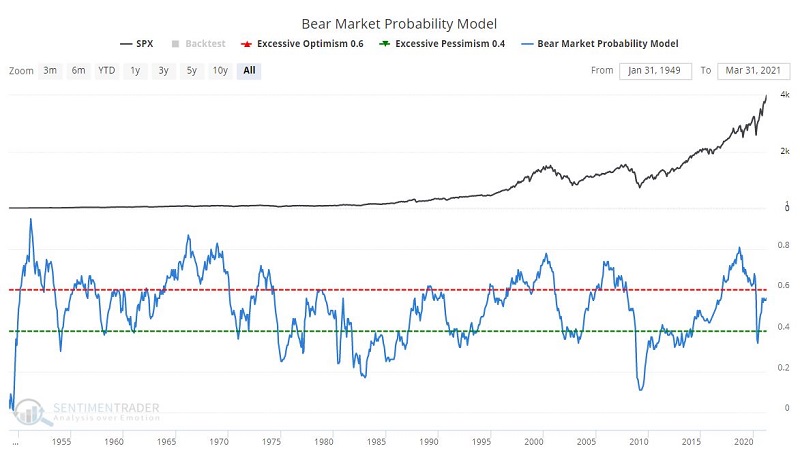
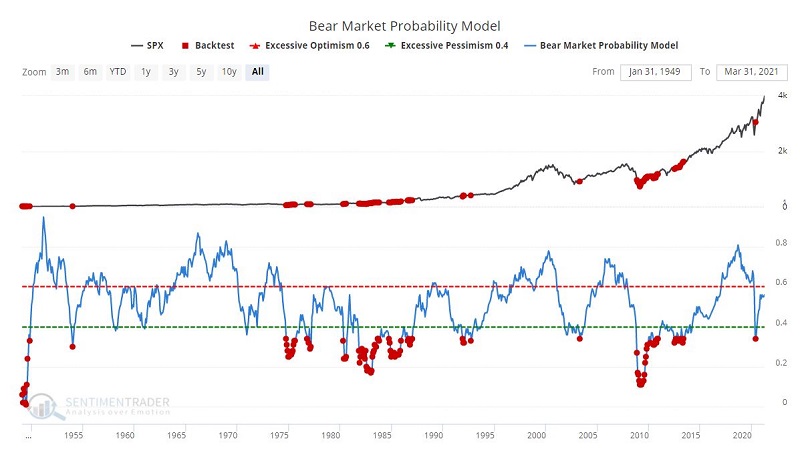
While there are many ways to analyze and utilize this model, for the purposes of this piece we will focus on just one. Clicking on this link and then clicking "Run Backtest" will generate the results shown below. In this test, we are simply highlighting:

  • Every month for which the Bear Market Probability Model reads 0.35 or less

You can save this test as a Favorite Backtest and in the Evening Digest email, you would see if any of your favorite tests have triggered.

The screenshot below displays some of the relevant performance figures. 

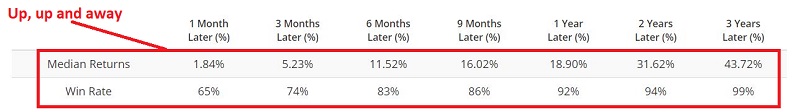
Some key things to note are that each time frame showed a:

  • Median profit
  • Larger median profit than the previous time frame
  • Higher Win Rate than the previous time frame.

In addition, the median gain for 1 year was a solid +18.9% and median gains continued to grow significantly in years 2 and 3 after the signal.

There are two pieces of bad news:

  • The stock market typically experiences some "pain" leading up to a favorable reading of 0.35% or less. In other words, signals tend to occur only after a significant bear market decline has unfolded over a number of months or even years. So, this is not something we necessarily "wish for" - just something we should be prepared to take advantage of when the opportunity does present itself
  • There is absolutely no guarantee that the market will NOT continue to fall for some period of time and distance after a Bear Market Probability Model reading below 0.35. Following the October 2008 signal, the S&P 500 Index fell almost 25% more before finally bottoming out

The Bottom Line

The Bear Market Probability Model is a tool and NOT a "sure-fire, you can't lose, the market is sure to rally" indication. 

The proper use of this tool goes something like this:

  • The next time you find yourself feeling fearful in the market, go ahead and run this scan 
  • If you find a reading of 0.35 or less that is your cue to hold your emotions in check and to start making plans to participate in a robust bull market in the years ahead

Sorry, you don't have access to this report

Upgrade your subscription plan to get access
Go to Dasboard
DATA &
TECHnologies
IndicatorEdge
‍
BackTestEdge
‍
Other Tools
‍
DataEdge API
RESEARCH
reports
Research Solution
‍
Reports Library
‍
actionable
Strategies
Trading Strategies
‍
Smart Stock Scanner
‍
FREE
RESOUrCES
Simple Backtest
Calculator
Simple Seasonality
Calculator
The Kelly Criterion
Calculator
Sentiment Geo Map
‍
Public Research Reports
‍
Free Webinar
COMPANY
‍
About
‍
Meet our Team
‍
In the News
‍
Testimonials
‍
Client Success Stories
Pricing
Bundle pricing
‍
Announcements
‍
FAQ
© 2024 Sundial Capital Research Inc. All rights reserved.
Setsail Marketing
TermsPrivacyAffiliate Program
Risk Disclosure: Futures and forex trading contains substantial risk and is not for every investor. An investor could potentially lose all or more than the initial investment. Risk capital is money that can be lost without jeopardizing ones’ financial security or life style. Only risk capital should be used for trading and only those with sufficient risk capital should consider trading. Past performance is not necessarily indicative of future results.

Hypothetical Performance Disclosure: Hypothetical performance results have many inherent limitations, some of which are described below. No representation is being made that any account will or is likely to achieve profits or losses similar to those shown; in fact, there are frequently sharp differences between hypothetical performance results and the actual results subsequently achieved by any particular trading program. One of the limitations of hypothetical performance results is that they are generally prepared with the benefit of hindsight. In addition, hypothetical trading does not involve financial risk, and no hypothetical trading record can completely account for the impact of financial risk of actual trading. for example, the ability to withstand losses or to adhere to a particular trading program in spite of trading losses are material points which can also adversely affect actual trading results. There are numerous other factors related to the markets in general or to the implementation of any specific trading program which cannot be fully accounted for in the preparation of hypothetical performance results and all which can adversely affect trading results.

Testimonial Disclosure: Testimonials appearing on this website may not be representative of other clients or customers and is not a guarantee of future performance or success.