
Backtest Engine Scans I Have Known and Loved - The VXX Edition

If you have been a Sentimentrader subscriber for any length of time you are likely quite familiar with the Backtest Engine. There is good news and bad news associated with this powerful tool.
- The good news is that it can help you to separate "fiction" from "reality" and to identify events that highlight opportunity with a high degree of consistency
- The bad new is that finding these things that "work" can take some time and, well, work on your part
To some extent this should be expected and not come as a surprise. In this day and age of instant information (not to mention the desire for instant gratification) it is common for a trading idea or investment theme to capture a great deal of attention due to a recent good signal or trade. Unfortunately, a lot of this type of information preys on "recency bias", whereby a recent good signal and a lot of hype can lead people to think they are on to something that will serve as the keys to the kingdom. Sadly, it just doesn't work like that in real-world trading.
As I like to highlight, successful trading/investing involves 3 parts:
- Step #1: Deciding what to invest in (hopefully based on some objective basis in which you have a high degree of confidence)
- Step #2: Allocating capital wisely and managing risk ruthlessly
- Step #3: Having the discipline to stick with your strategy/system/method long enough to derive the expected benefit
The Backtest Engine is merely a tool to help with Step #1 above. Having said this, this is the first in what will be an ongoing series designed to save you some time and effort and that will highlight some specific scans that may help you to achieve Step #1 above. Steps #2 and # 3 are topics for another day.
Ticker VXX
Ticker VXX is an ETN which was - in theory (and theory only) - designed to give investors/traders exposure to changes in the CBOE VIX Index through near-term VIX futures contracts. Traders who buy VXX are anticipating an increase in the VIX Index/futures, while trades who short VXX are anticipating a decrease in the VIX Index/futures. There are also options traded on VXX.
The reality is that due primarily to contango (either Google it or peruse this link) VXX has been one of the most consistent wealth destruction machines of all-time - at least for traders who only play the long side. The logarithmic charts below (courtesy of AIQ TradingExpert) will give you a sense of things. The top clip shows the VIX Index as calculated daily by the CBOE and the bottom clip displays the price action for ticker VXX.
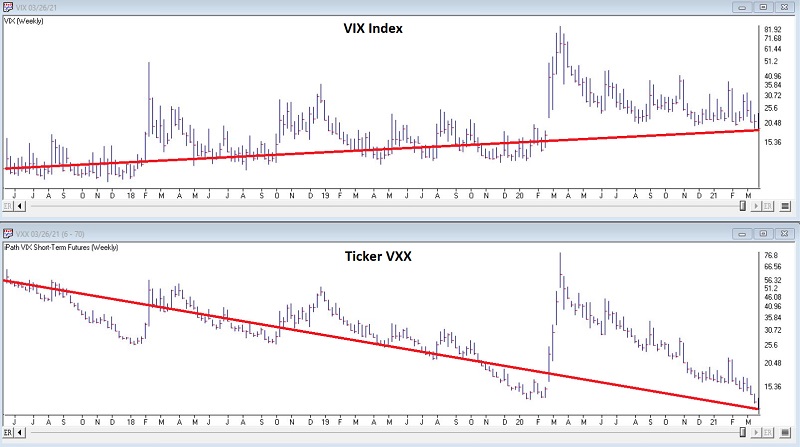
Note that the VIX Index itself has moved mostly sideways to slightly higher over the course of the period in the chart. Now note that VXX - despite some significant spikes along the way in response to spikes in the VIX Index itself - has trended significantly lower over time.
Now to the scan.
Clicking this link and clicking "Run Backtest" will run the scan. This particular scan is designed to identify and measure the forward performance of ticker VXX when:
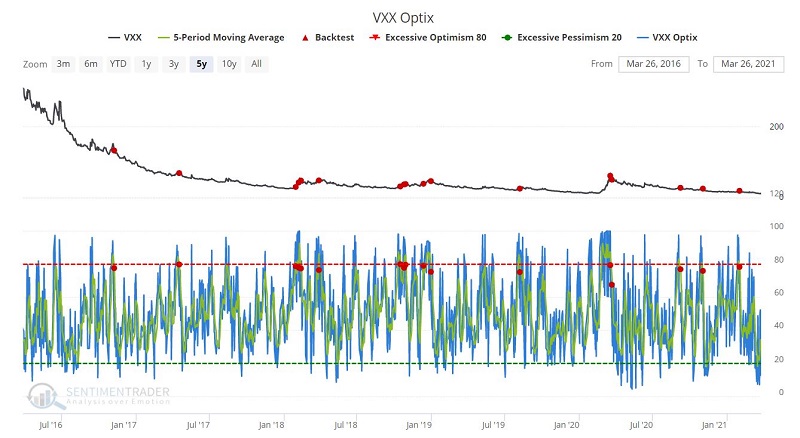
- The 5-day moving average of VXX Optix drops below 80
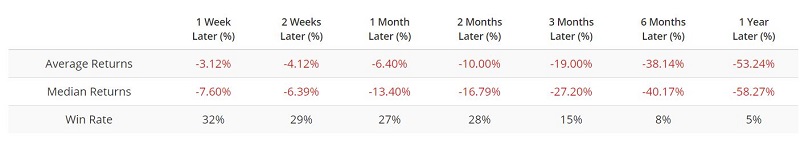
Given the relentless march lower by VXX we should not be surprised to see a lot of negative numbers. But the numbers in the table below are abysmal.
The chart below displays the signals over the past 5 years denoted with a red dot.
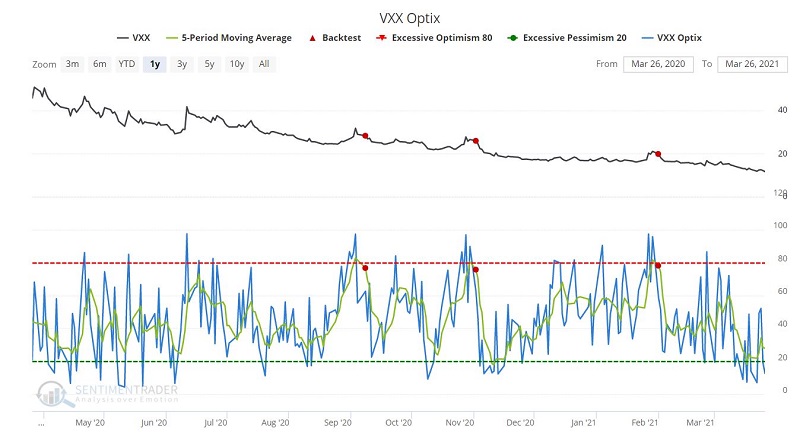
The chart below zooms in to show the last year of results.
The results of this scan suggest that a drop from 80 or above by the 5-day moving average of VXX Optix may signal a good time for a volatility trader to play the short side of volatility - via either a short futures position or an option position (Note to myself: Sounds like a good topic for a future article).
Lastly, by clicking the icon below in the input window you can copy the exact parameters of any san for future use.
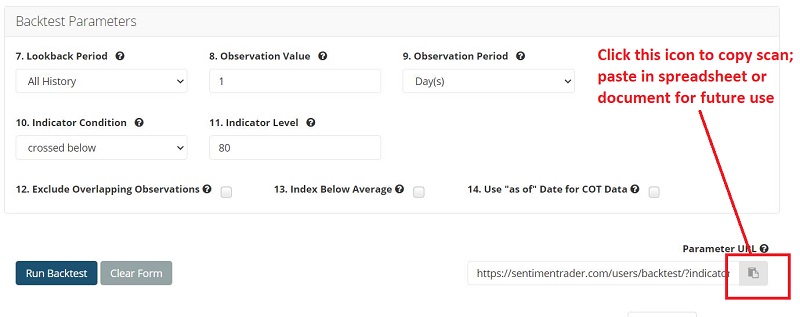
- Click icon to copy link
- Paste link to a spreadsheet or document
In this manner you can start your own list of Backtest Engine scans.