Data &
Technology
Research
Reports
Report Solutions
Reports Library
Actionable
Strategies
Free
Resources
Simple Backtest Calculator
Simple Seasonality Calculator
The Kelly Criterion Calculator
Sentiment Geo Map
Public Research Reports
Free Webinar
Pricing
Company
About
Meet Our Team
In the News
Testimonials
Client Success Stories
Contact
Log inLoginSign up
< BACK TO ALL REPORTS

Backtest Engine Scans I Have Known and Loved - The-14-Day RSI Edition (Part I)

Jay Kaeppel
2021-04-30
An oversold reading in the 14-day RSI for most stocks can signal an impending bull market. This piece discusses one objective way to identify these opportunities using our Backtest Engine.

Most traders learn the conventional wisdom concepts of "overbought is bad" and "oversold is good" pretty early on. On the other hand, it usually takes some time to learn the counter-intuitive lesson that, at times, overbought can be just as favorable as oversold.  To illustrate these concepts, we will use two separate Backtest Engine scans, both using the 14-day RSI on the stocks in the S&P 1500 Index.

OVERSOLD

In classic technical analysis, traders look for selling to become overdone as a sign that a bottom might soon be in place. Let's look at one scan that fits this role. 

By clicking this link and then clicking "Run Backtest" you can run the following test:

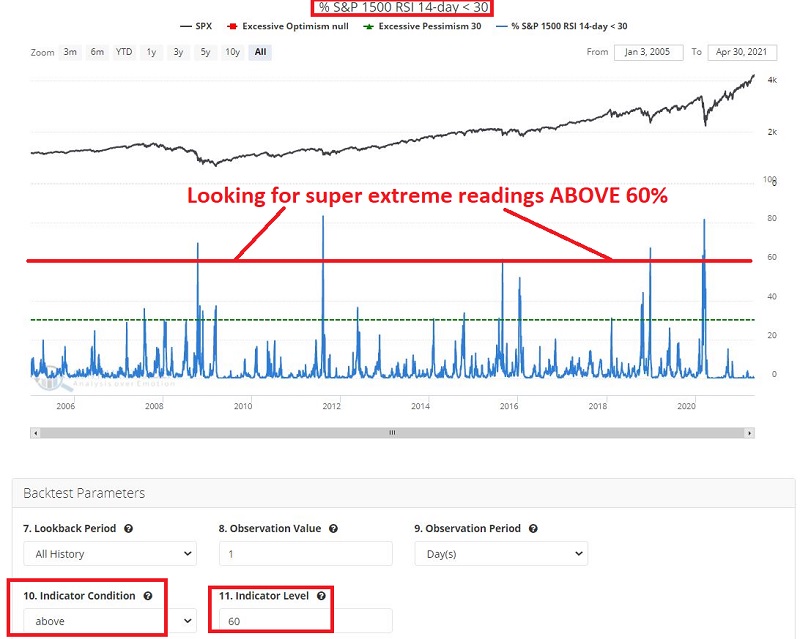
  • We look at % S&P 500 1500 RSI 14-day < 30
  • We look for a value of 60 or higher

In plain English, we are looking at 1,500 stocks, and we are identifying those times when at least 60% of those 1,500 stocks have a 14-day RSI reading of 30 or lower on the same day. This is one objective way to designate a severely oversold market.

  • The bad news is that this signal does not happen very often
  • The good news is that when it does, it strongly suggests that the worst is just about over and that a significant bull market is in the offing

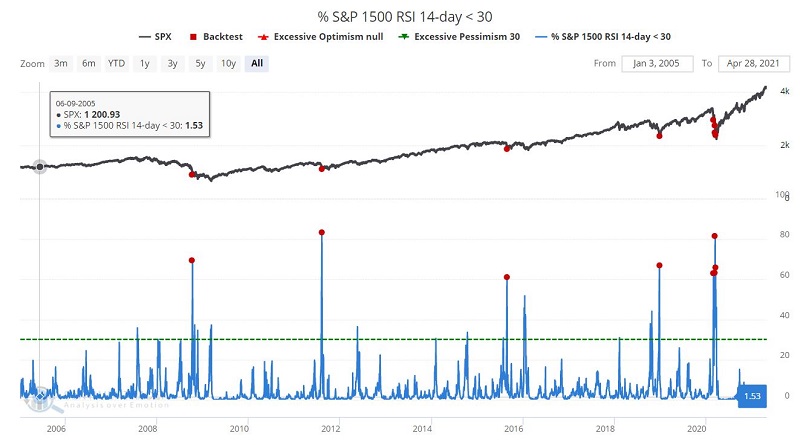
% S&P 500 RSI 14-day < 30 ABOVE 60

The chart below displays the signals.

The figure below displays a summary of results 1 week to 1 year after each signal in the chart above. The results are exceptionally bullish.
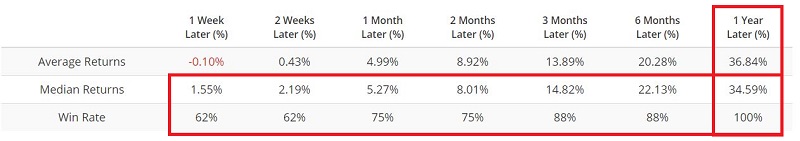
Note that:

  • The average and median returns increase with each passing timeframe
  • The Win Rate also trends higher the more time that goes by
  • The 1-year Win Rate is 100%
  • The 1-year Median return is a terrific +34.59%

As I said, the only problem with this particular signal is:

  • It doesn't happen very often
  • The market typically needs to experience some significant pain before a signal occurs

SAVING THE BACKTEST SCAN

This one is definitely worth adding to the archives. You can do so by:

  • Clicking "Add to Favorites"

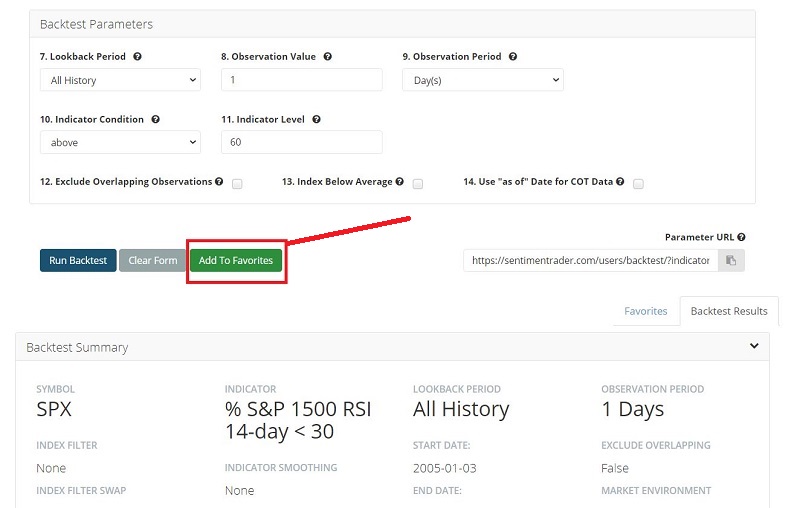
  • Typing "% S&P 1500 RSI 14-day < 30 above 60"

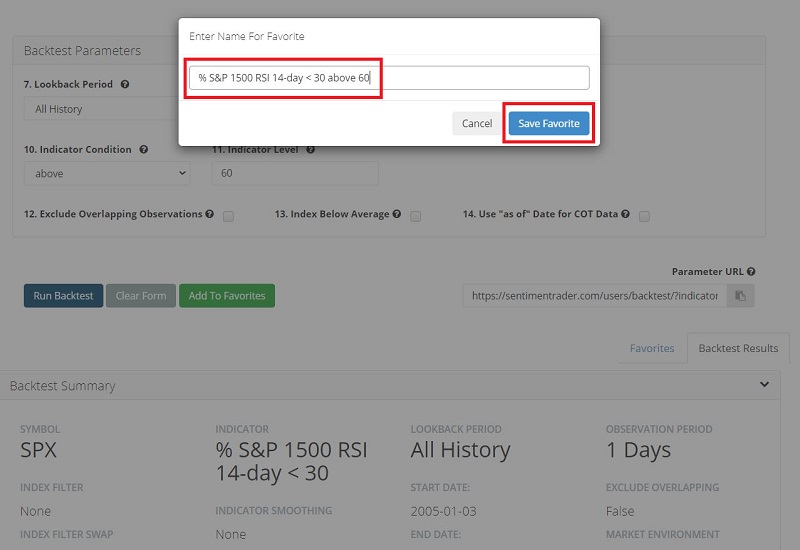
  • Then click "Save Favorite"

These steps will add this particular scan to your list of Favorites. Anytime you enter Backtest Engine, your Favorites will appear at the bottom as per below.

For premium users, the Evening Digest emailed at the end of each day will include a section at the bottom that highlights any of your Favorite Backtests currently active.

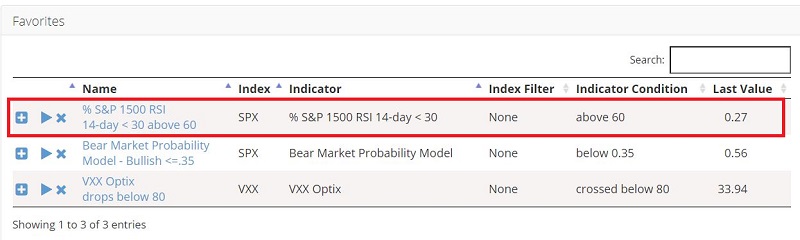
Access the other Favorites listed in the screenshot above; see this article and this article.

SUMMARY

The signal detailed above does not occur very often.  But when it does, it certainly appears to be worth knowing about.  The steps above can automate your ability to be alerted when the next signal occurs.

Sorry, you don't have access to this report

Upgrade your subscription plan to get access
Go to Dasboard
DATA &
TECHnologies
IndicatorEdge
‍
BackTestEdge
‍
Other Tools
‍
DataEdge API
RESEARCH
reports
Research Solution
‍
Reports Library
‍
actionable
Strategies
Trading Strategies
‍
Smart Stock Scanner
‍
FREE
RESOUrCES
Simple Backtest
Calculator
Simple Seasonality
Calculator
The Kelly Criterion
Calculator
Sentiment Geo Map
‍
Public Research Reports
‍
Free Webinar
COMPANY
‍
About
‍
Meet our Team
‍
In the News
‍
Testimonials
‍
Client Success Stories
Pricing
Bundle pricing
‍
Announcements
‍
FAQ
© 2024 Sundial Capital Research Inc. All rights reserved.
Setsail Marketing
TermsPrivacyAffiliate Program
Risk Disclosure: Futures and forex trading contains substantial risk and is not for every investor. An investor could potentially lose all or more than the initial investment. Risk capital is money that can be lost without jeopardizing ones’ financial security or life style. Only risk capital should be used for trading and only those with sufficient risk capital should consider trading. Past performance is not necessarily indicative of future results.

Hypothetical Performance Disclosure: Hypothetical performance results have many inherent limitations, some of which are described below. No representation is being made that any account will or is likely to achieve profits or losses similar to those shown; in fact, there are frequently sharp differences between hypothetical performance results and the actual results subsequently achieved by any particular trading program. One of the limitations of hypothetical performance results is that they are generally prepared with the benefit of hindsight. In addition, hypothetical trading does not involve financial risk, and no hypothetical trading record can completely account for the impact of financial risk of actual trading. for example, the ability to withstand losses or to adhere to a particular trading program in spite of trading losses are material points which can also adversely affect actual trading results. There are numerous other factors related to the markets in general or to the implementation of any specific trading program which cannot be fully accounted for in the preparation of hypothetical performance results and all which can adversely affect trading results.

Testimonial Disclosure: Testimonials appearing on this website may not be representative of other clients or customers and is not a guarantee of future performance or success.