Reports Library

Search our Library

Explore our vast report library, a resource packed with data-driven insights and expert market perspectives.
Thank you! Your submission has been received!
Oops! Something went wrong while submitting the form.
Kaeppel's Corner
Indicator signals you were probably not aware of (and how to use them)

Indicator signals you were probably not aware of (and how to use them)

Unfortunately, many traders and investors view every given indicator signal as a "Buy" or "Sell" signal. But the reality is that most indicator signals do not serve that purpose. Most often, they serve merely as weight of the evidence, and nothing more. Luckily, this can be extremely valuable in keeping individuals on the right side of the market. Three examples herein.
2026-08-03 at 10:30:00 PDT
Read More
ModelEdge report
Bollinger Band Buy Signal Concept

Bollinger Band Buy Signal Concept

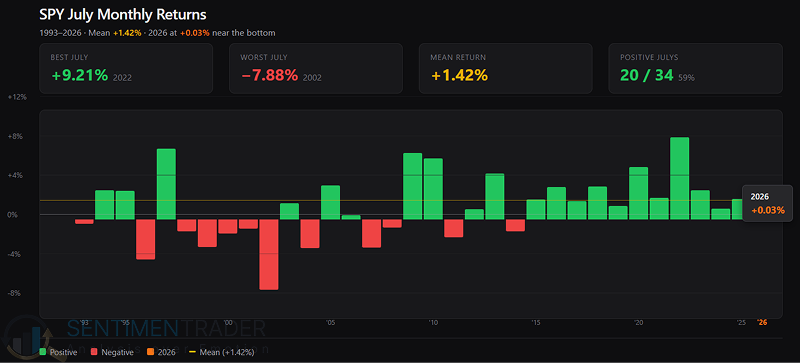
July 2026 marked SPY's worst July performance in a decade, closing with a microscopic 0.03% gain. While a systematic Bollinger Band squeeze setup identifies robust medium-term upside, short-term data warns of near-term turbulence
2026-08-03 at 10:00:00 PDT
Read More
Weekend Reading
TradingEdge Weekly for Jul 31 - Unleaded Gas bearish setup, Utility-tech divergence, COT positioning extremes, Seasonal sell zones, Treasury yield spike, KOSPI selloff, Hedge fund rebound

TradingEdge Weekly for Jul 31 - Unleaded Gas bearish setup, Utility-tech divergence, COT positioning extremes, Seasonal sell zones, Treasury yield spike, KOSPI selloff, Hedge fund rebound

As the 10-year Treasury hits a 1-year high and utility stocks massively outperform tech, equities face a volatile crossroads. Despite near-term geopolitical headwinds, rare breadth signals point to robust long-term gains.
2026-07-31 at 15:00:00 PDT
Read More
Kaeppel's Corner
Korean stock market: Crater Yes, Capitulation No

Korean stock market: Crater Yes, Capitulation No

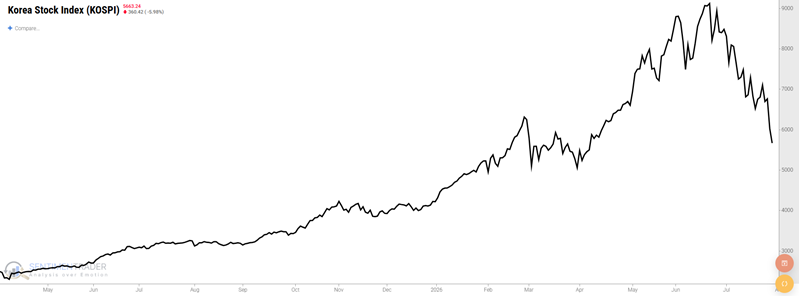
The Korean Stock Index (KOSPI) has plunged almost 40% in just over a month. Many traders are wondering if the worst is over and if a buying opportunity is at hand. Herein, we detail the latest action of three "panic" indicators to assess whether or not we have seen true capitulation.
2026-07-30 at 10:30:00 PDT
Read More
SentimentEdge report
Hedge fund exposure rebounds

Hedge fund exposure rebounds

Hedge Fund Exposure has staged a rapid zero-line reversal from extreme 84-day lows, triggering a constructive short-term signal for the S&P 500. However, historical threshold statistics show the market performs best while exposure remains low, suggesting this move reflects easing defensive positioning rather than a structural bullish shift.
2026-07-30 at 10:00:00 PDT
Read More
ModelEdge report
The 10-year Treasury yield reached a new 1-year high

The 10-year Treasury yield reached a new 1-year high

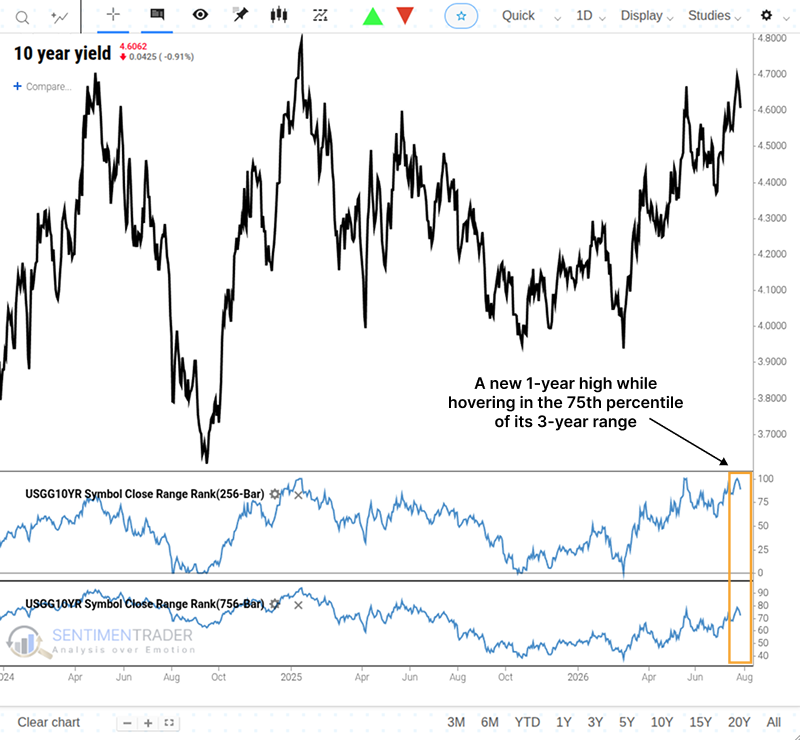
The 10-year Treasury yield hit a one-year high, reaching the 75th percentile of its 3-year range. Over the last decade, this rare technical signal has historically triggered short-term equity pain followed by robust long-term gains.
2026-07-29 at 10:00:00 PDT
Read More
Kaeppel's Corner
Two stock market sectors to avoid for now

Two stock market sectors to avoid for now

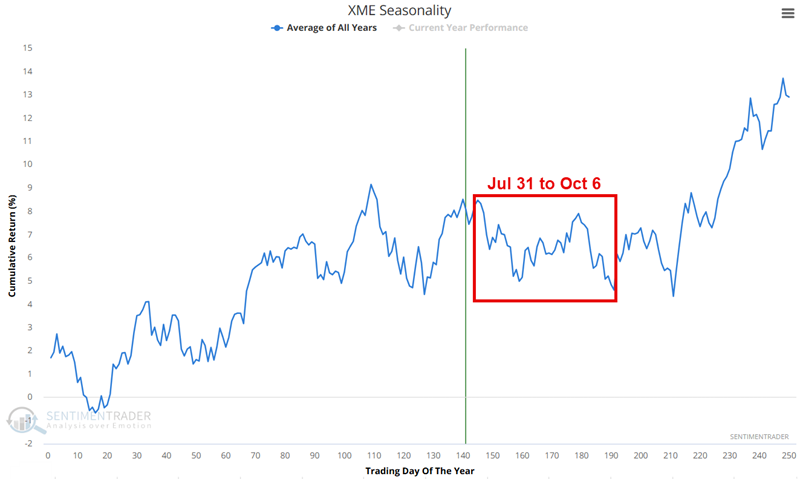
Sometimes, knowing where NOT to invest can be just as valuable as knowing where to invest. Both the Metals and Mining sector and emerging markets are soon entering unfavorable seasonal periods. History suggests that investors should look elsewhere for opportunities for now.
2026-07-28 at 10:30:00 PDT
Read More
SentimentEdge report
Hedgers hit zero while speculators sit near 90

Hedgers hit zero while speculators sit near 90

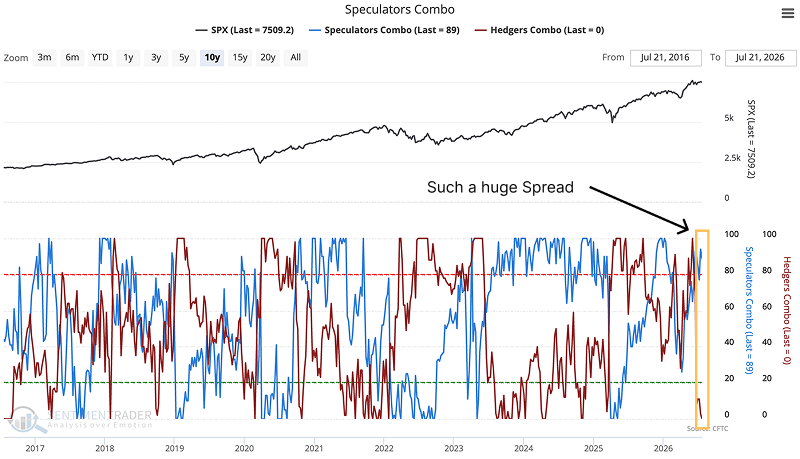
S&P 500 futures see a rare rapid COT positioning shift as the Regime Gap 7-week change drops below -120 and the Hedgers Combo completes a full 100-to-0 cycle. History signals elevated short-term volatility and mostly positive longer-term returns.
2026-07-28 at 10:00:00 PDT
Read More
ModelEdge report
Utility uptrends vastly outnumber tech's

Utility uptrends vastly outnumber tech's

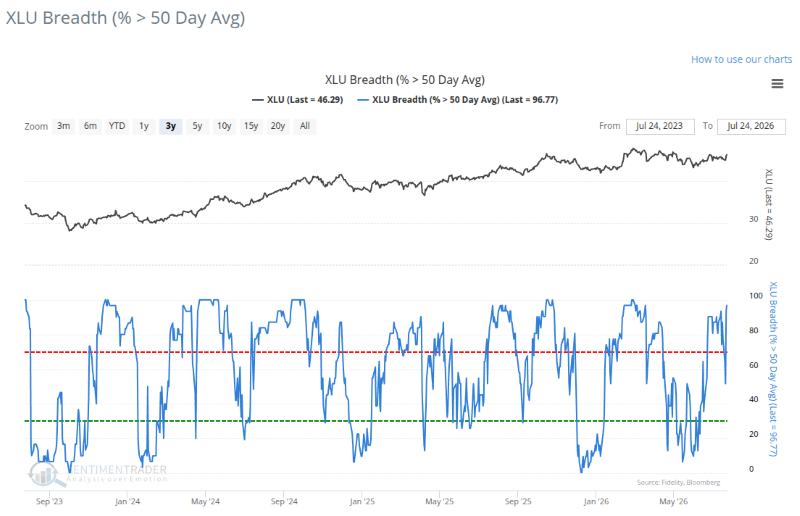
A rare 65% breadth gap has opened between utility and tech stocks, occurring fewer than 30 times in 30 years. While historically bullish, the S&P 500 falling below its 50-day moving average signals rising short-term risk
2026-07-27 at 10:00:00 PDT
Read More