
Why this breadth thrust is like 1962

Key points:
- The percentage of stocks trading above their 10, 50-, and 200-day averages cycled from an extreme low to high
- In the 50 days since the bottom, this behavior is most similar to June 1962
- The highest-correlated 50-day rallies from a low mostly showed long-term gains
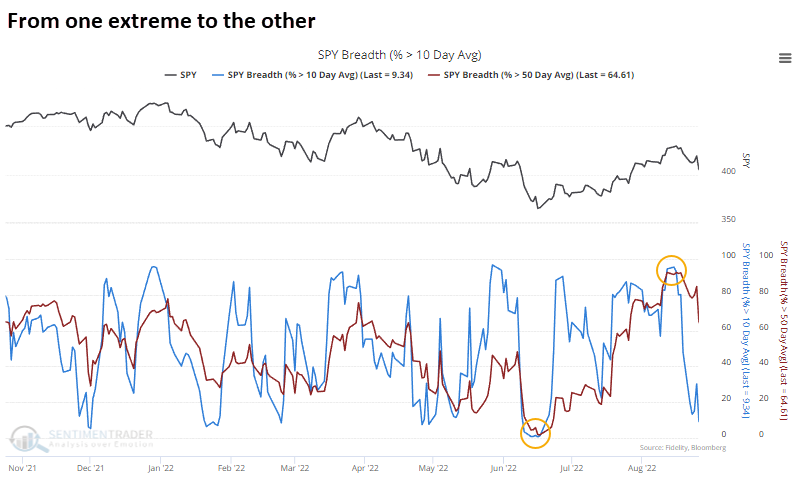
Buyers returned in earnest, now they're fleeing
Since late June, we've spent a lot of time discussing the return of eager buyers into stocks and high-yield bonds. During bear markets, we rarely see the buying interest evident over the past two months. And it's seldom as broad-based as it has been since June.
The percentage of S&P 500 member stocks trading above their short- and medium-term averages has cycled from extreme to extreme. When cycling so quickly from one to the other, it never failed to lead to a positive return over the next year.
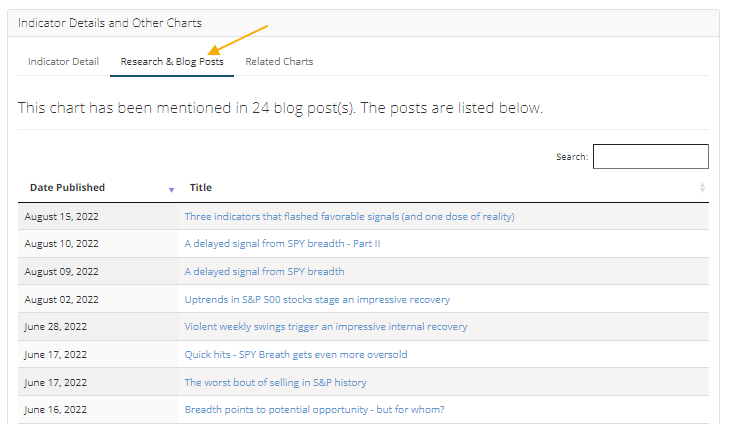
There have been many studies based on these indicators. You can pull up the percentage of stocks trading above their 10-day moving average or 50-day moving average, scroll to the bottom and click the Research & Blog Posts tab to see a list of recent discussions.
Stocks are wobbling now, inviting bears' ridicule about the thrusts' efficacy. Apparently, stocks are just supposed to rally every single day. They don't; they recently became overbought, sentiment became stretched, and now momentum has ebbed. All of that - so far - is normal.
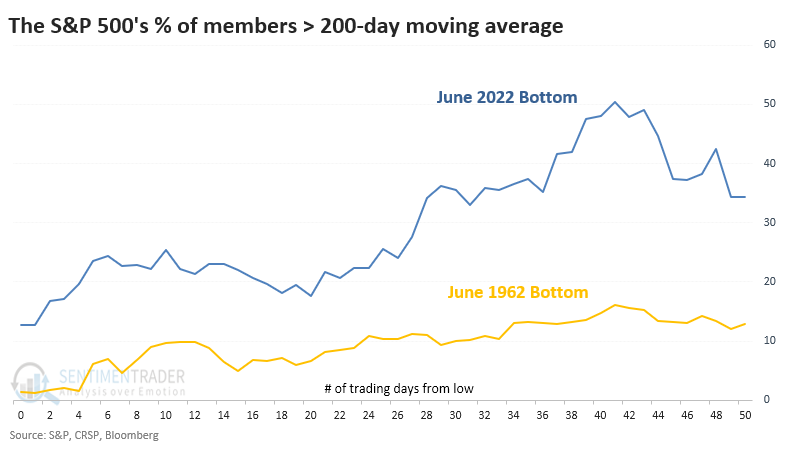
In the 50 days after the low, this is most like 1962
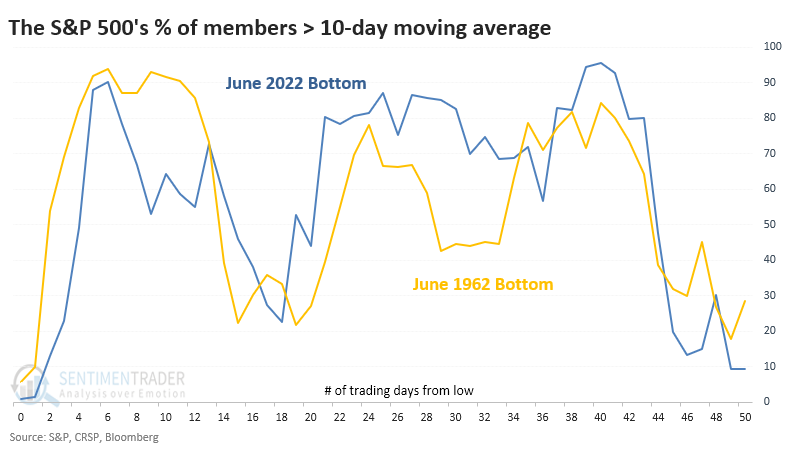
If we look at the percentage of S&P 500 stocks above their 10-, 50-, and 200-day moving averages and compare the last 50 days to every 50-day rally off of a one-year low since 1928, we can get a better sense of whether this is normal or not.
If we correlate those three breadth measures over the past 50 days to every other low, the rally off of the June 1962 bottom showed the highest value. These two time periods had a 0.83 correlation (from -1.0 to +1.0). That bottom carved out almost an exact replica in the percentage of member stocks above their 10-day moving average.
The same goes for the percentage above their 50-day moving average.
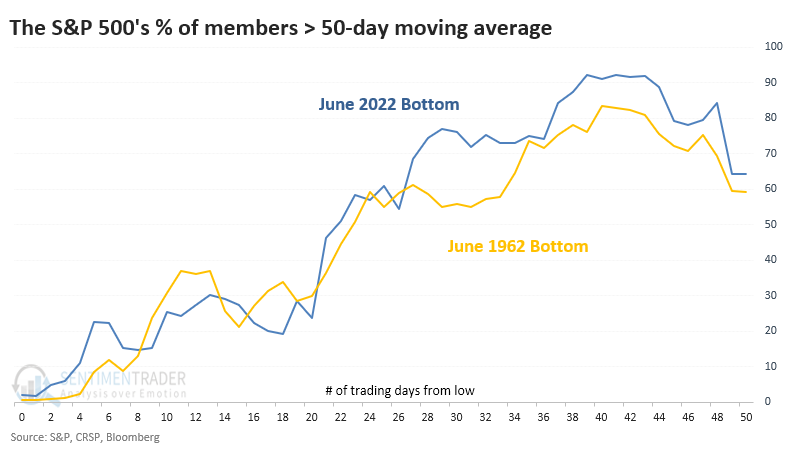
The longer-term indicators were the most different. While the overall pattern was similar, our current rally has seen many more members holding above their long-term 200-day moving average.
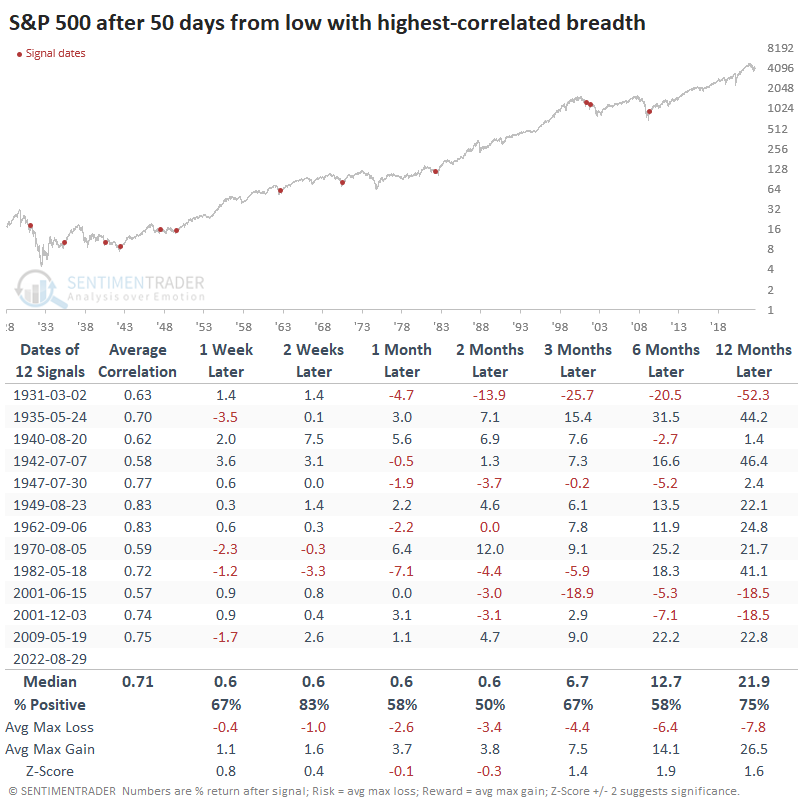
The table below shows the S&P 500's future returns after the 50-day rallies from a one-year low, with the highest correlation in members trading above their three moving averages. The decline to the one-year low had to be at least 20% to qualify.
It was not a fail-safe indicator that we're in the clear. Stocks behaved similarly in 2001 (twice) and in 1931, both leading to terrible failures. But the other nine signals preceded gains over the next year, typically by double-digits.
What the research tells us...
We're undoubtedly mired in a bear market and likely a recession. Sentiment reached a level in June that typically precedes multi-month rallies even in the face of those headwinds, and this time was no different. What was different was the thrust in buying interest over the past two months. That is not what we have typically (or almost ever) seen during ongoing bear markets. It raised the probability that short-term weakness will be temporary. It's always scary because we never know if it's all going to fail, and we'll head to lower lows. The macro and fundamental picture certainly seem to point that way. But the way buyers have responded, with the move in stocks trading above their moving averages, points to success as a higher probability.