Products
SentimenTrader Trading Tools
‍
Backtest Engine
My Trading Toolkit
Correlation Analysis
Seasonality
Indicators & Data API
‍
Proprietary Indicators & Charts
Market Data API
Strategies & Scanner
‍
50+ Trading Strategies
Smart Stock Scanner
Research Reports
‍
Research Solutions
Reports Library
Free Resources
Simple Backtest Calculator
Simple Seasonality Calculator
The Kelly Criterion Calculator
Sentiment Geo Map
Public Research Reports
Pricing
Company
About
In the News
Testimonials
Client Success Stories
Contact
Log inLoginSign up
< BACK TO ALL REPORTS

Uptrends in S&P 500 stocks stage an impressive recovery
Jason Goepfert
2022-08-02
The S&P 500 enjoyed its best monthly gain in over a year after suffering a large drawdown, which is price action typically seen at the ends of bear markets. Within the index, more than 75% of member stocks are in medium-term uptrends, a sharp recovery from what had been fewer than 5% of stocks. That preceded gains 100% of the time.

Key points:

  • Fewer than 5% of stocks in the S&P 500 were in medium-term uptrends in June
  • Uptrends have since surged to more than 75% of stocks, a cycle that preceded year-long gains
  • The index sported its best monthly gain in over a year after a 20% drawdown, typically seen at the ends of bear markets

From nay to yay

A little over a month ago, we looked at the internal recovery among stocks in the S&P 500 after a string of violent moves. Similar behavior preceded excellent returns. It's only gotten better since then.

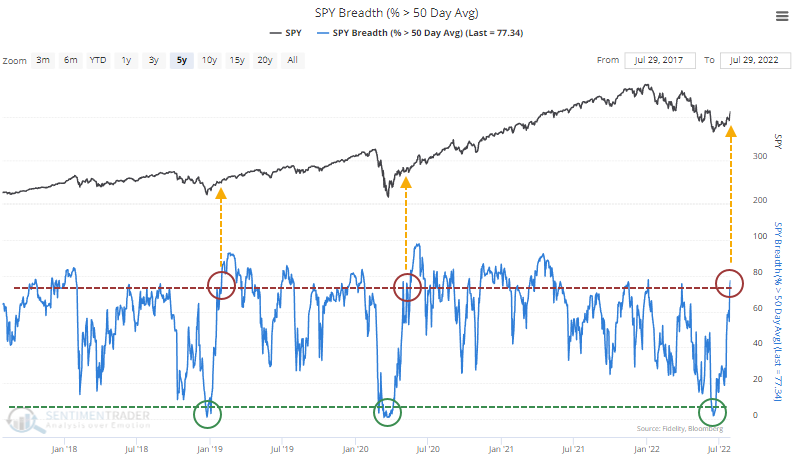
With a continued rise last week, more than three out of every four stocks in the index recovered above their 50-day moving averages, the most since the beginning of the year. The other two times in the past five years, when this cycled from fewer than 5% of stocks to more than 75%, it coincided with the kick-off to sustained rises.

Historically, this was more the rule than the exception. Since 1950, there have been 25 times when medium-term uptrends in S&P 500 stocks plunged to an extremely low level and then recovered to a high level. Over the next 6-12 months, losses were rare, and there was really only one complete failure in 1969.
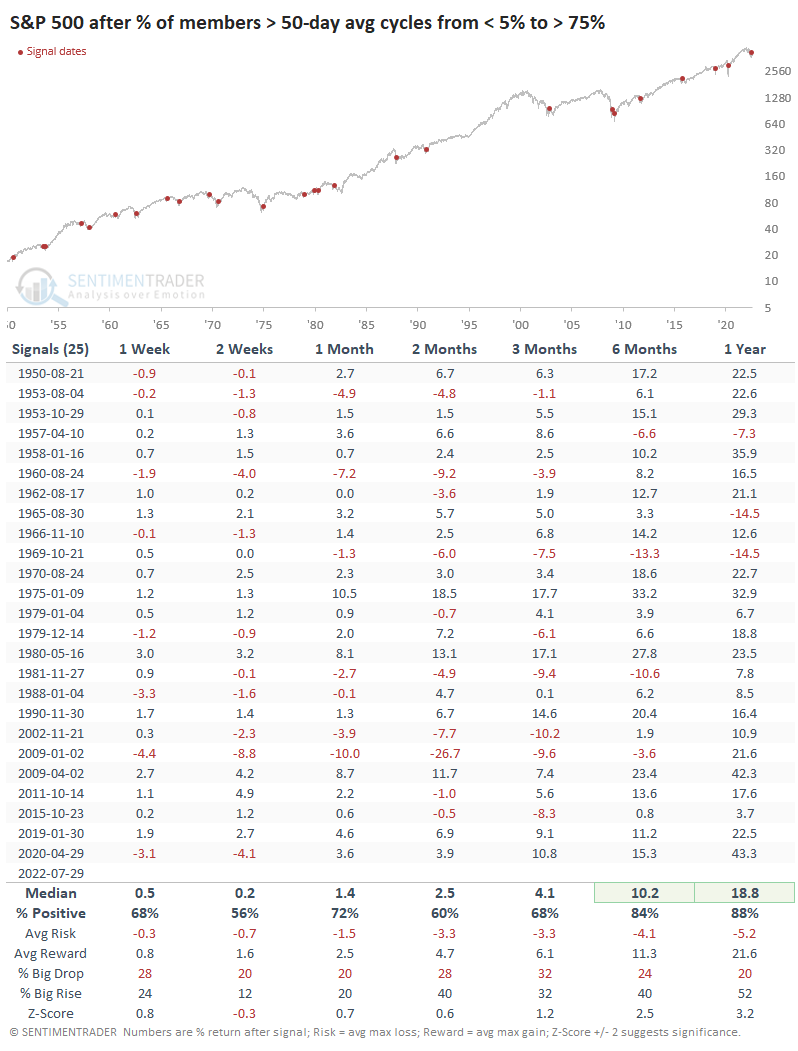
The current cycle is even more notable because of how quickly it unfolded. It took only 27 trading days for stocks to recover, the 6th-fastest cycle in more than 70 years. The table below filters the cycles to include only those triggered within two months. The following 6-12 months showed excellent returns, with no losses a year later. 
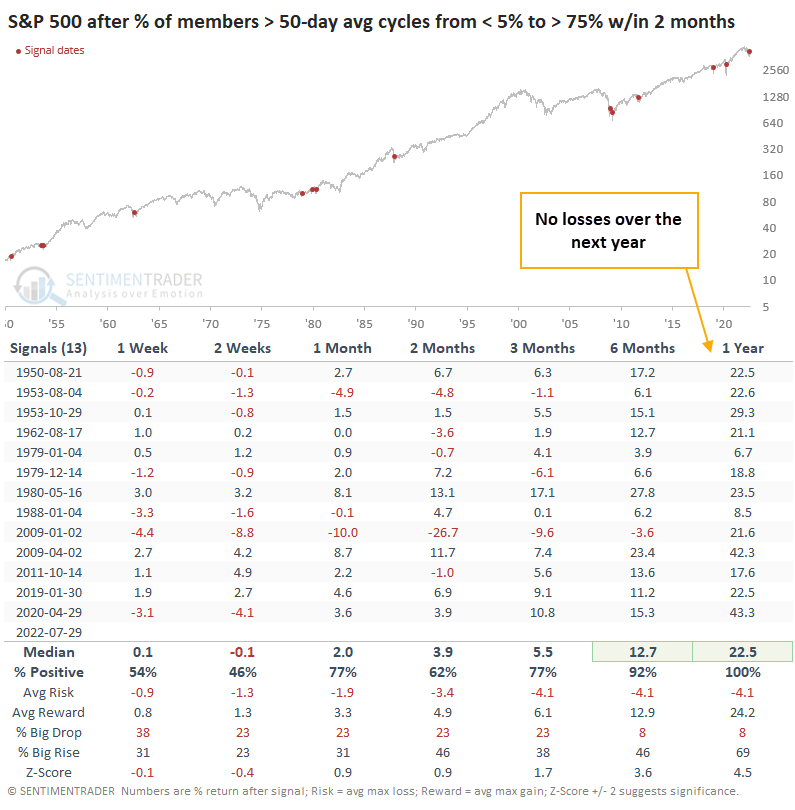
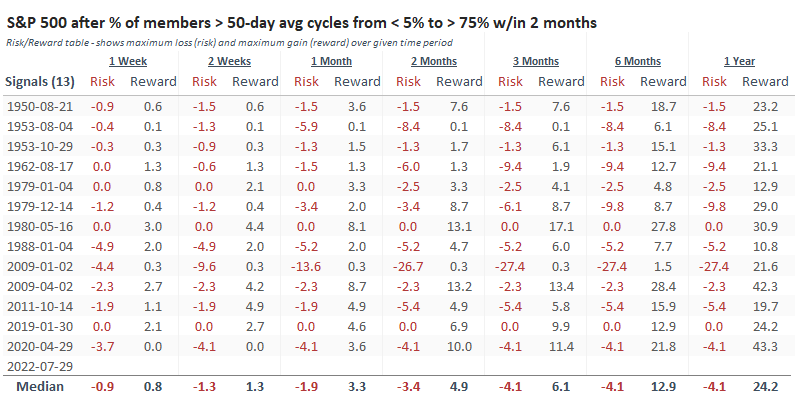
It took some grit for an investor to hold after the January 2009 signal, suffering a nearly 30% drawdown within the first three months. That was the only one that an investor would have hold through a double-digit drawdown. On the flip side, all but two signals enjoyed a gain of 20% or more at the best point during the next year (okay, it was 19.7% in 2011, but close enough).
The index made an impressive recovery, too

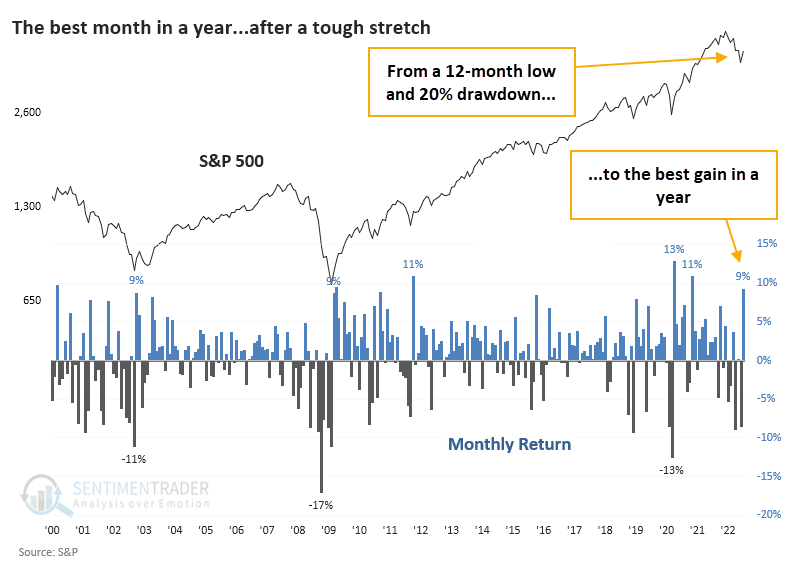
The stock recovery helped propel the index to its best monthly gain in almost two years. That relief was welcome, as it came on the heels of a 12-month low and a 20% drawdown. 
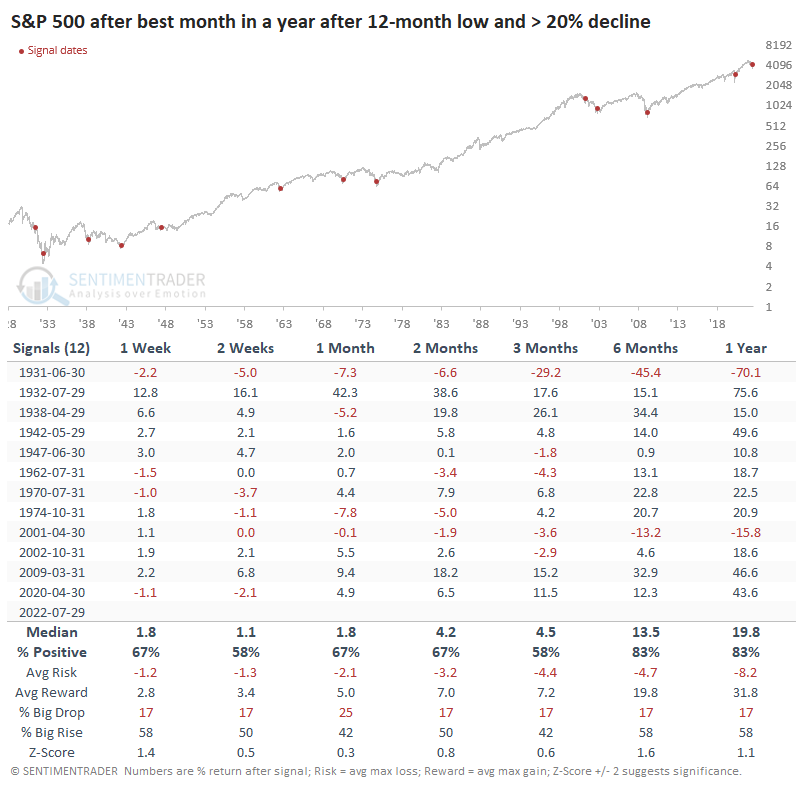
Similar behavior mainly occurred at the ends of bear markets. There were two exceptions, in 1931 and 2001, both of which failed almost immediately. The others may have some shorter-term weakness, but the losses tended to be limited. Over the next 6-12 months, returns and maximum gains were excellent.
What the research tells us...

The setup was ripe for at least a bear market rally in late June. Sentiment was about as bad as it gets, for as long as it gets before dip-buyers tend to step in. And they did, aggressively. That triggered some thrust-y signals a month ago, and unlike others over the past six months, buyers persisted and triggered even more compelling signals. It's another sign that this recovery should have legs.

Sorry, you don't have access to this report

Upgrade your subscription plan to get access
Go to Dasboard
PRODUCTS
SentimenTrader
Trading Tools
Indicators & Data API
‍
Strategies & Scanner
‍
Research Reports
FREE
RESOUrCES
Simple Backtest
Calculator
Simple Seasonality
Calculator
The Kelly Criterion
Calculator
Sentiment Geo Map
‍
Public Research Reports
‍
Pricing
Bundle pricing
‍
Announcements
‍
FAQ
COMPANY
‍
About
‍
In the News
‍
Testimonials
‍
Client Success Stories
CONTACT
‍
General Inquiries
‍
Media Inquiries
‍
Financial Professionals Inquiries
‍
© 2025 Sundial Capital Research Inc. All rights reserved.
Setsail Marketing
TermsPrivacyAffiliate Program
Risk Disclosure: Futures and forex trading contains substantial risk and is not for every investor. An investor could potentially lose all or more than the initial investment. Risk capital is money that can be lost without jeopardizing ones’ financial security or life style. Only risk capital should be used for trading and only those with sufficient risk capital should consider trading. Past performance is not necessarily indicative of future results.

Hypothetical Performance Disclosure: Hypothetical performance results have many inherent limitations, some of which are described below. No representation is being made that any account will or is likely to achieve profits or losses similar to those shown; in fact, there are frequently sharp differences between hypothetical performance results and the actual results subsequently achieved by any particular trading program. One of the limitations of hypothetical performance results is that they are generally prepared with the benefit of hindsight. In addition, hypothetical trading does not involve financial risk, and no hypothetical trading record can completely account for the impact of financial risk of actual trading. for example, the ability to withstand losses or to adhere to a particular trading program in spite of trading losses are material points which can also adversely affect actual trading results. There are numerous other factors related to the markets in general or to the implementation of any specific trading program which cannot be fully accounted for in the preparation of hypothetical performance results and all which can adversely affect trading results.

Testimonial Disclosure: Testimonials appearing on this website may not be representative of other clients or customers and is not a guarantee of future performance or success.