Data &
Technology
Research
Reports
Report Solutions
Reports Library
Actionable
Strategies
Free
Resources
Simple Backtest Calculator
Simple Seasonality Calculator
The Kelly Criterion Calculator
Sentiment Geo Map
Public Research Reports
Free Webinar
Pricing
Company
About
Meet Our Team
In the News
Testimonials
Client Success Stories
Contact
Log inLoginSign up
< BACK TO ALL REPORTS

Violent weekly swings trigger an impressive internal recovery

Jason Goepfert
2022-06-28
Over the past five weeks, the S&P 500 has swung by 5% or more four times. That's tied for the 2nd-most volatile stretch since 1928. Fewer than 2% of its member stocks were holding above their 50-day averages; now more than 20% are. Similar bouts of volatility and internal reversals have coincided with the ends of bear markets more often than not.

Key points:

  • The S&P 500 has swung by more than 5% almost every week for five weeks
  • Its member stocks have gone from a few medium-term uptrends to nearly a quarter of stocks
  • Similar volatility and reversals have (mostly) coincided with the ends of bear markets

A historic streak of volatility

Investors have enjoyed a few days of relief. They deserve it after suffering through the most overwhelming selling pressure in history.

While the plunge to new lows was devastatingly lopsided, it's not like there haven't been attempts at a recovery, including last week. The S&P 500 has swung at least 5% weekly for four of the past five weeks. That ties it for the 2nd-most volatile five-week stretch since 1928.

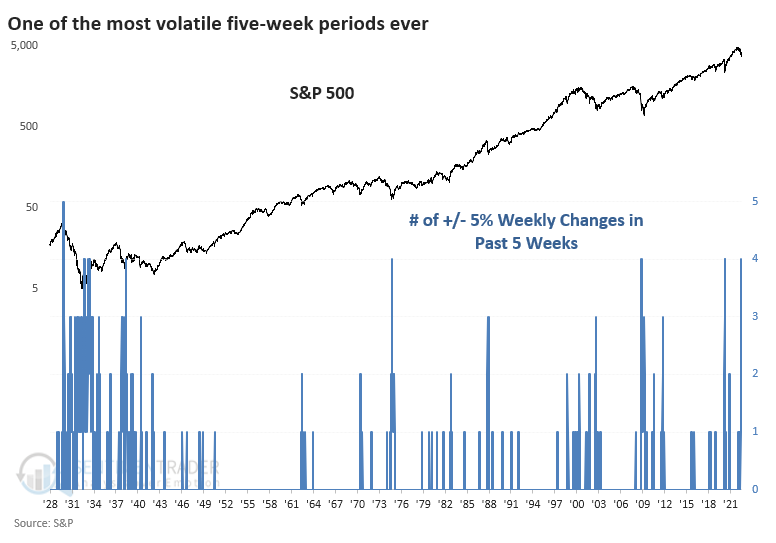
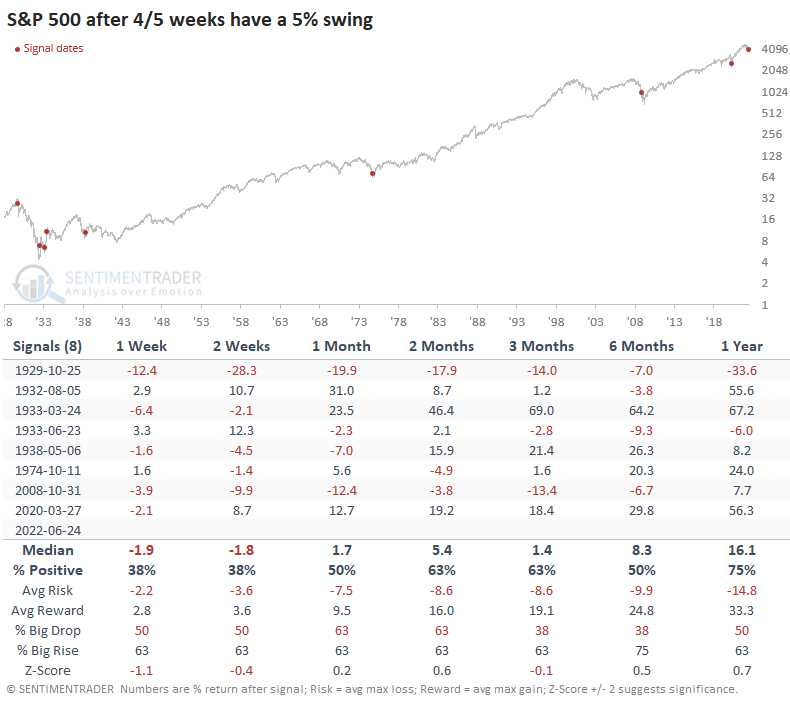
The handful of other times it suffered such volatile action over such a compressed time frame, it tended to lead to short-term weakness but long-term gains. Only three other periods can compare during modern markets; all three were at or near market bear market lows.

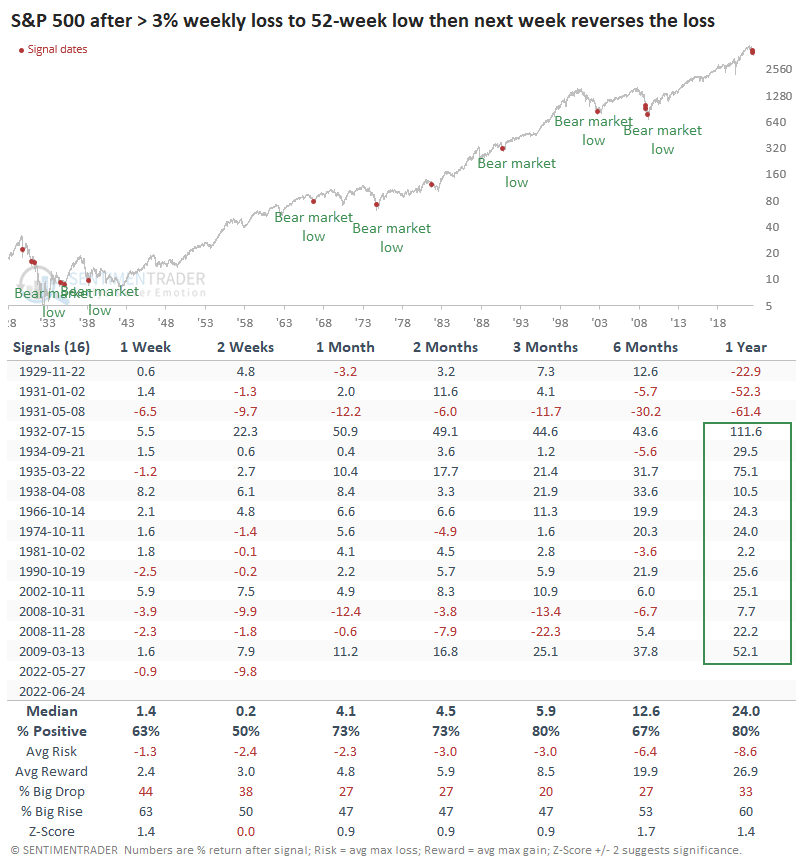
If we relax the 5% weekly swing threshold to 3%, then last week's reversal shows some impressive precedents when coming on the heels of a 52-week low. About half of them marked the ends of bear markets, or nearly so. Every signal since 1932 sported a positive one-year return.

Not just a few stocks

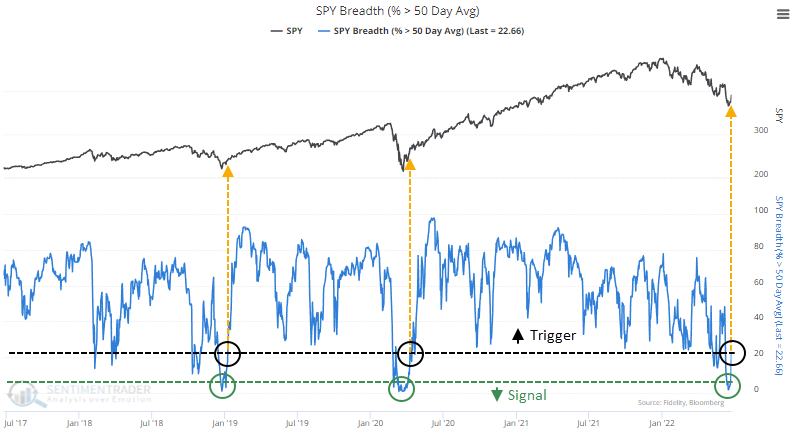
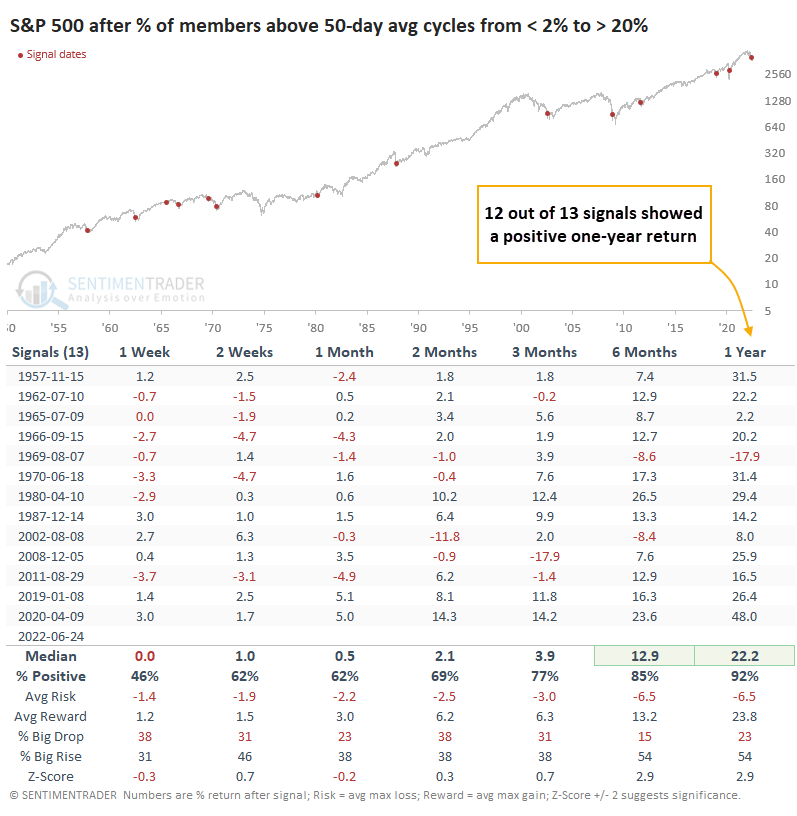
The recovery in the indexes showed broad participation. Recently, fewer than 2% of stocks within the S&P 500 were holding above their 50-day moving averages, one of the lowest readings in 70 years. Now, more than 20% have moved above their medium-term trend lines. The only times this happened in recent years marked the ends of bear markets.

If we go back to 1950, it's mostly the same conclusion. Out of 13 signals, only one of them failed to lead to a positive one-year return.

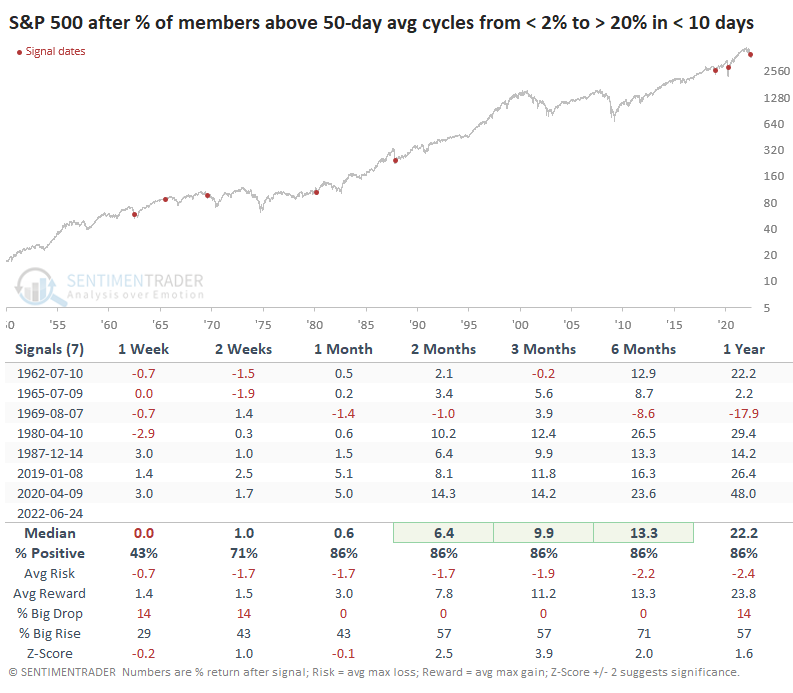
This was the fastest-ever recovery, taking fewer than five sessions. If we filter the table above to include the quickest reversals, those that take ten days or fewer, then medium-term returns improved considerably. All of the signals showed a positive return either two or three months later. The risk/reward skew from two months and beyond was tilted heavily toward "reward."

What the research tells us...

A week like last week tends to trigger a quick improvement in sentiment, but there is scant evidence that's the case. After more than a few fakeouts and failures, investors are understandably skeptical. By the price action and internal participation alone, though, there is compelling evidence that moods should improve in the coming weeks, helping to spur rising prices. It would be rare for the volatility and reversals similar to recent weeks to fail again and lead to lower lows.

Sorry, you don't have access to this report

Upgrade your subscription plan to get access
Go to Dasboard
DATA &
TECHnologies
IndicatorEdge
‍
BackTestEdge
‍
Other Tools
‍
DataEdge API
RESEARCH
reports
Research Solution
‍
Reports Library
‍
actionable
Strategies
Trading Strategies
‍
Smart Stock Scanner
‍
FREE
RESOUrCES
Simple Backtest
Calculator
Simple Seasonality
Calculator
The Kelly Criterion
Calculator
Sentiment Geo Map
‍
Public Research Reports
‍
Free Webinar
COMPANY
‍
About
‍
Meet our Team
‍
In the News
‍
Testimonials
‍
Client Success Stories
Pricing
Bundle pricing
‍
Announcements
‍
FAQ
© 2024 Sundial Capital Research Inc. All rights reserved.
Setsail Marketing
TermsPrivacyAffiliate Program
Risk Disclosure: Futures and forex trading contains substantial risk and is not for every investor. An investor could potentially lose all or more than the initial investment. Risk capital is money that can be lost without jeopardizing ones’ financial security or life style. Only risk capital should be used for trading and only those with sufficient risk capital should consider trading. Past performance is not necessarily indicative of future results.

Hypothetical Performance Disclosure: Hypothetical performance results have many inherent limitations, some of which are described below. No representation is being made that any account will or is likely to achieve profits or losses similar to those shown; in fact, there are frequently sharp differences between hypothetical performance results and the actual results subsequently achieved by any particular trading program. One of the limitations of hypothetical performance results is that they are generally prepared with the benefit of hindsight. In addition, hypothetical trading does not involve financial risk, and no hypothetical trading record can completely account for the impact of financial risk of actual trading. for example, the ability to withstand losses or to adhere to a particular trading program in spite of trading losses are material points which can also adversely affect actual trading results. There are numerous other factors related to the markets in general or to the implementation of any specific trading program which cannot be fully accounted for in the preparation of hypothetical performance results and all which can adversely affect trading results.

Testimonial Disclosure: Testimonials appearing on this website may not be representative of other clients or customers and is not a guarantee of future performance or success.