What I'm looking at - momentum, MACD, Medium Term Risk Levels, GS Current Activity Indicator
With just one month left to go this year, here's what I'm looking at:
Momentum
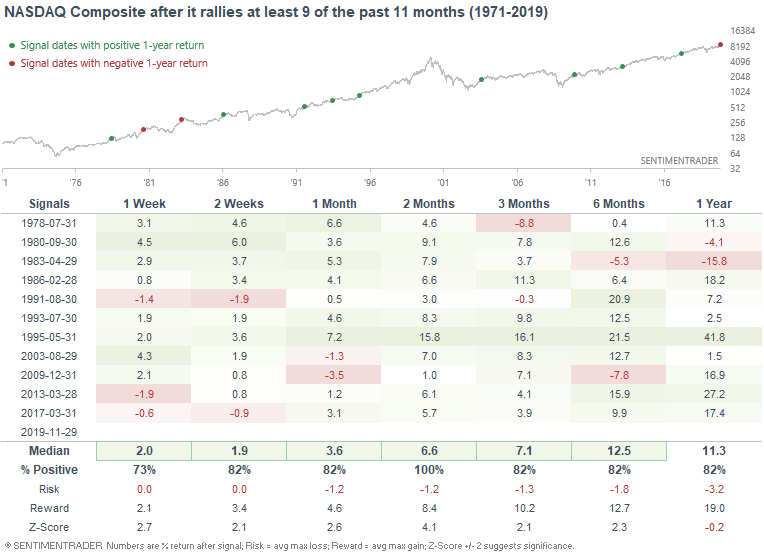
With just one month left this year, U.S. equities have rallied significantly year-to-date. U.S. equity indices like the NASDAQ Composite have gone up 9 of the past 11 months.
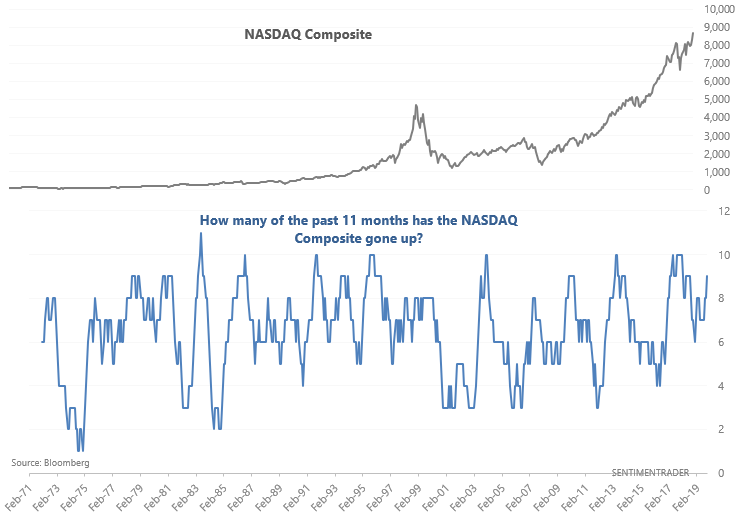
As is the case with most momentum studies, this has been typically bullish for stocks over the coming months:
Here's what happened next to the S&P 500:
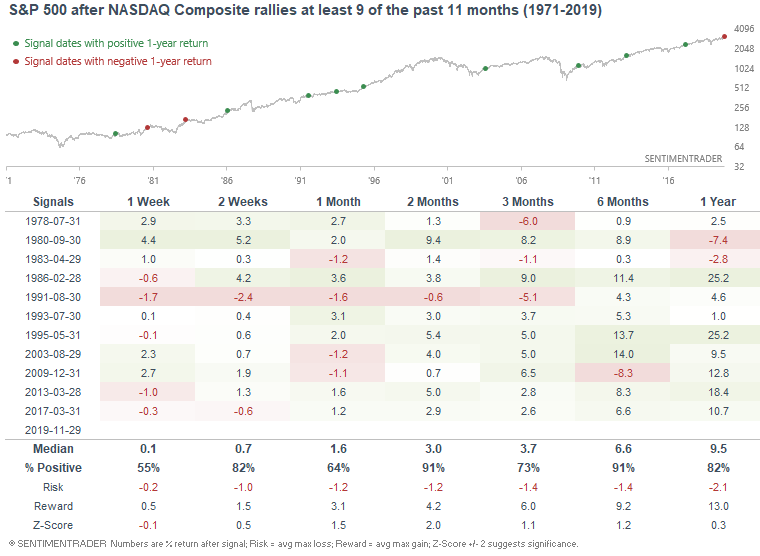
How do we square this with sentiment, which is a bearish factor for stocks right now? Sentiment is best used on a 1-3 month forward time frame (bearish), and momentum is more useful on a 6 month time frame. So I would consider sentiment to be bearish for stocks over the next 1-3 months, and momentum to be bullish over the next 6-12 months.
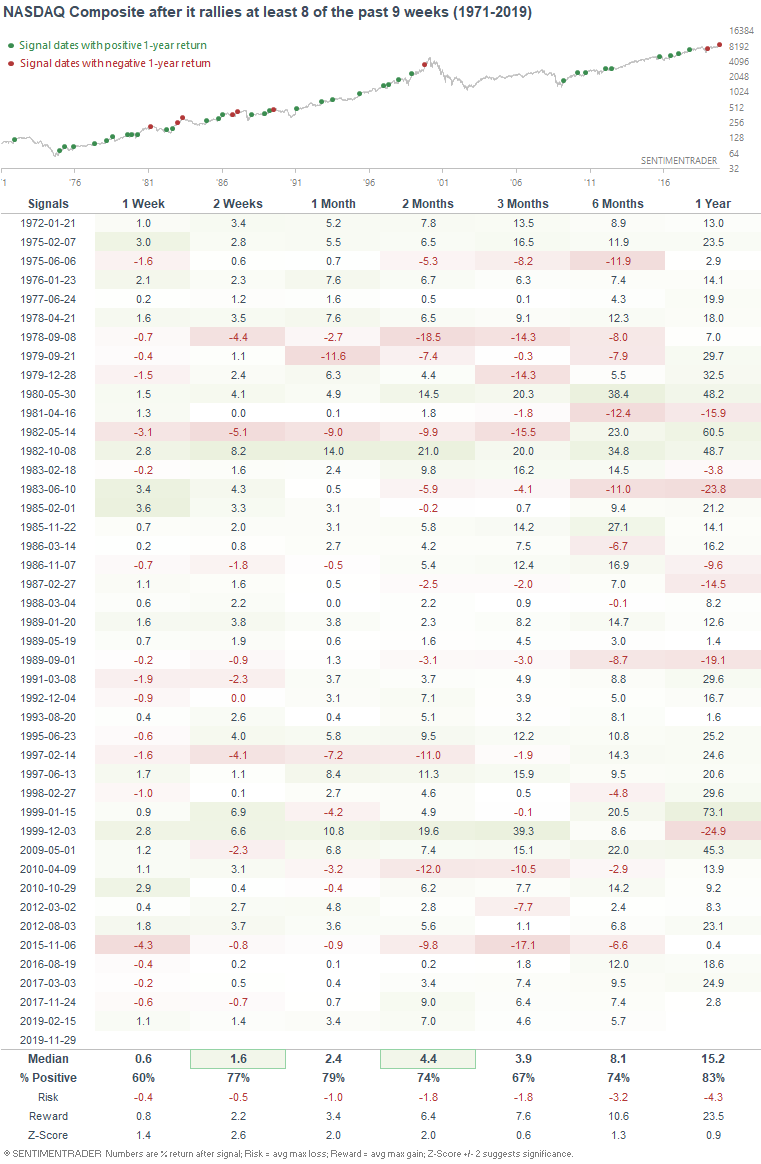
In a similar fashion, the NASDAQ Composite has rallied 8 of the past 9 weeks. This has been more bullish than random for the NASDAQ Composite over the coming weeks and months:
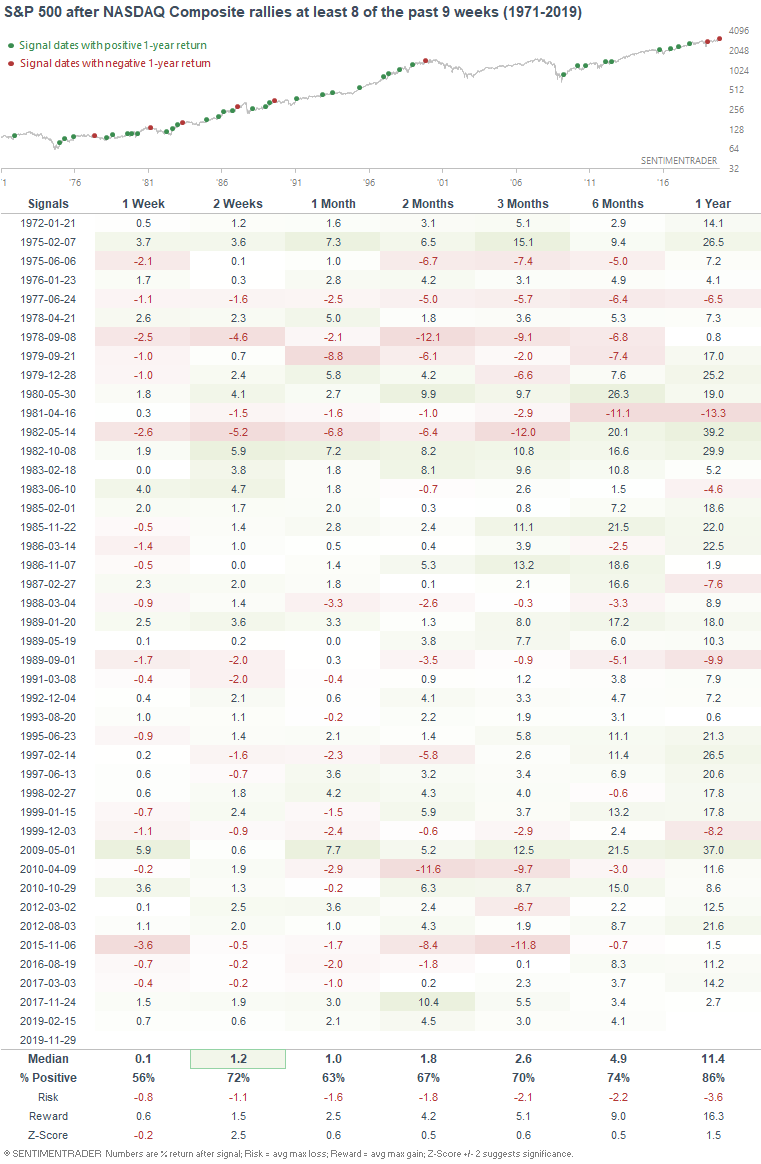
Here's what the S&P 500 did next:
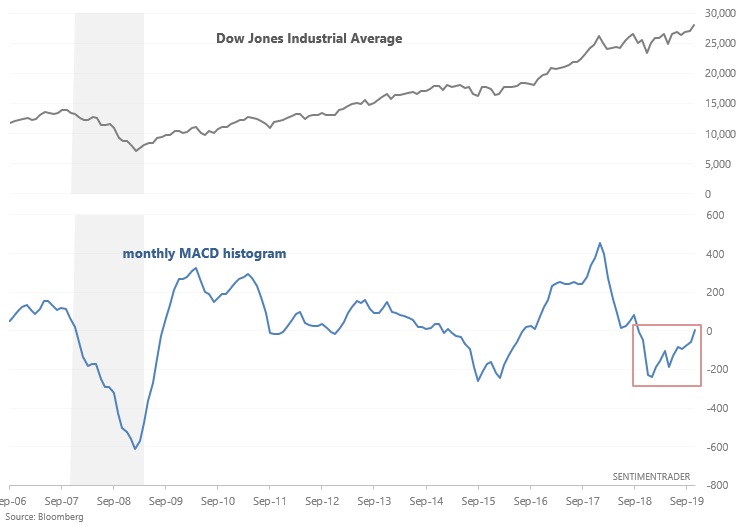
More momentum: MACD
Various U.S. stock market indices' monthly MACD histograms have turned positive for the first time in months. This includes the NASDAQ Composite (which I wrote about here), and now the Dow Jones Industrial Average and NYSE Composite.
When this happened in the past, the Dow's returns over the next year were more bullish than random.
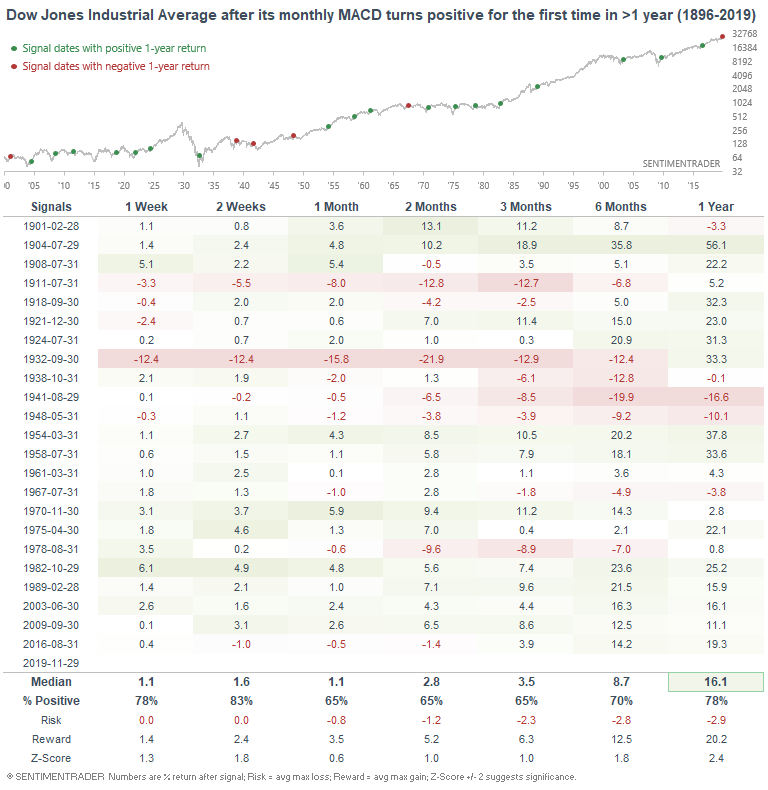
Most of the bearish cases occurred before the 1950s. Dividend yields were much higher pre-1950s than post-1950s. So including dividends, some of the bearish cases would have turned into bullish cases.
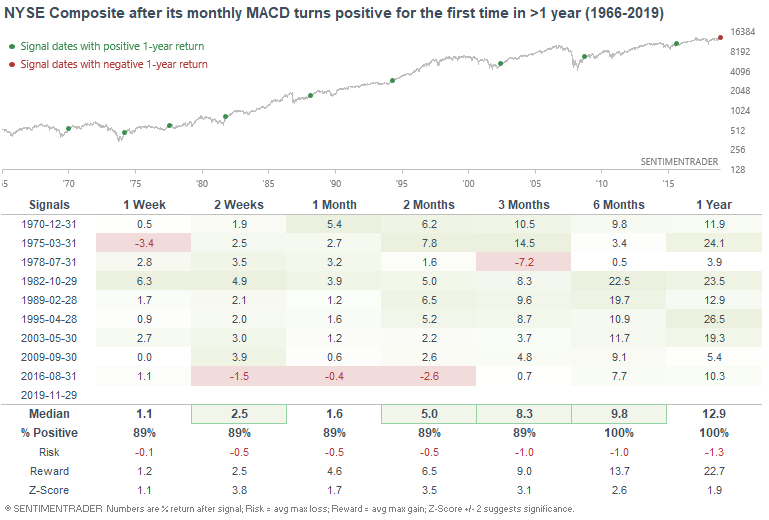
Similarly, the NYSE Composite's monthly MACD has turned positive for the first time in > 1 year.
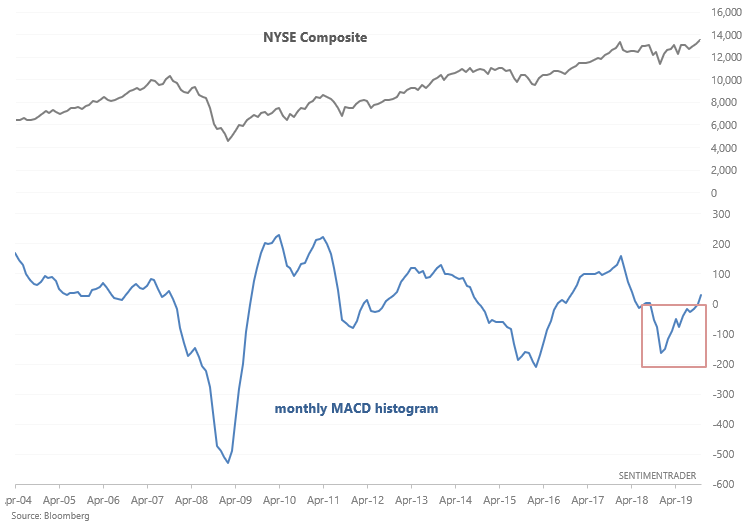
This has been mostly bullish for the NYSE Composite over the next 6-12 months:
Medium Term Risk Levels
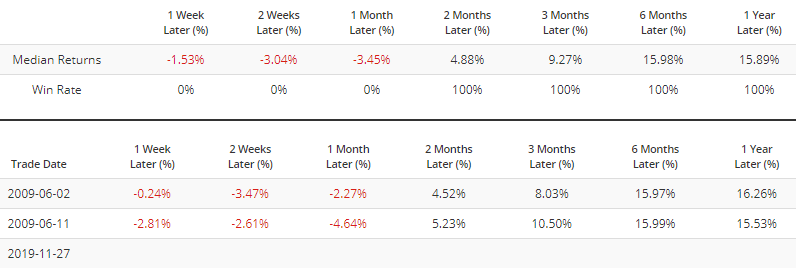
Medium Term Risk Levels are extremely high:
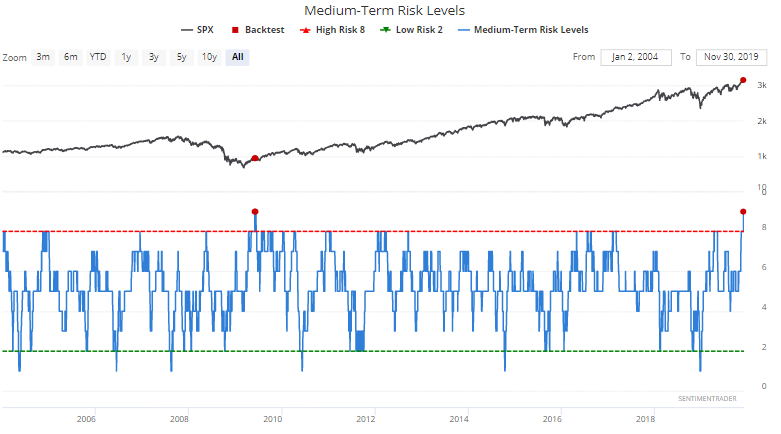
The only comparable historical case occurred in 2009 during a rip-roaring post-bear market rally. But even then, it led to a pullback in the stock market over the next few weeks:
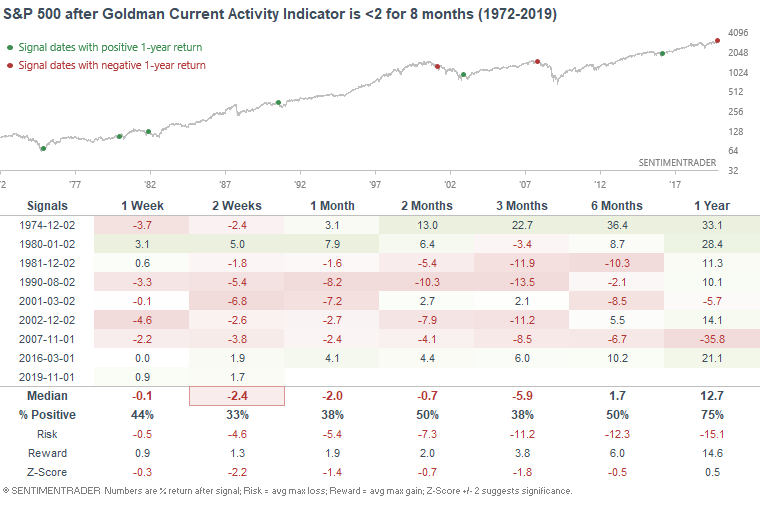
Goldman Sachs Current Activity Indicator
The Goldman Sachs U.S. Current Activity Indicator remains in the doldrums. This proprietary indicator attempts to identify shifts in the economic cycle and incorporate more than 50 indicators, mainly from producing sectors of the economy (e.g. manufacturing, construction, services, labor market). As is the case with most indices that overweight manufacturing, this indicator is sending a sign that is mostly achieved during recessions.
The Goldman Sachs Current Activity Indicator has been below 2 for 8 consecutive months. Aside from the earnings recession of 2015-2016, this always occurred during an economic recession:
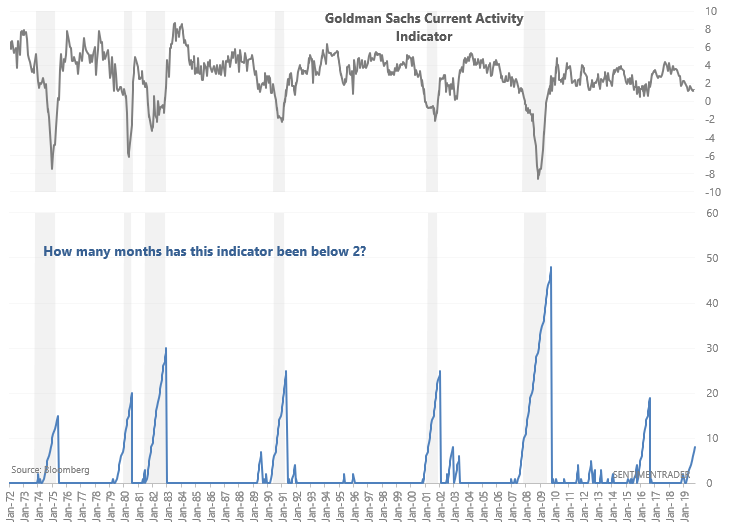
Since this usually occurred within the context of a recession, the S&P 500's returns over the next few months were mostly bearish. With that being said, I wouldn't put too much weight on this indicator, as housing is a more useful leading indicator than manufacturing. With housing trending higher right now, it's hard to make the case for a recession.