
Market overview: examining short term risks
With the U.S. stock market retreating a little bit this week from all-time highs, here's my market outlook:
- Long term risk:reward doesn’t favor bulls. Valuations are high, but valuations can remain high for years before stocks crash.
- Fundamentals (6-12 months): still bullish because there is no significant U.S. macro deterioration, but this could change IF macro data deteriorates significantly over the next few months
- Technicals (3-6 months): neutral/bullish
- Technicals (1-2 months): bearish
Fundamentals (6-12 months)
The economy and the stock market move in the same direction in the long term. Hence, leading economic indicators are also long term leading indicators for the stock market.
Overall, there is no significant U.S. economic deterioration right now. This is bullish for the stock market on a 6-12 month time frame. The main weak points in U.S. macro revolve around trade, manufacturing, and the yield curve. For more details and charts, please see my weekly fundamentals post.
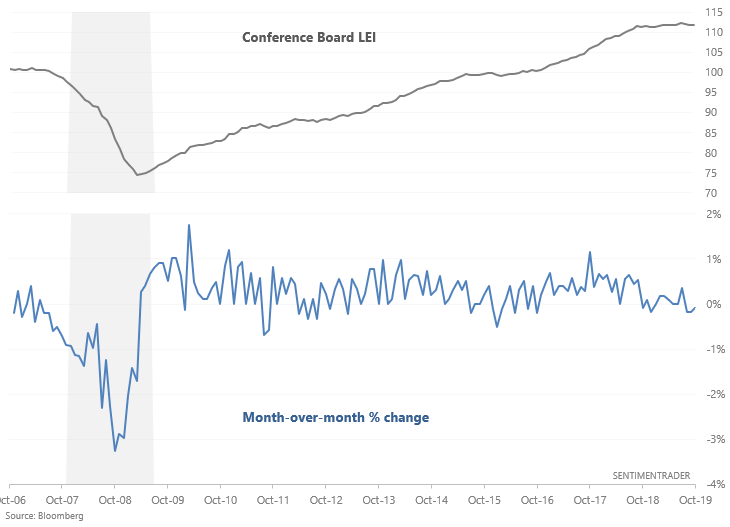
With that being said, I noted on Friday that the Conference Board LEI is now in a downtrend:
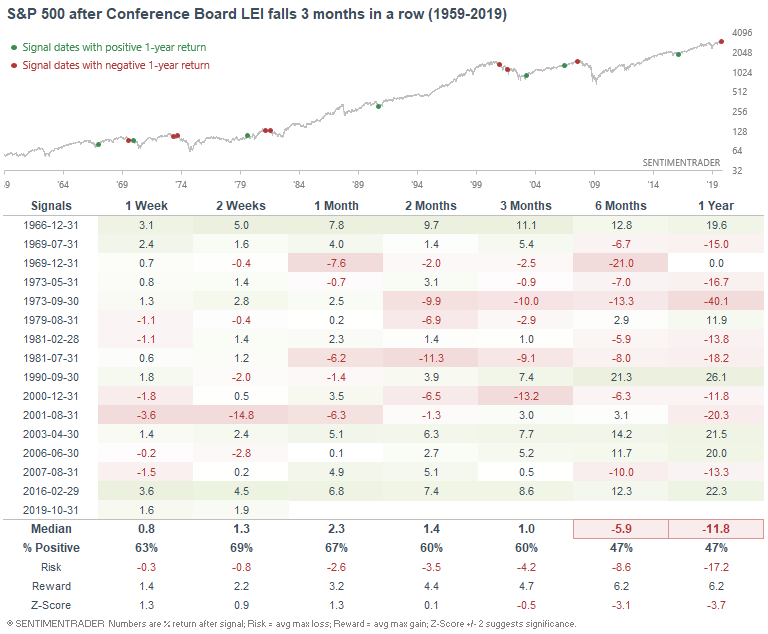
This is a bearish sign for stocks, with 6-12 month forward returns being worse than random:
*The Conference Board LEI is much weaker than the Macro Index right now because the LEI relies more on manufacturing data, whereas the Macro Index relies more on housing data. Housing is typically a more accurate leading indicator than manufacturing. This important distinction is why using the Macro Index yields higher returns in historical models than using the Conference Board LEI.
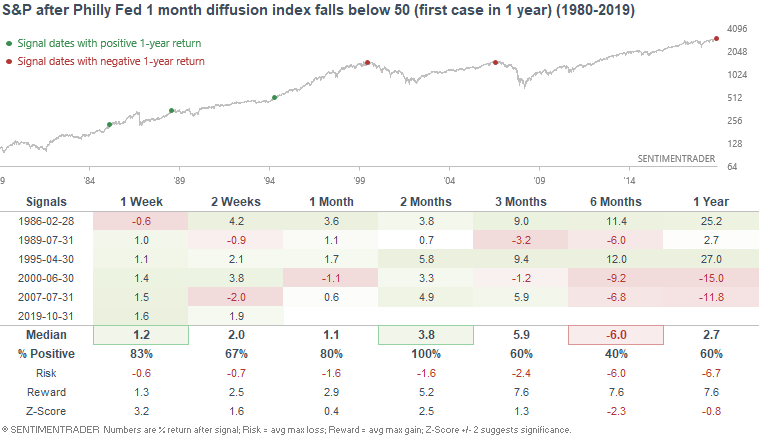
Meanwhile, the Philly Fed State Coincident Index (which I looked at in August) continues to weaken, with the 1 month diffusion index at 46. This index looks at whether individual states' economies are improving or deteriorating:
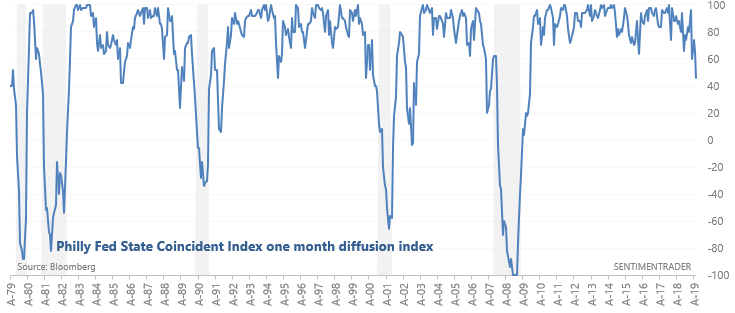
The last 2 times this happened were 2000 and 2007, just before stocks crashed and the U.S. economy entered into a recession. There were false signals (e.g. 1995), but overall this wasn't great for stocks.
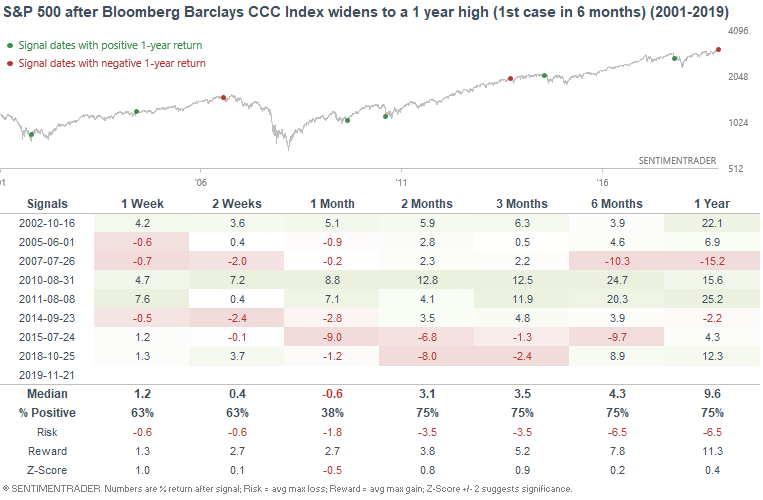
And lastly, high yield spreads continue to widen despite the recent highs in stocks. This is something that I looked at a few months ago, and Bloomberg TV once again mentioned:
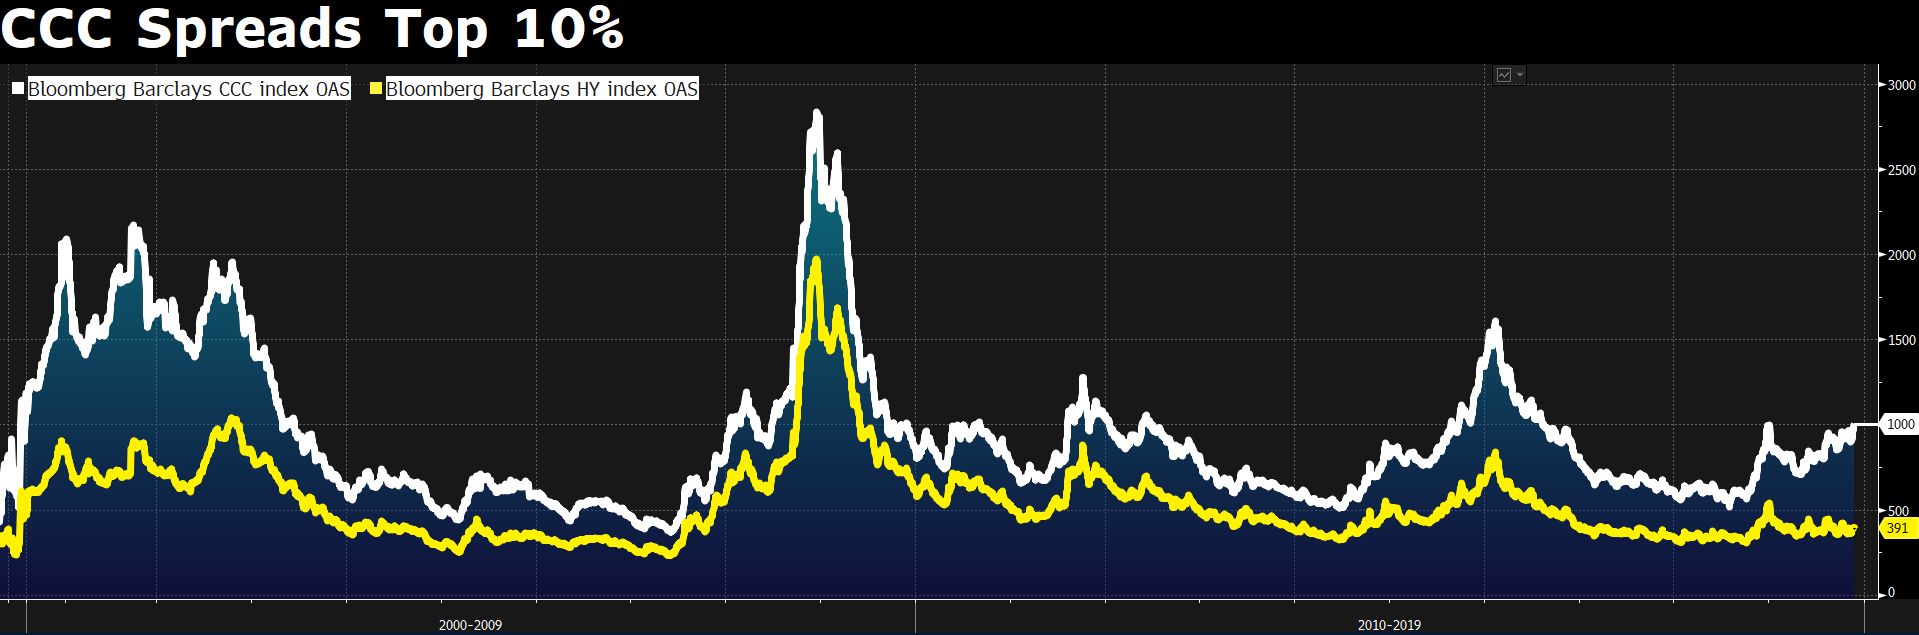
Overall, stock market investors should watch out in case spreads continue to widen. Spreads widened before stocks tanked in late-2018, 2015, 2007, and 2000. While this isn't an extremely bearish factor for the stock market, investors should watch out in case this worsens:
Technicals (3-6 months)
The majority of our stats suggest that the stock market's 3-6 month outlook is bullish, although there are some bearish stats as well. Let's start with the bullish stats, and then we'll look at the bearish ones.
Bullish:
Momentum
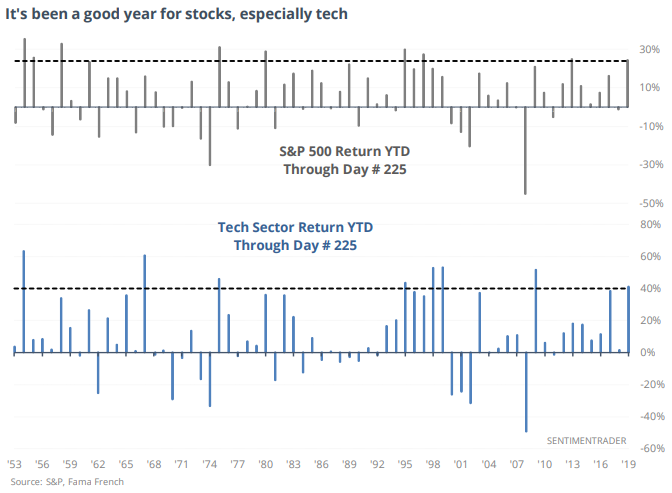
As Jason noted on Wednesday, tech stocks have surged this year. Such strong rallies usually cause contrarians to think "this is too much, too fast, so better watch out". And it is typically true in the short term. Massive rallies do not continue nonstop, and typically feature breaks inbetween:
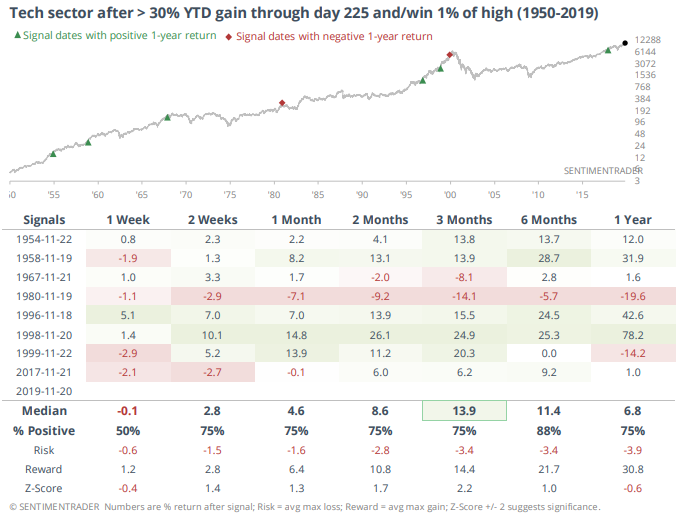
But from a longer term perspective, momentum usually persists. Major tops (at least for the broader S&P 500) typically see more of a "rolling over" pattern, in which the market's rally slows down before it stops. As you can see from the following table, tech stocks usually continue to rally over the next 6 months after a massive rally:
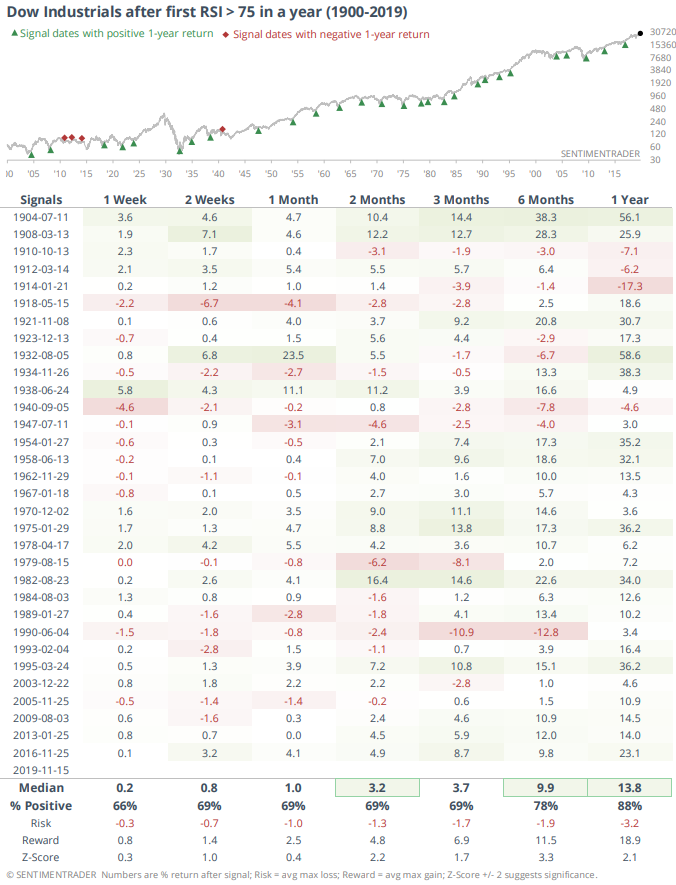
In a similar vein, the Dow's momentum broke out to a new 1 year high recently:
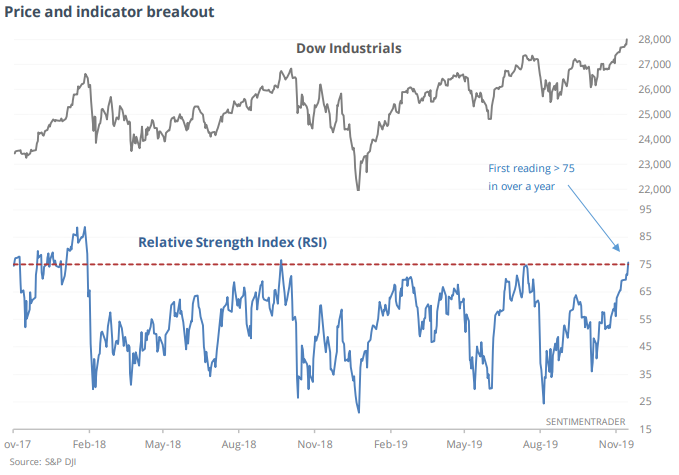
As Jason noted on Monday, such breakouts in momentum may not necessarily be bullish in the short term, but were usually bullish for stocks over the next year:
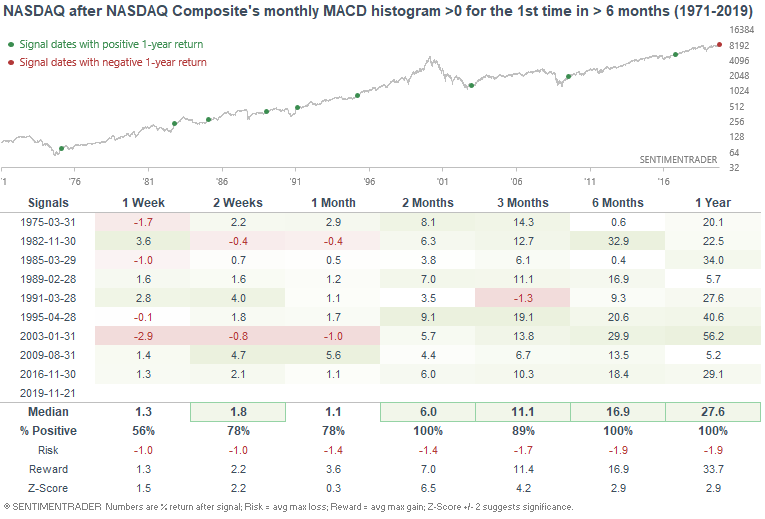
And lastly, I noted on Friday that the NASDAQ Composite's MACD histogram is about to turn positive at the end of November:
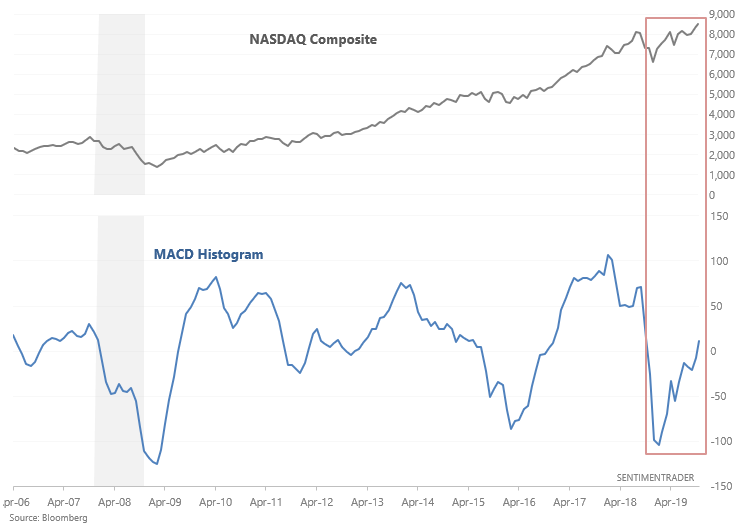
This has been quite bullish for stocks on a 6-12 month forward time frame:
Neutral/bearish:
Volatility
As the WSJ and plenty of others have noted, volatility remains extremely low and compressed. For example, VIX's standard deviation as a % of its value is at the lowest since late-2017:
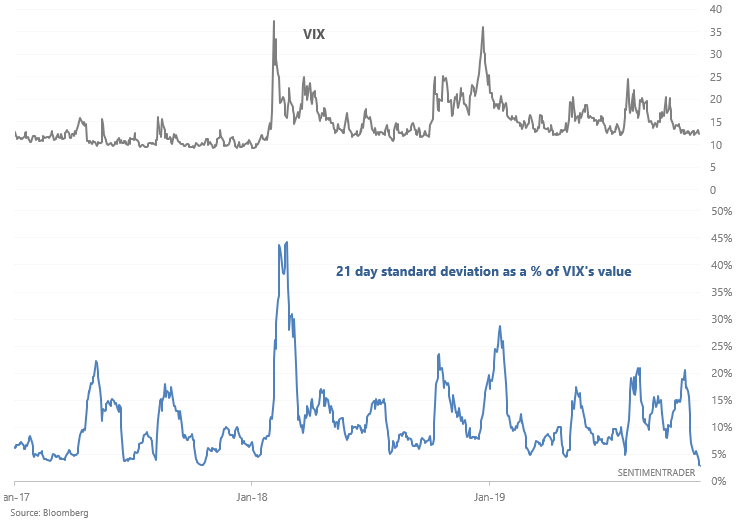
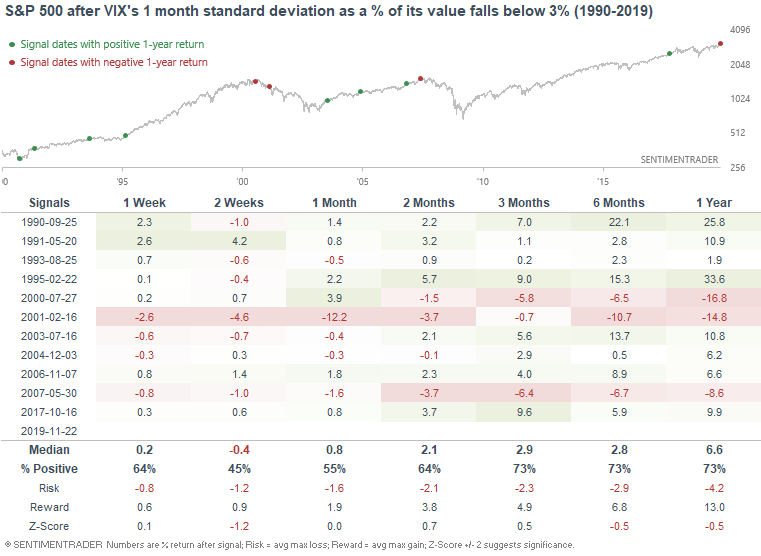
When VIX's standard deviations were this low (below 3%), the S&P 500 sometimes suffered over the next 2 weeks:
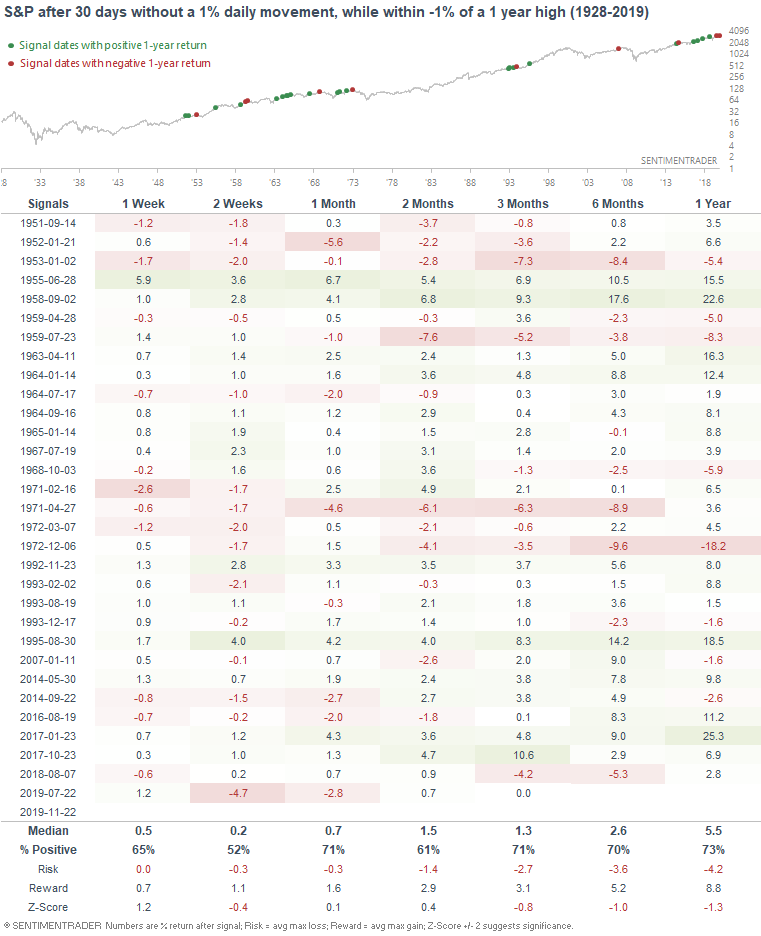
However, I would like to caution traders into thinking that betting on an explosion in volatility is a sure thing. I.e. we know that volatility will "eventually" spike, but we don't know when. For example, the S&P 500 has gone 30 days without a 1% daily movement. When this occurred near a 1 year high, you would think that stocks typically fell immediately in the short term and volatility spiked. But this wasn't always the case:
Breadth
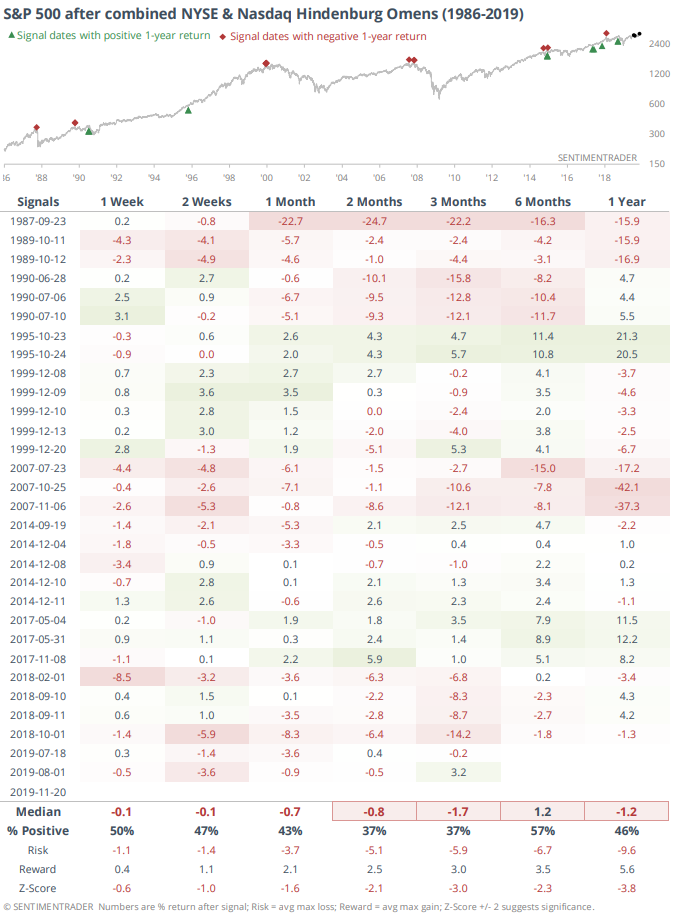
As Jason mentioned on Thursday, Hindenburg Omen and Titanic Syndrome signals keep triggering on the NYSE and NASDAQ Composite, representing a split market:
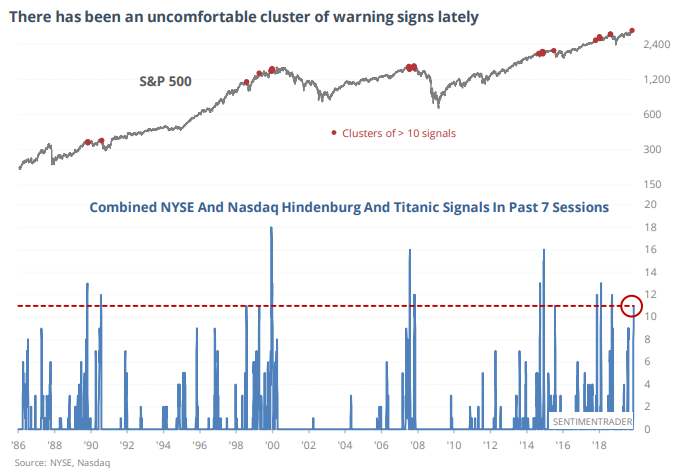
When this happened in the past, the stock market's returns were weak, particularly over the next 2-3 months:
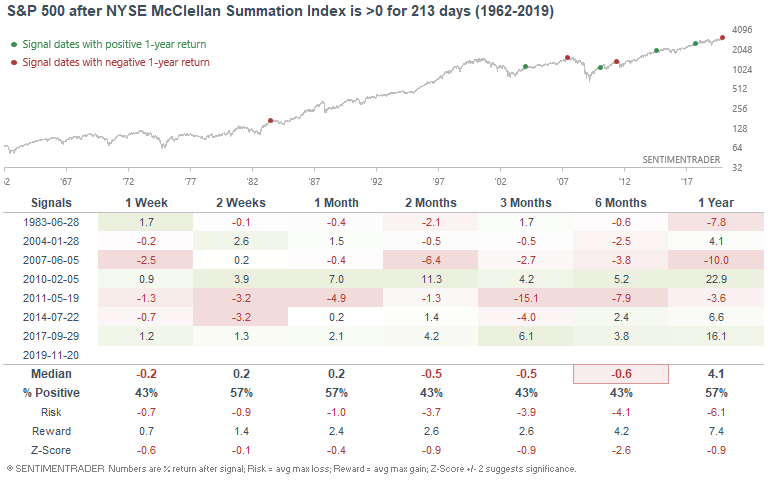
Moreover, I demonstrated on Thursday that long term breadth has been positive for an extremely long time...
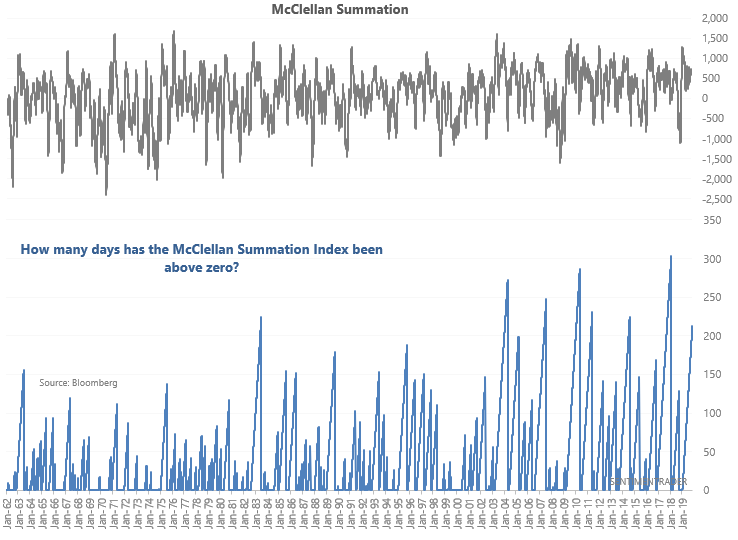
...which typically hasn't been good for stocks over the next few months:
Sentiment
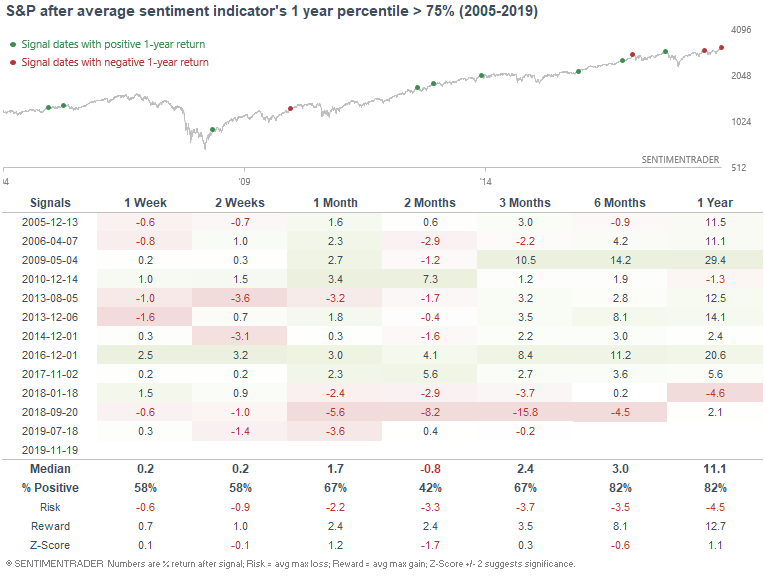
Our various sentiment studies over the past few weeks have demonstrated excessive optimism, which isn't good for stocks on a 1-3 month forward basis. As I mentioned on Wednesday, an aggregate of various sentiment indicators is extremely high....
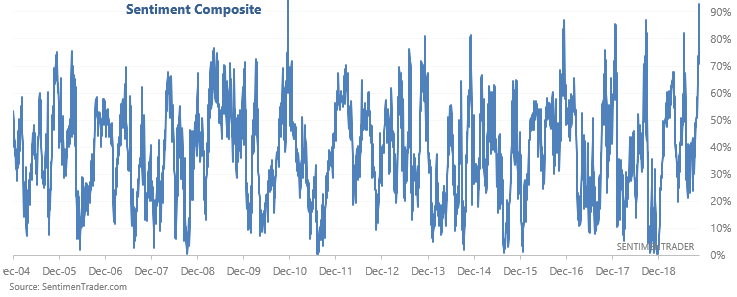
...which hasn't been great for stocks on a 2 month forward basis:
To recap
- Long term risk:reward doesn’t favor bulls.
- Fundamentals (6-12 months): still bullish because there is no significant U.S. macro deterioration.
- Technicals (3-6 months): neutral/bullish
- Technicals (1-2 months): bearish
Got any questions? Feel free to contact me at [email protected]