What I'm looking at - LEI, sentiment pullback, low volatility stocks, NASDAQ, Index Put/Call
Here's what I'm looking at:
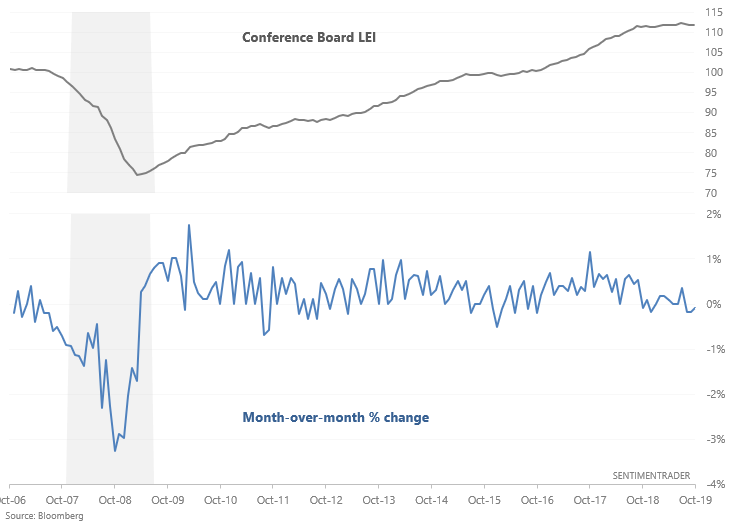
Conference Board LEI
The latest Conference Board LEI reading was released, and the LEI has fallen month-over-month for the 3rd month in a row. The LEI continues to be weighed down by manufacturing.
This isn't a particularly good long term sign for stocks. When the LEI fell 3 months in the past, it sometimes occurred near recessions and bear markets. Hence why the S&P's 6-12 month forward returns were more bearish than random:
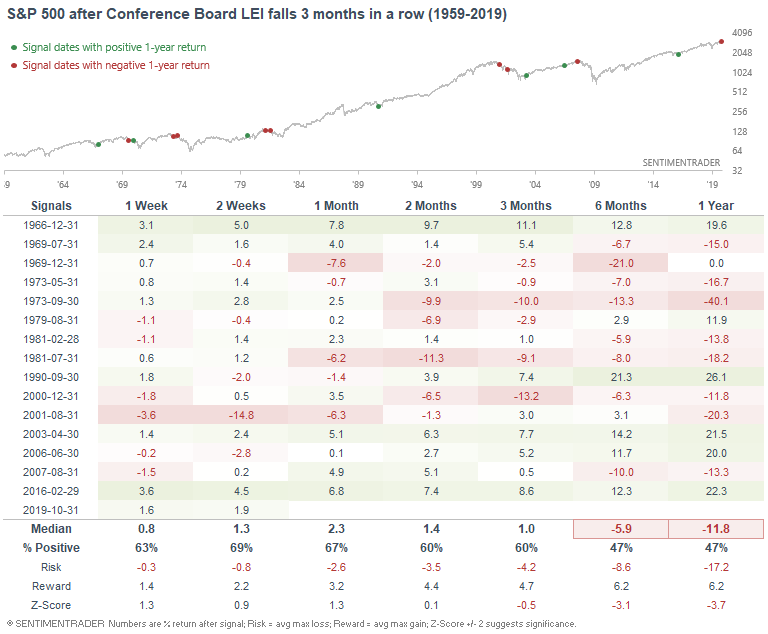
Of course, there were also plenty of false signals (e.g. February 2016). Hence why we should take things day-by-day. (I.e. this does not mean that we are in a recession, or that a recession is on a horizon, but the POTENTIAL for a recession is higher than normal). If you want to know why a recession is unlikely next year, I highly suggest you listen to Bill McBride's presentation (his segment starts at 32 minutes).
With that being said, the Conference Board LEI Model has turned bearish now that the Conference Board LEI's 6 month moving average is going down.
Sentiment pullback
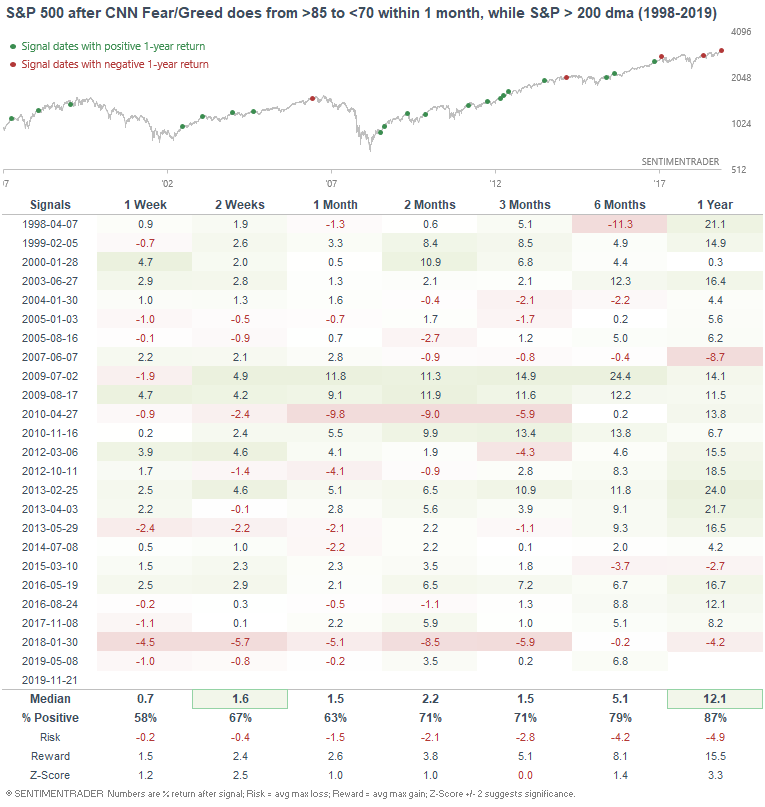
After falling over the past few days, our CNN Fear/Greed Proxy has dipped below 70:
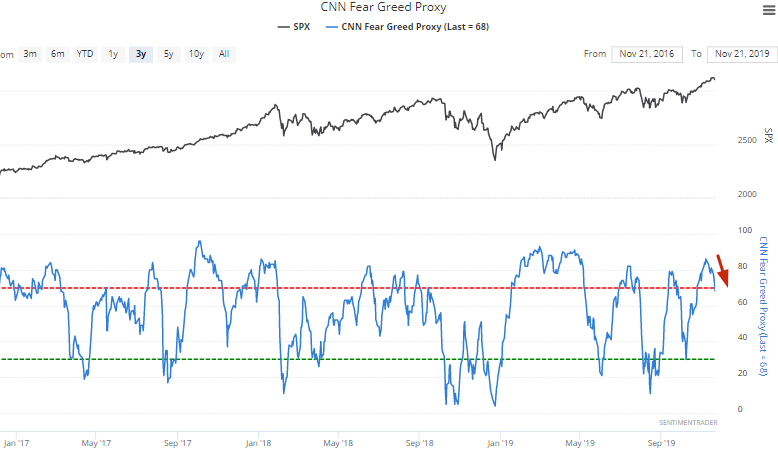
When sentiment reaches an optimism extreme and starts to pullback, the stock market's decline over the short term (e.g. 2 weeks) tends to be muted. Moreover, the S&P's returns over the next year are more bullish than random, primarily because extremely optimistic sentiment may cause short term pullbacks/corrections, but it tends to occur during a long term uptrend:
Low vol
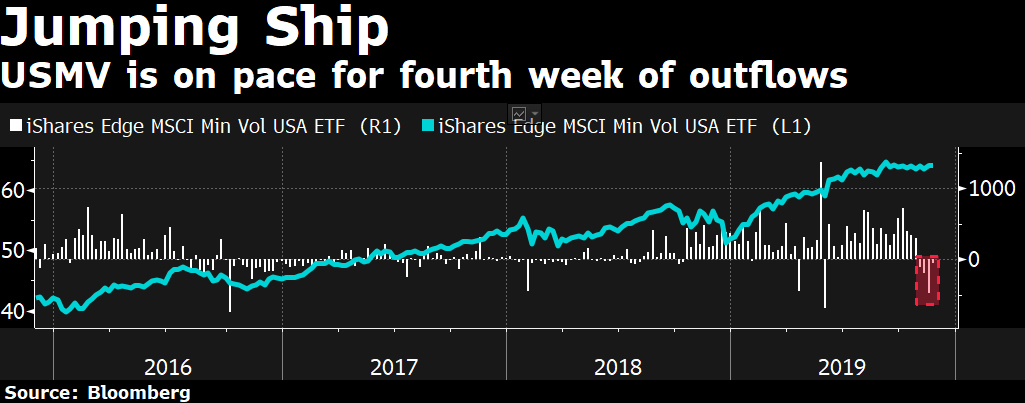
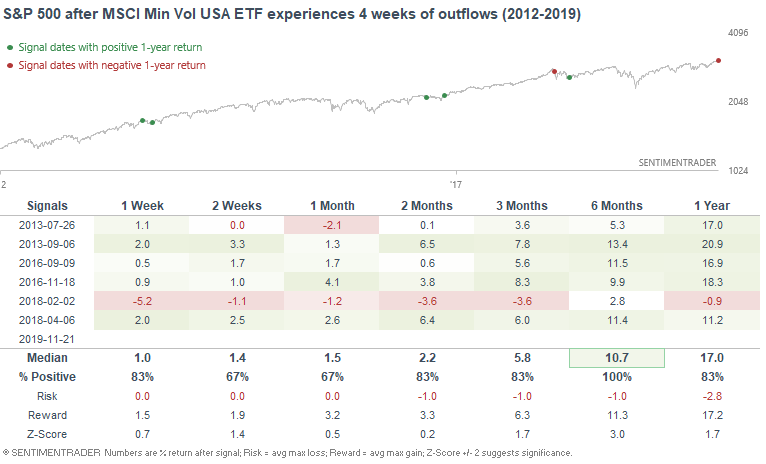
Bloomberg TV had an interesting chart that looked at the relative weakness in low volatility stocks over the past few weeks as investors shifted away from defensive assets and towards more cyclical assets. The MSCI Min Volatility USA ETF is on pace for 4 weeks of outflows:
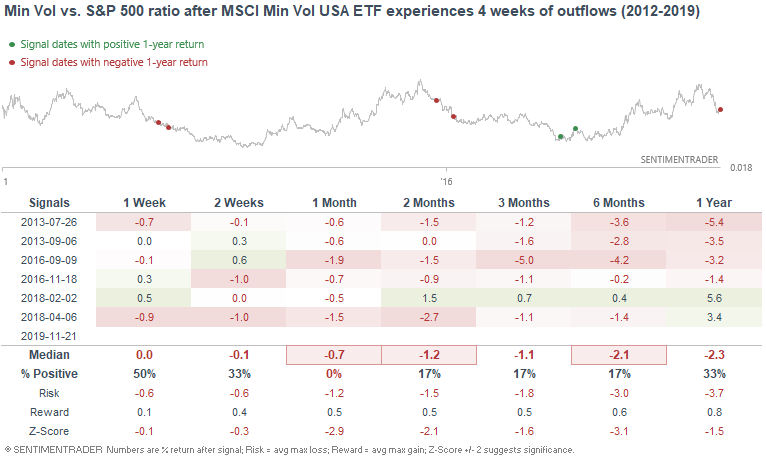
When this happened in the past, low volatility stocks typically continued to underperform the broad S&P 500 over the next few months:
*Data is limited from 2011 - present:
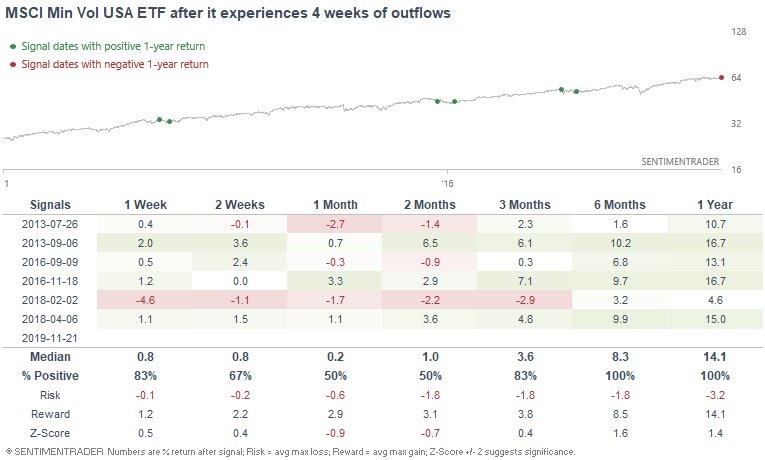
Here's what the MSCI Min Vol USA ETF did next:
Here's what the S&P 500 did next:
NASDAQ Composite's long term trend
Over the past few months, various indices' monthly MACD histograms have turned positive. I've demonstrated that this typically marks the beginning of a big rally in stocks over the next 1-2 years. Barring a significant decline over the next week, the NASDAQ Composite's monthly MACD histogram will also turn positive for the first time in 12 months as of November's close:
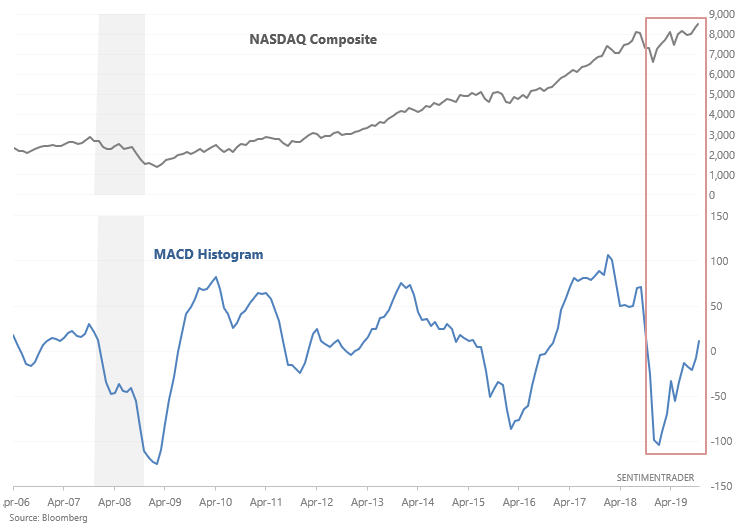
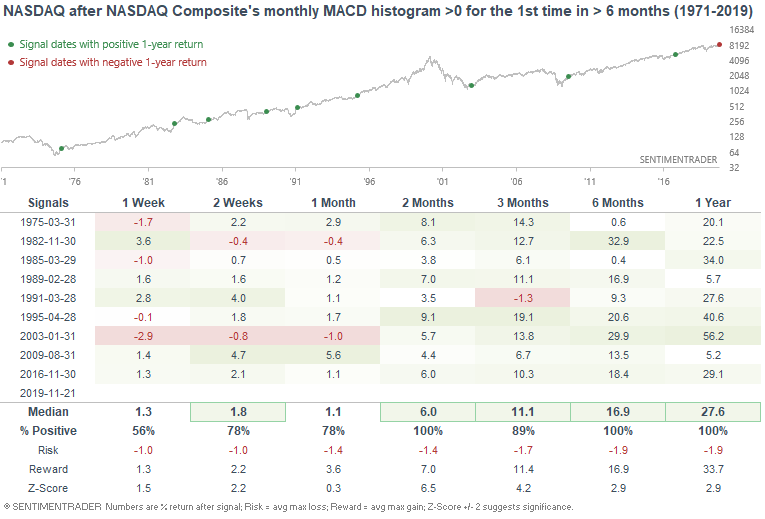
When the MACD histogram turned positive for the first time in more than 6 months, the NASDAQ Composite typically surged over the next 6-12 months:
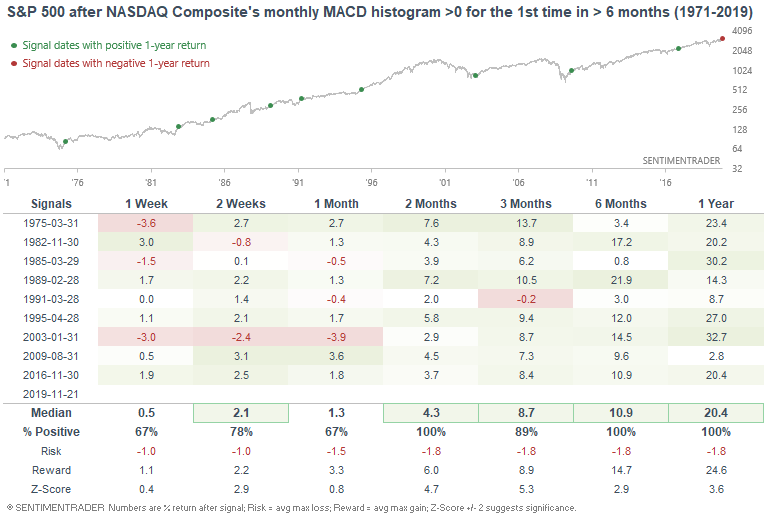
Here's what the S&P 500 did next:
*Keep in mind that this study will not be triggered until November is over.
Index Put/Call
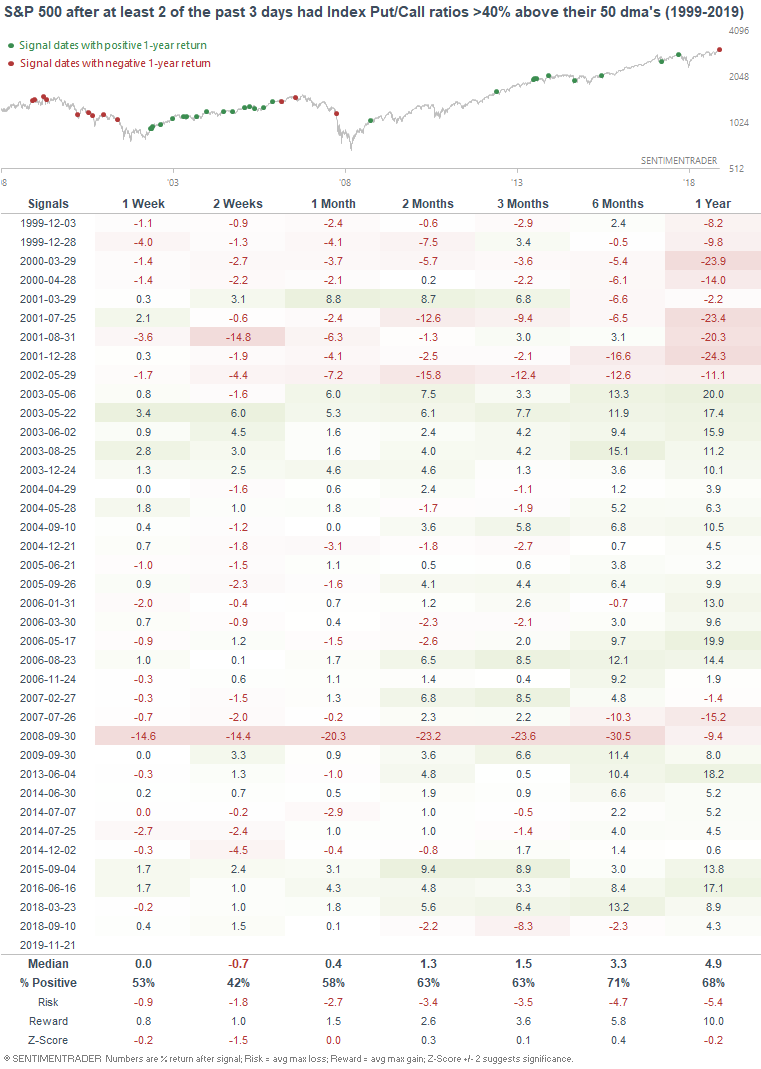
And lastly, the Index Put/Call ratio spiked again (after Tuesday's spikes):
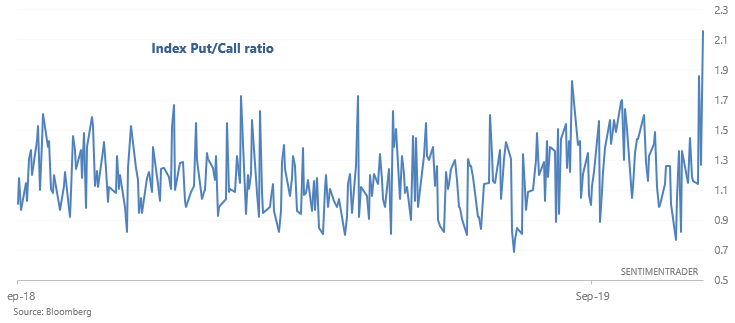
When the Index Put/Call ratio spiked at least twice in the past 3 days,the S&P's returns over the next 2 weeks were weak: