
What I'm looking at - economic conditions, German manufacturing, Equity Put/Call, New Highs & Lows, Dollar vs. Gold
With the stock market still volatile on a day-to-day basis, here's what I'm looking at:
Economic Conditions
The University of Michigan publishes a Current Economic Conditions Index that asks consumers how they view current economic conditions in the country. The survey includes more than 500 households (not a huge sample size), but the data series itself is not incredibly noisy (as is the case with many sentiment-based economic indicators). As you can see in the chart below, most economic expansions coincide with a Current Economic Conditions Index that's either flat or trending upwards.
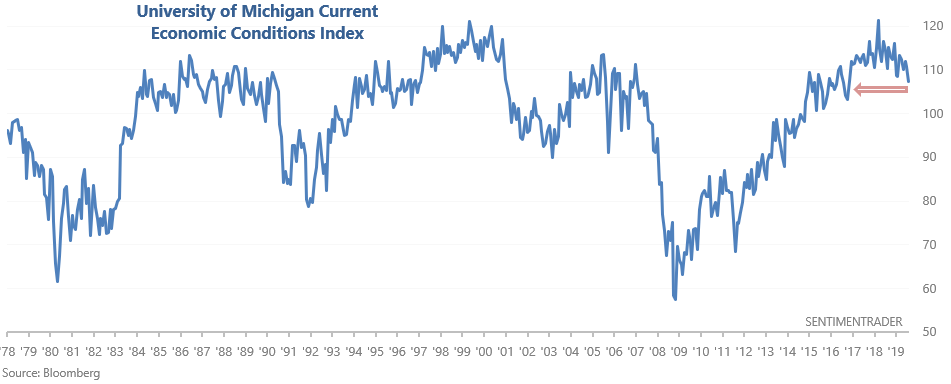
This index has now fallen to the lowest level in more than 30 months. When this happened in the past, there were a few long term warning signs (along with a few false signals).
1. December 1989: occurred half a year before a -20% stock market decline and recession
2. December 2000: just as a bear market and recession were about to begin
3. December 2007: we all know what happened in 2008....
Overall, there are some real things to be concerned about in the economy (e.g. manufacturing weakness, housing weakness, trade war). These concerns aren't as nonsensical as others we have seen over the past 10 years, e.g. "Ebola scare".
German manufacturing
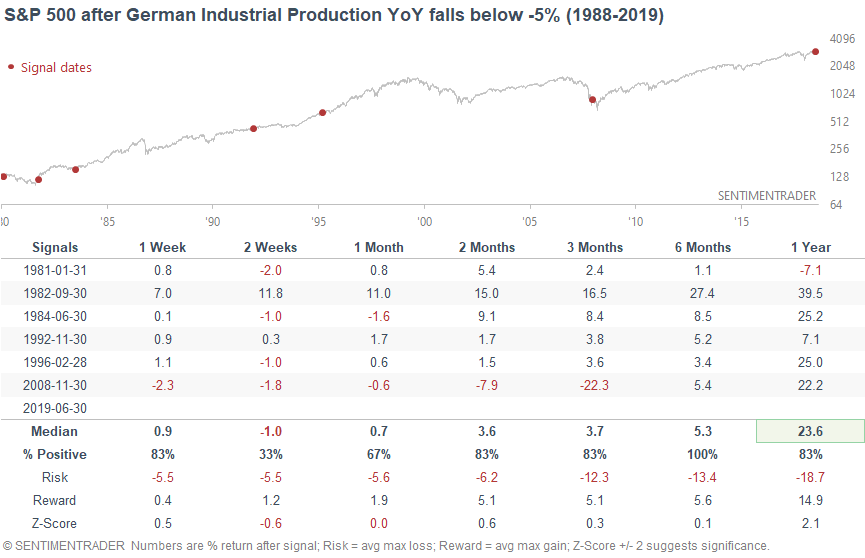
Speaking of manufacturing weakness, Germany's latest industrial production data is weak. Very weak. Here's the DAX vs. German Industrial Production's year-over-year % change, which has sunk to -5%. The last time German Industrial Production was this weak was during the 2008-2009 recession.
*Manufacturing is a very important segment of the German economy, which is more export-oriented than the U.S. economy.
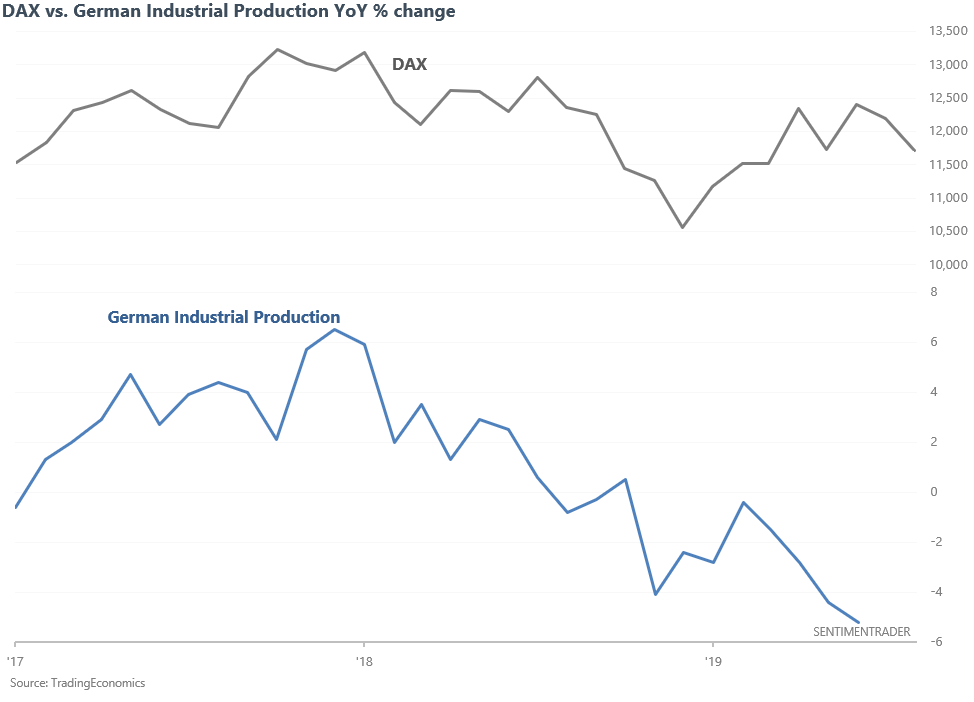
When most people see headlines such as "German Industrial Production is the weakest since 2008!!!", they imagine another mega-crash in the making. However, economic indicators like year-over-year Industrial Production are typically lagging indicators. By the time things are this bad, it hasn't been a consistent negative for stocks going forward, especially over the next year.
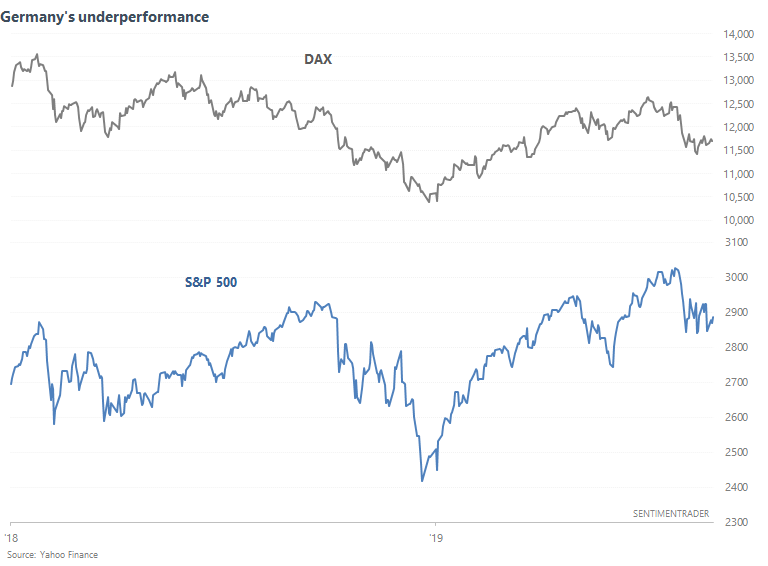
And in case you're wondering, here's what happened next to the S&P 500.
Equity Put/Call
With the stock market bouncing over the past 2 days, the Equity Put/Call ratio has collapsed.
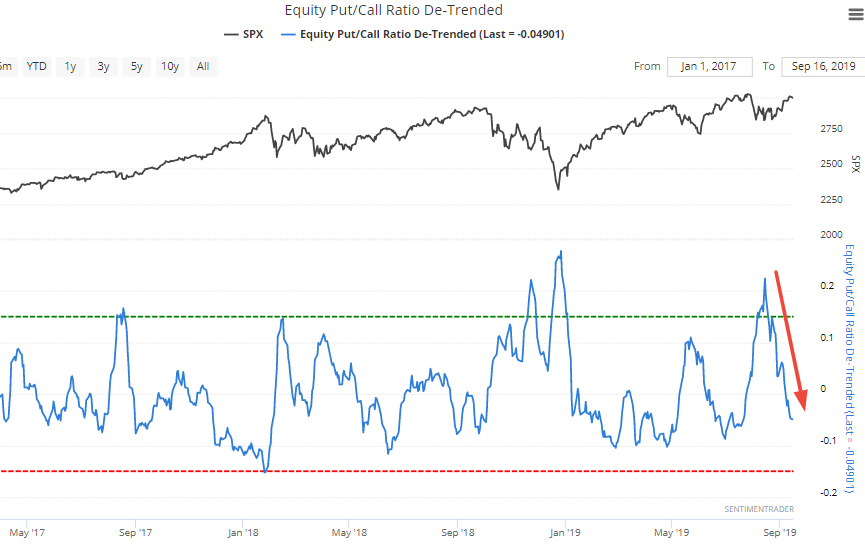
Choppy environments like this don't always immediately lead to a rally. But more often than not, this is a good sign for stocks over the next 3-6 months. Here's what happened next to the S&P when the Equity Put/Call falls more than -40% in 2 days, while the S&P is close to a 52 week high.
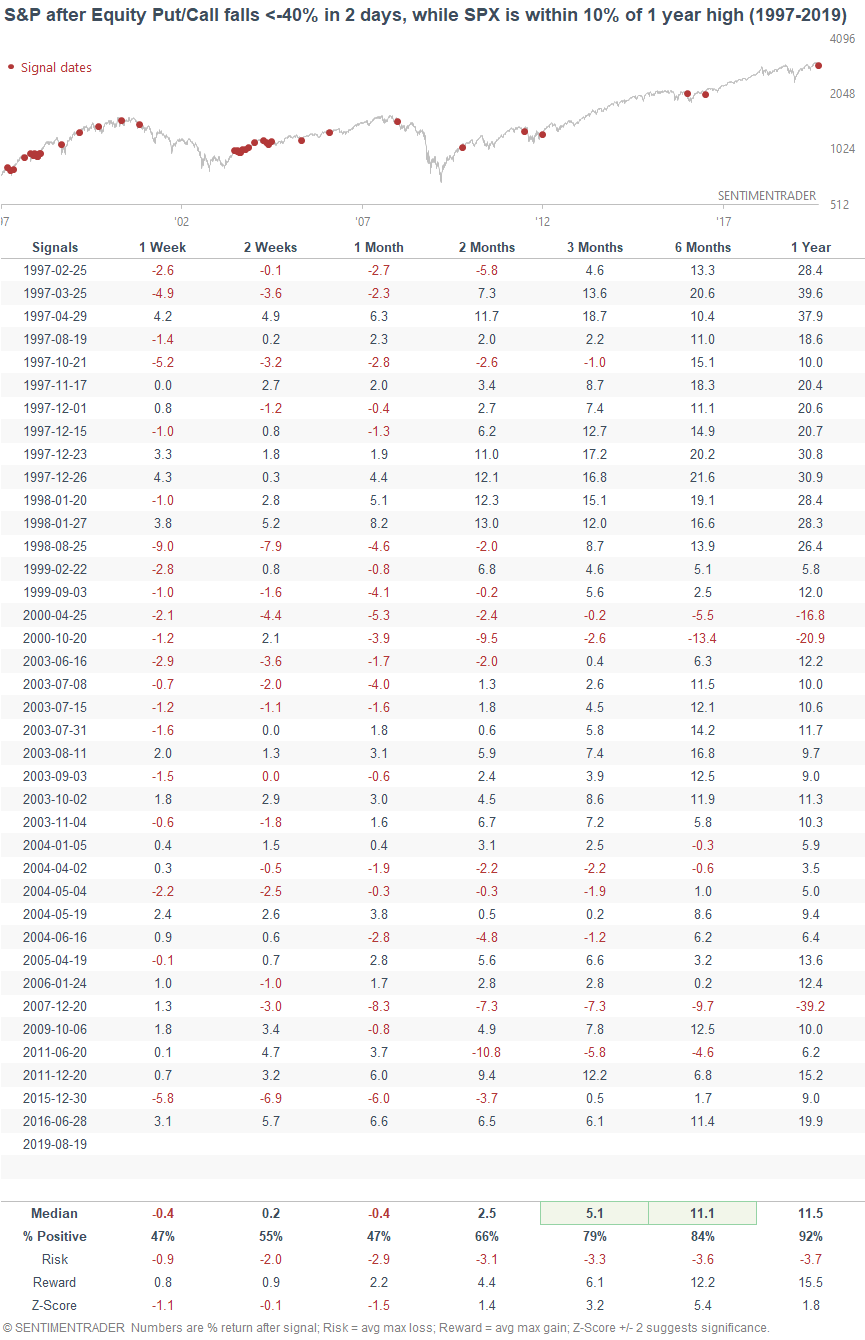
Bullish approximately 80% of the time 3-6 months later.
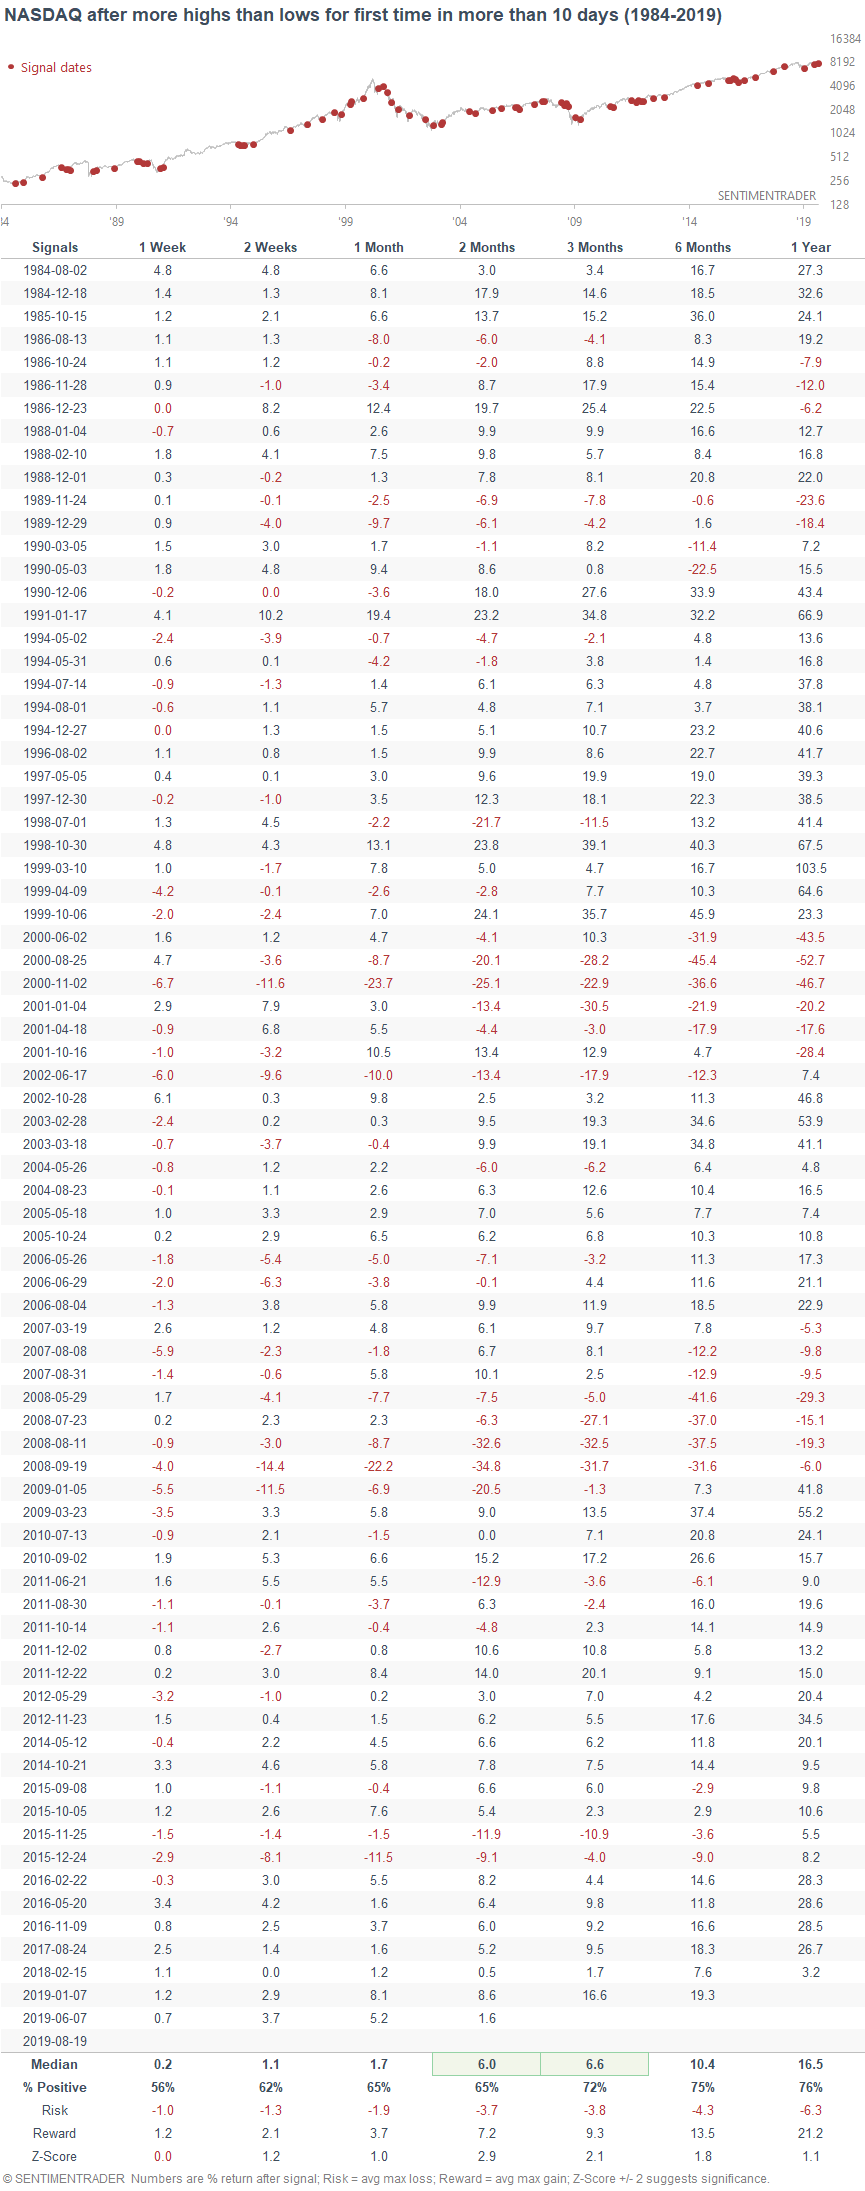
New highs
As Helene Meisler noted, the NASDAQ made more highs than lows for the first time in more than 2 weeks. Our NASDAQ High/Low ratio calculates the # of issues making new 52 week highs, divided by the total # of issues making 52 week highs and lows. This ratio has now crossed 50.
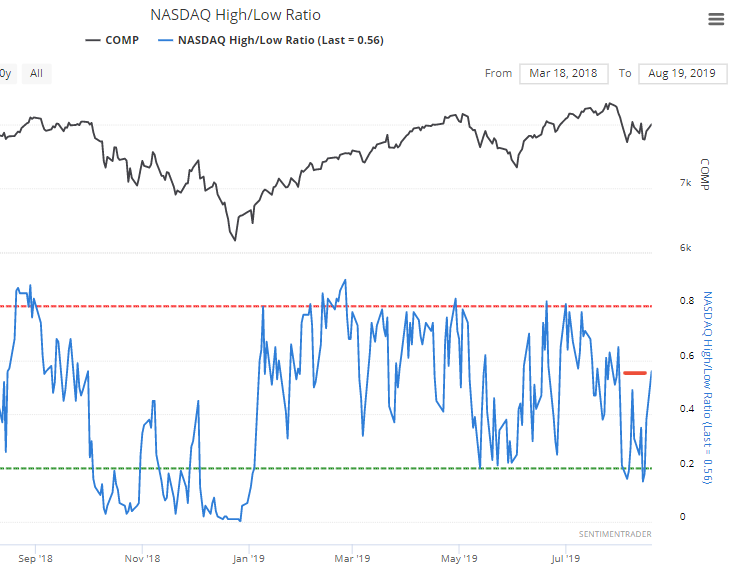
As one would expect, an improvement in breadth is slightly positive for the NASDAQ over the next 2-3 months.
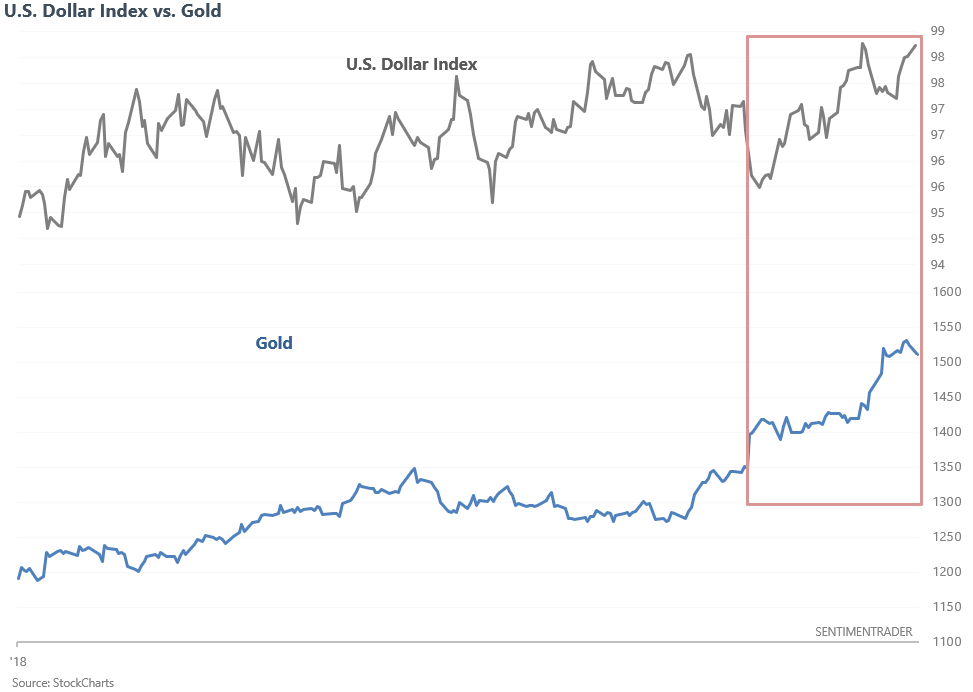
USD and gold
And lastly, the U.S. Dollar Index has held up pretty well during gold's recent rally. This is uncommon. While the dollar isn't always inversely correlated with gold, strong gold rallies are usually accompanied by USD weakness.
The USD and gold's 50 day correlation now exceeds 0.48 (moderately positive correlation). When the USD and gold were positively correlated in the past, the USD's forward returns over the next 3 months weren't great. (Interestingly enough, this wasn't bullish for gold either).
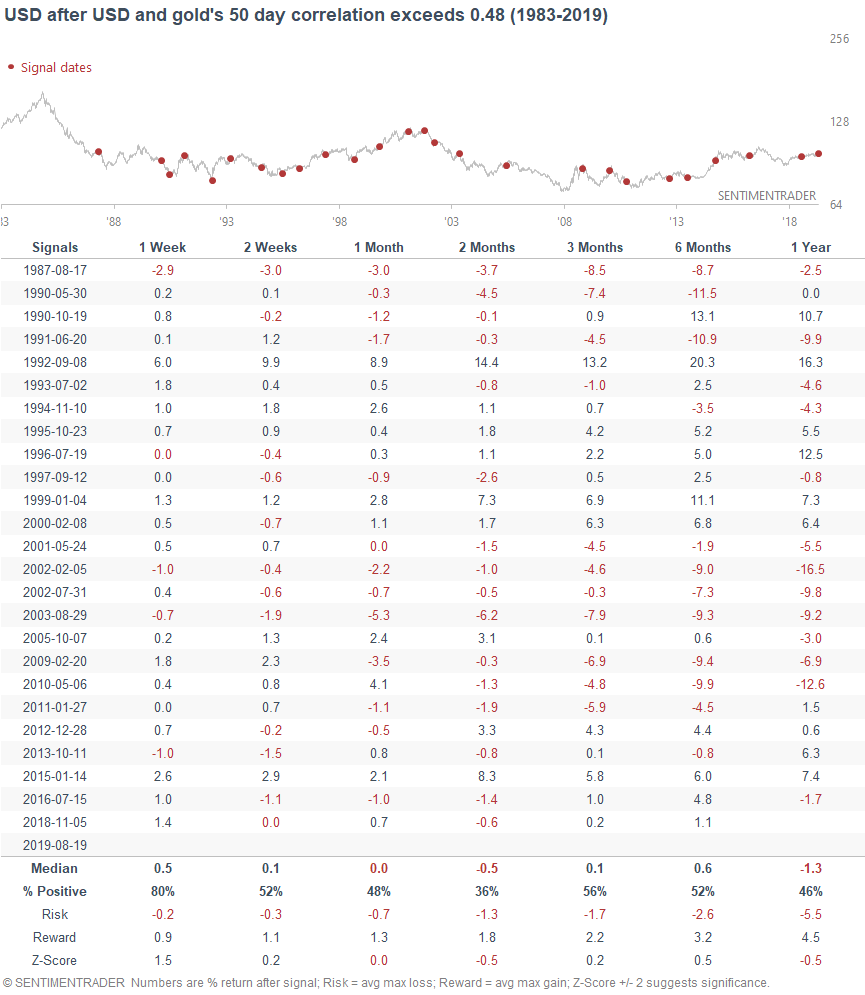
If I had to guess, trade war uncertainty is driving both the dollar and gold. If trade war uncertainty diminishes, will the USD and gold both go down? I don't know. Overall, I don't see much value in trying to guess the news. Trading by guessing the news is mostly a 50/50 bet.
Conclusion
And lastly, just to repeat what I wrote in my weekly market overview for the U.S. stock market:
- Technicals (1-2 months): no clear edge in either direction. If I had to guess, I think there’s a 60% chance that the S&P makes new lows. Not decisive.
- Technicals (3-6 months): mostly bullish.
- Technicals (6-12 months): mostly bullish.
- Fundamentals (6-12 months): no significant U.S. macro deterioration (this could change as we get more data).
- Long term risk:reward doesn’t favor bulls.