
Market overview: combining technicals & fundamentals
I usually write an overview of the markets each week that combines the technical & fundamental indicators I look at:
- Technicals (1-2 months): no clear edge in either direction. If I had to guess, I think there’s a 60% chance that the S&P makes new lows. Not decisive.
- Technicals (3-6 months): mostly bullish.
- Technicals (6-12 months): mostly bullish.
- Fundamentals (6-12 months): no significant U.S. macro deterioration (this could change as we get more data).
- Long term risk:reward doesn’t favor bulls.
Technicals (3-6 months)
I’ll cover a bunch of indicators in this section, so I’ll fly through the ones that we’ve already examined this week.
The stock market is usually hard to predict on a 1-2 month forward basis, unless there is an extreme. There are a few extremes right now, but these are not decisive. So let’s focus on a 3-6 month forward basis.
Sentiment
CNN Fear & Greed, a popular sentiment indicator, fell below 15 on Thursday.
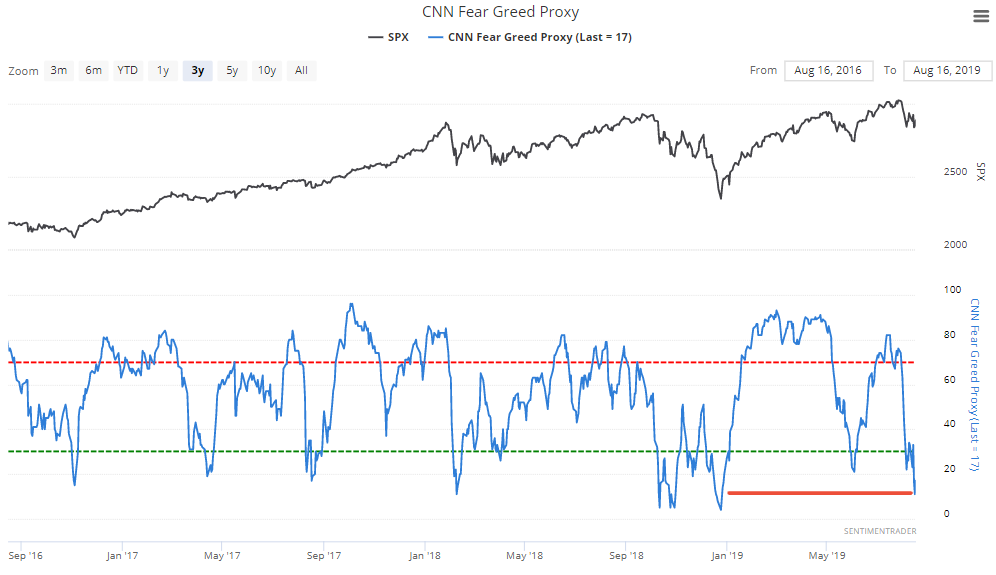
When this happened while the S&P was above its 200 day moving average (e.g. now), the S&P rallied 85% of the time 3 months later.
Breadth
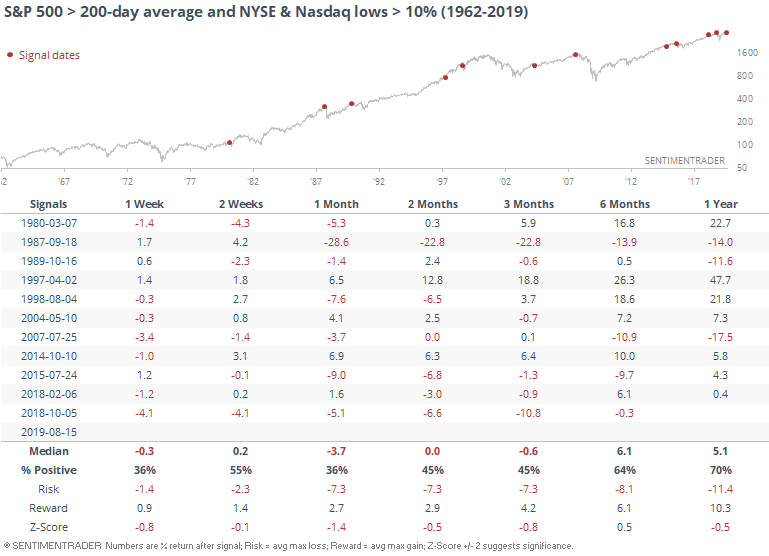
As Jason demonstrated on Thursday, 10% of issues on the NYSE and NASDAQ are at 52 week lows.
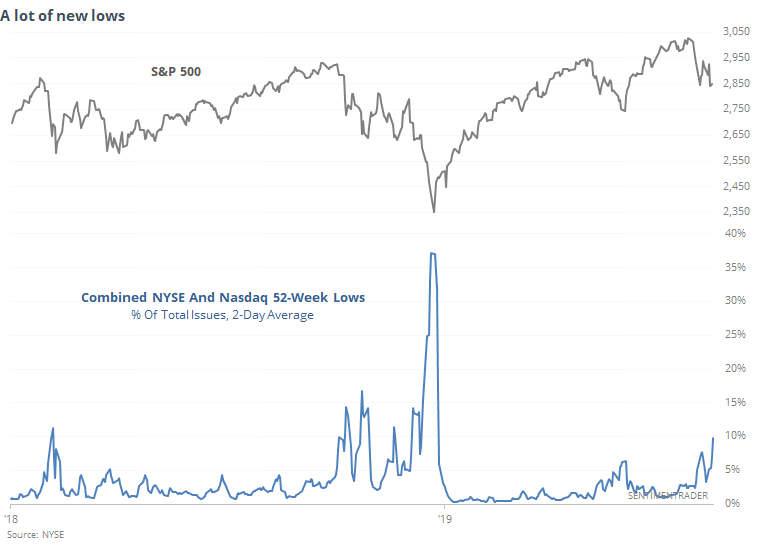
When this happened while the S&P was above its 200 dma, the S&P’s returns over the next month were weak.
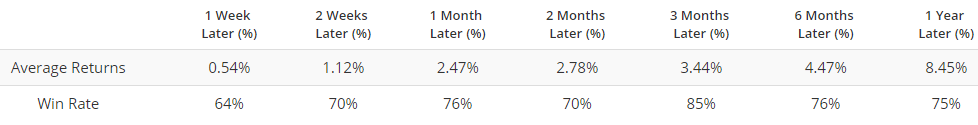
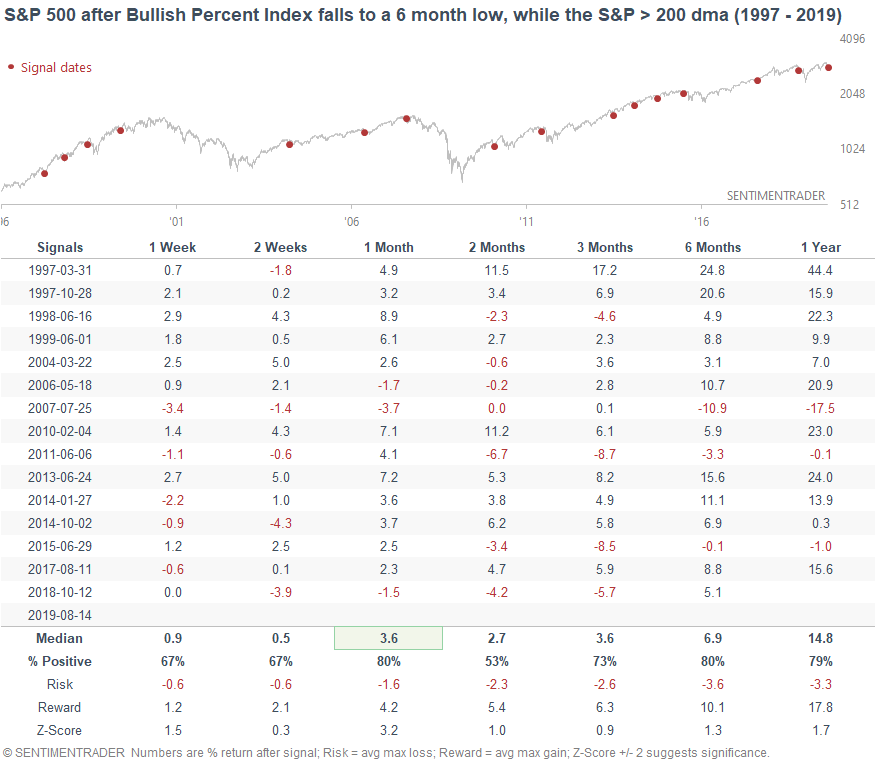
However, the stock market’s 1 month outlook is not decisively bearish. For example, the S&P 500 Bullish Percent Index suggests otherwise. This point & figure breadth indicator fell to a new 6 month low on Wednesday.
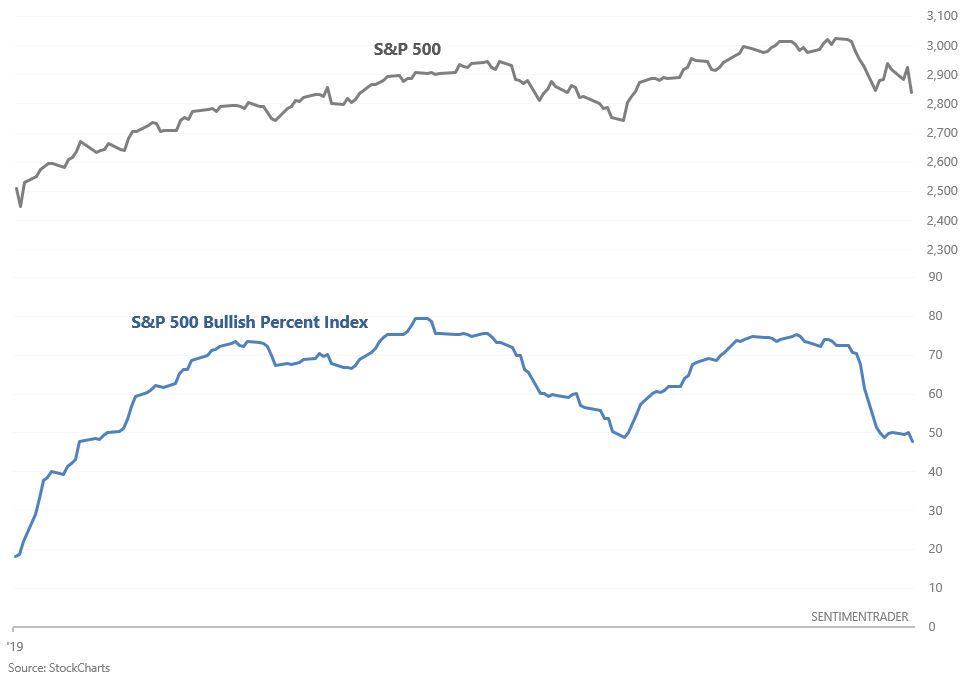
When this happened in the past, the S&P was mostly bullish over the next month.
As I said, I don’t see a clear edge over the next month.
Stocks and safe haven
With plenty of things to worry about, stocks have slumped recently and gold continues to rally. The S&P:gold ratio has fallen to its December 2018 low as market participants scramble to safe haven assets. The following chart demonstrates the connection between the S&P and the S&P:gold ratio.
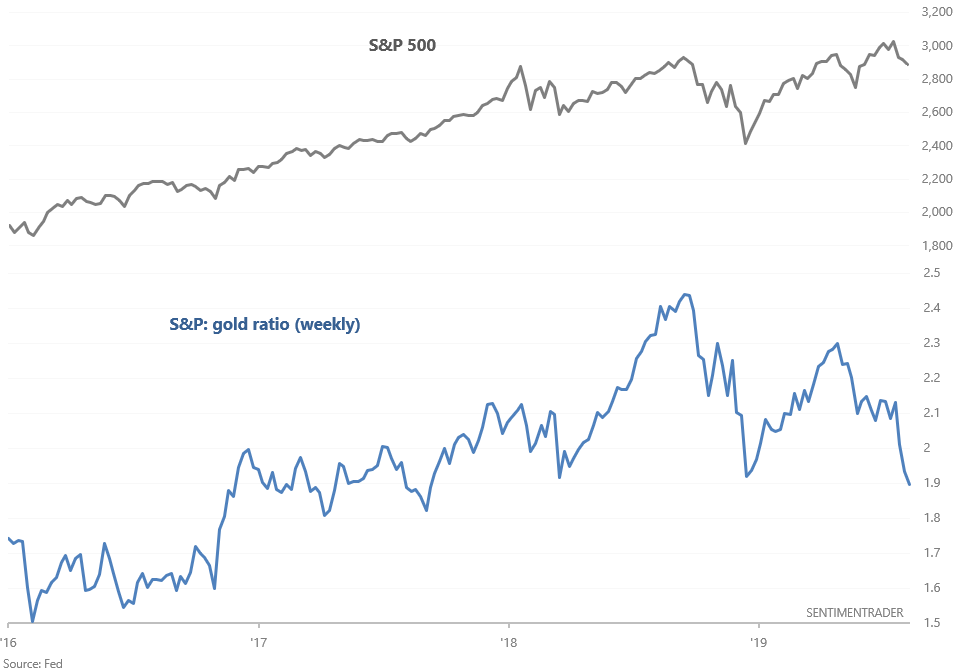
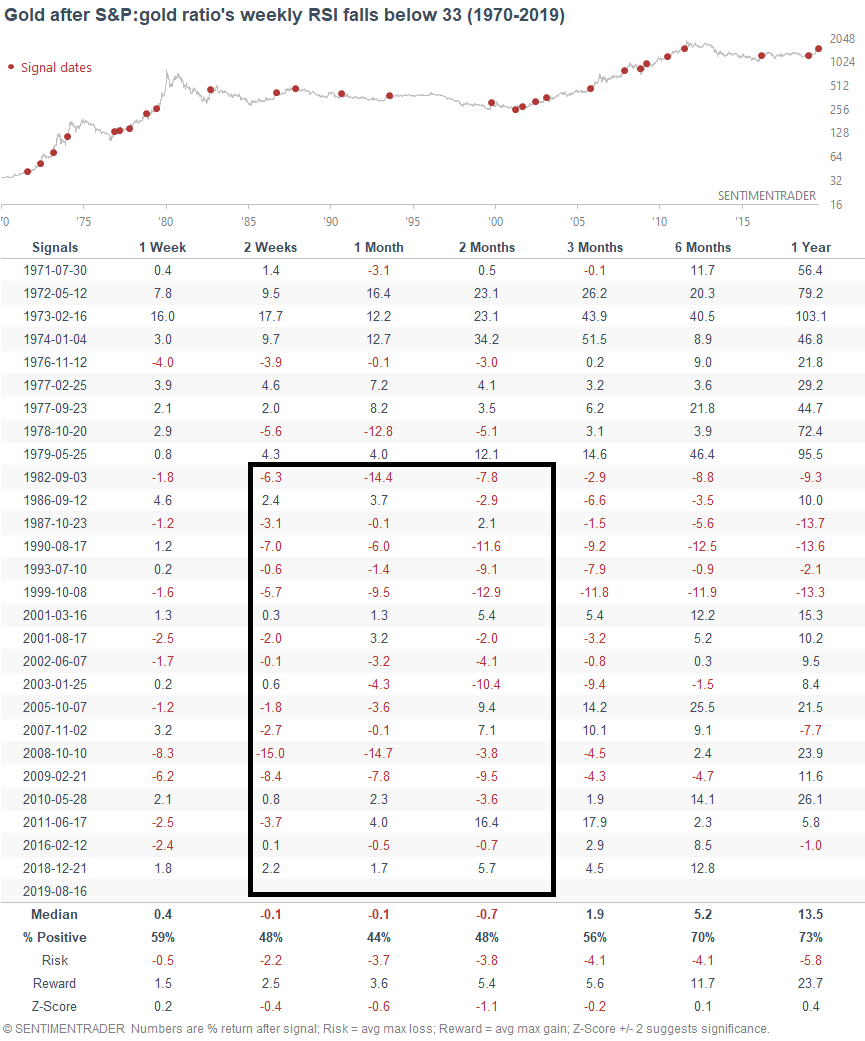
With the S&P:gold ratio falling, its weekly RSI (momentum) is now below 33. Once again, the last time this happened was at the December 2018 stock market bottom. But let’s look at all the historical cases to avoid recency bias.
When this happened in the past, the S&P often fell next week. With the market in a risk-off mood, it’s hard to know where the exact bottom is.
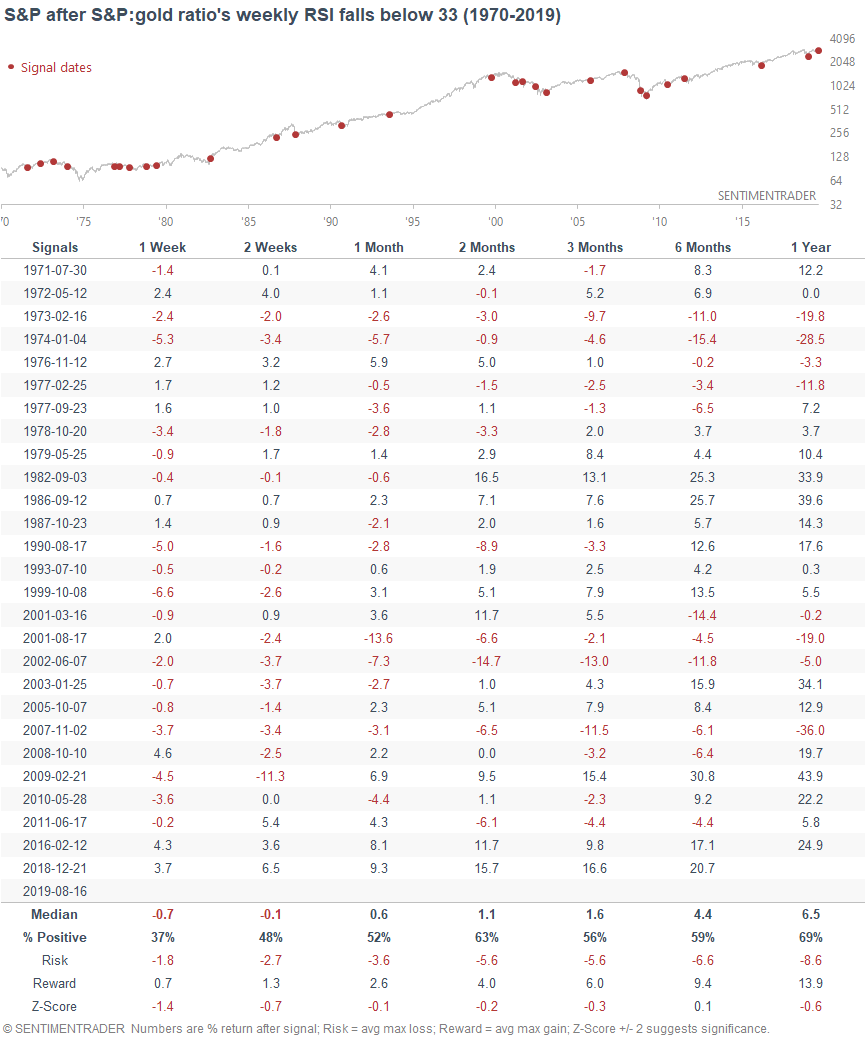
At the same time, this wasn’t good for gold over the next few weeks & months, especially over the past 40 years.
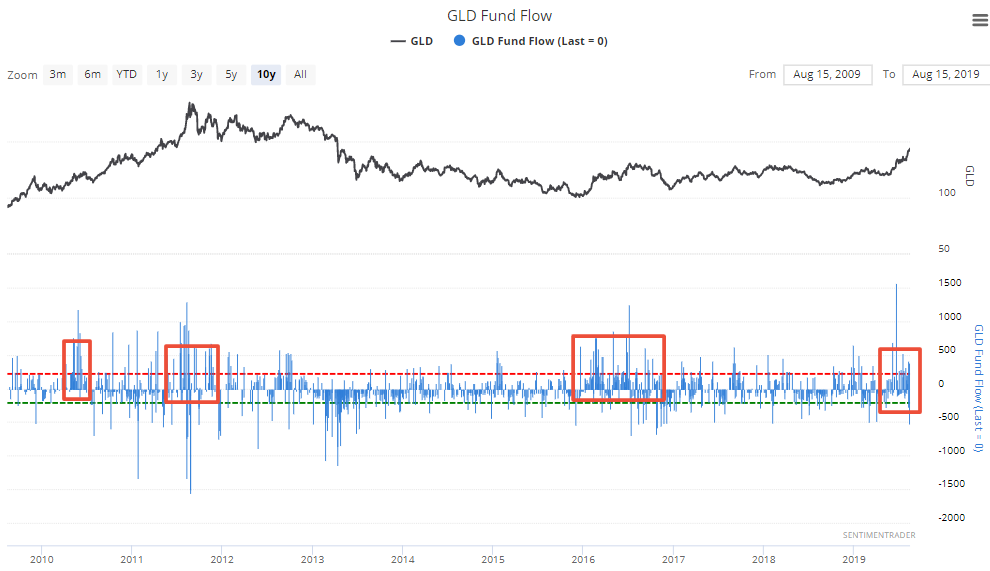
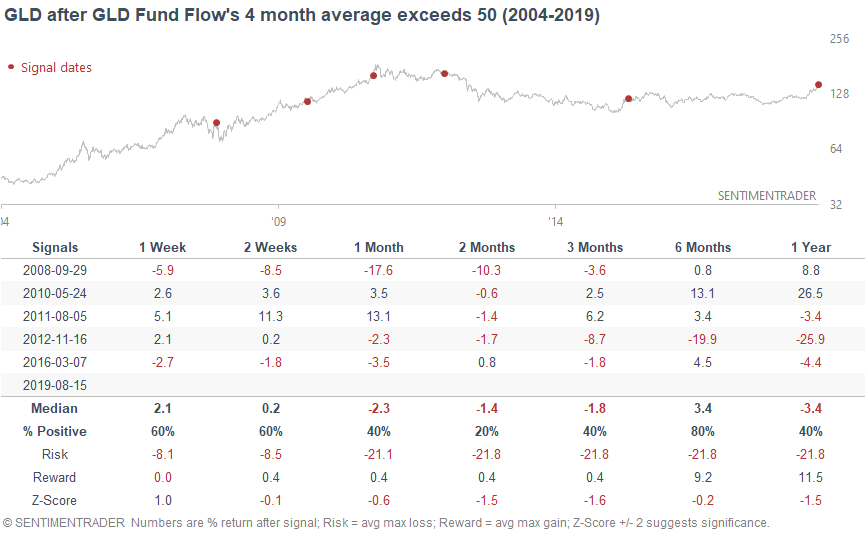
Here’s another bearish factor for gold. GLD (gold ETF) Fund Flow’s 4 month average now exceeds 50. Persistent flows into GLD often occur near intermediate tops.
The other 5 times this happened saw weakness in GLD over the next few months.
Price Patterns
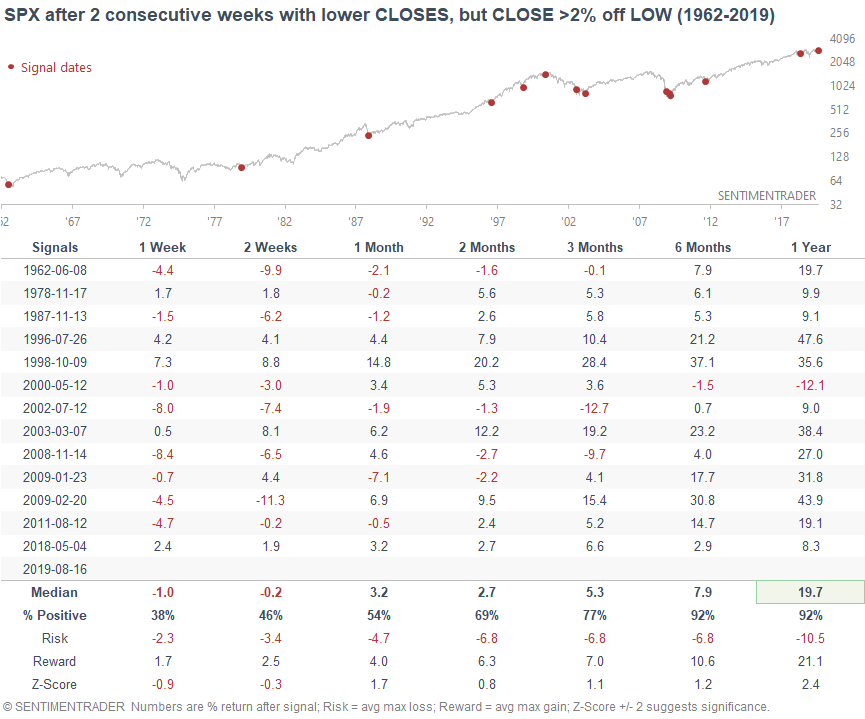
From a candlestick perspective, the S&P seems to be trying to put in a bottom. Despite closing lower for 2 weeks in a row, the S&P’s close in both of these weeks was more than 2% off the low.
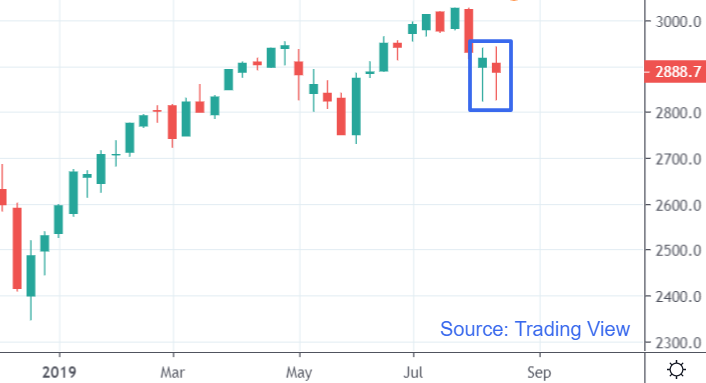
When this occurred in the past (2 attempts at a weekly reversal), it didn’t always work. The S&P sometimes went lower over the next week. Curiously enough, this was mostly bullish over the next 6-12 months. Keep in mind that price patterns tend to have a higher failure rate, and 2 weekly candles should not be used to predict 6-12 months in the future.
Technicals (6-12 months)
Next let’s move on to a 6-12 month forward time frame, which is more bullish.
Sentiment
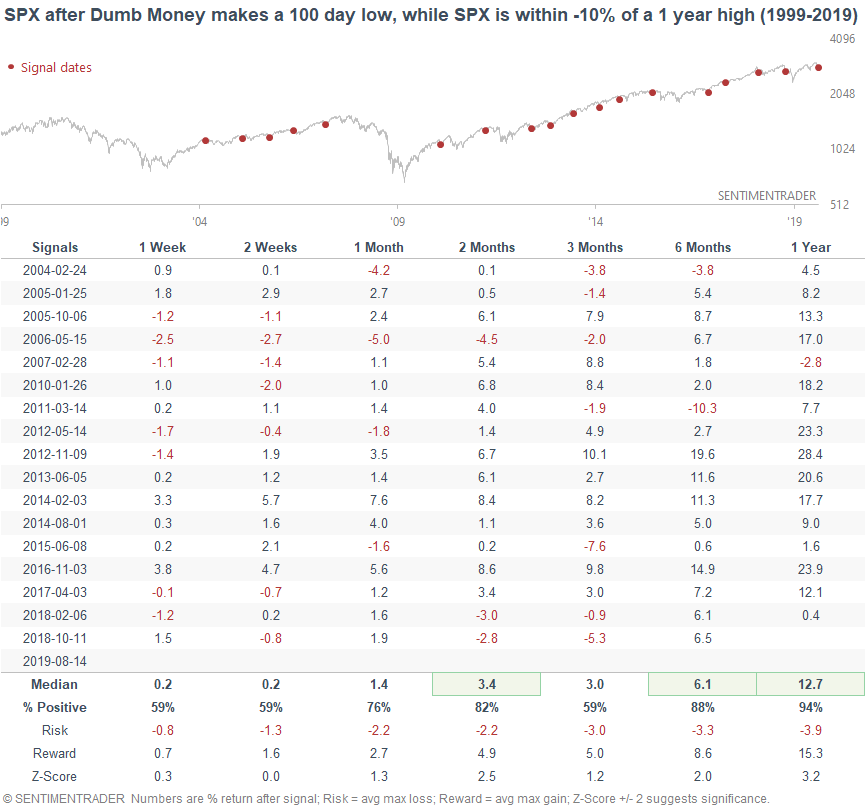
With the stock market in a short term downtrend, our Dumb Money Confidence indicator has fallen to the lowest level since January.
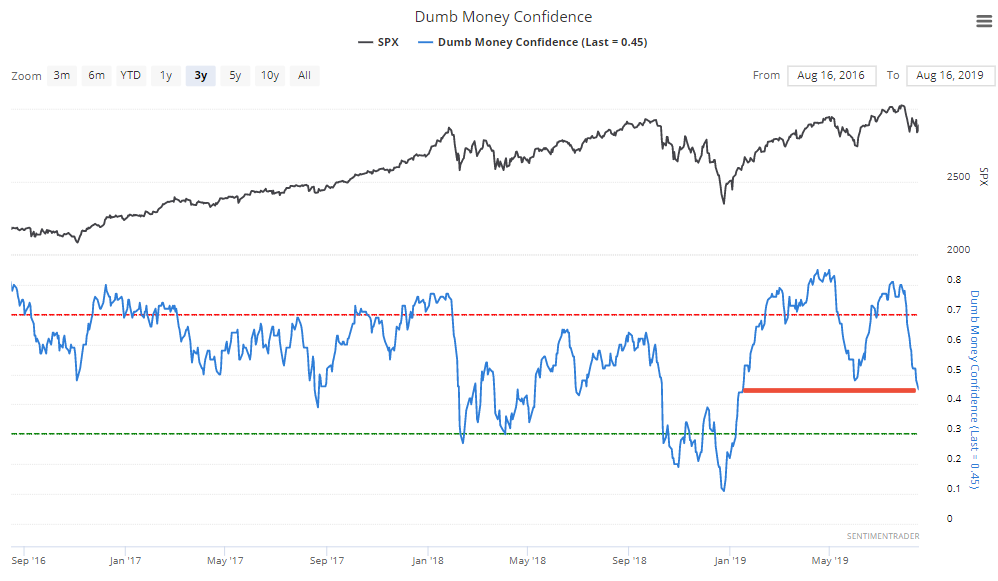
When this happened while the S&P was within 10% of a 1 year high, the S&P’s 2 month and 6-12 month forward returns were mostly bullish.
Breadth
Friday’s stock market rally was strong, with the NYSE Up Volume ratio at 0.89 (89% of NYSE volume was in issues that went up). The last time this happened was during the May 2019 and December 2018 – January 2019 stock market bottoms.
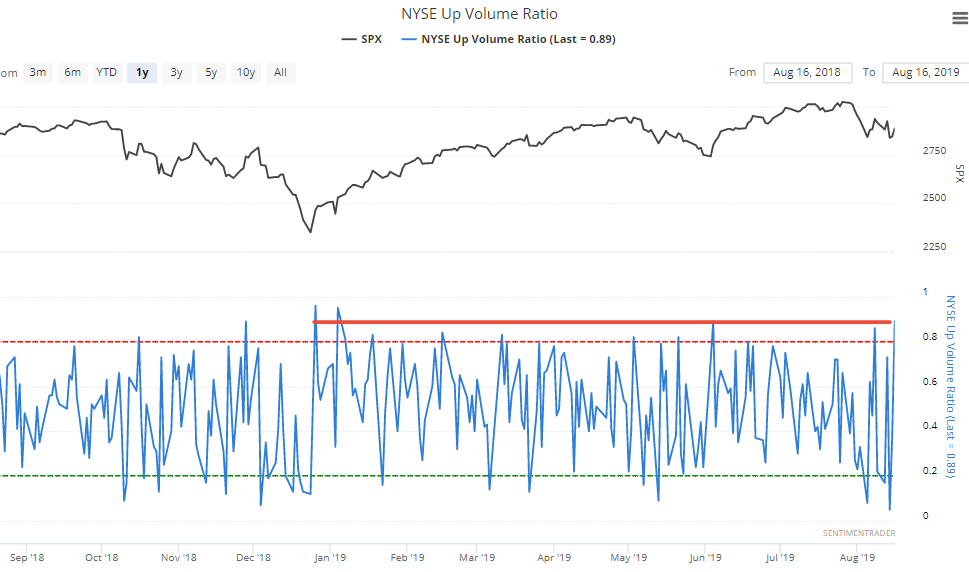
This is not a strong short-medium term bullish factor for stocks. However, high Up Volume readings are usually characteristic of bull markets (with the exception of 2008). So when this happened in the past, the S&P’s 6-12 month forward returns were slightly more bullish than random.
Bonds
Much of the news this week was in markets other than stocks, such as bonds and gold. (We’ll cover the yield curve later in this note).
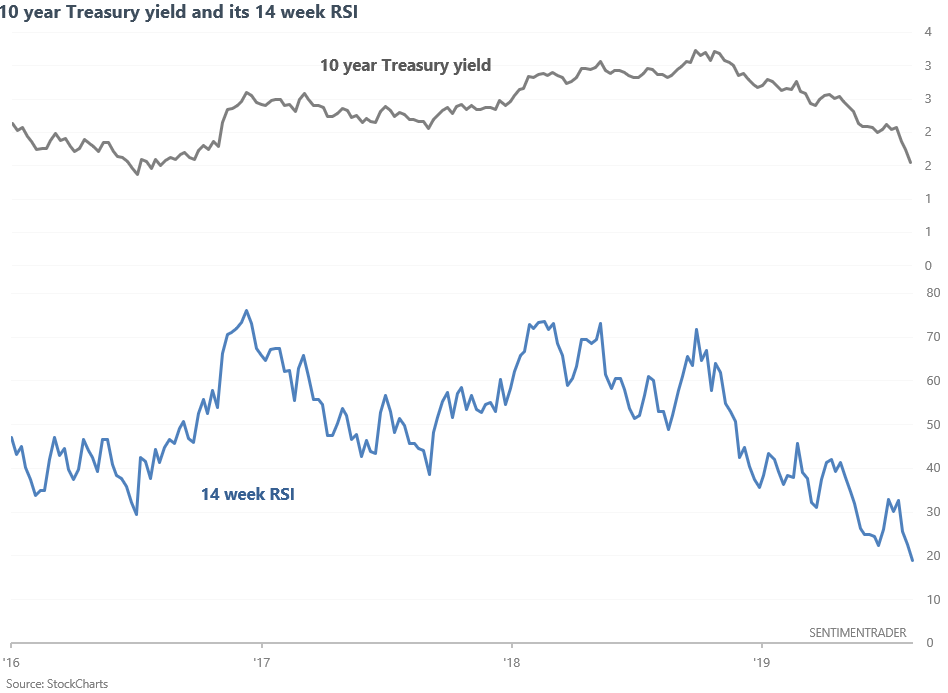
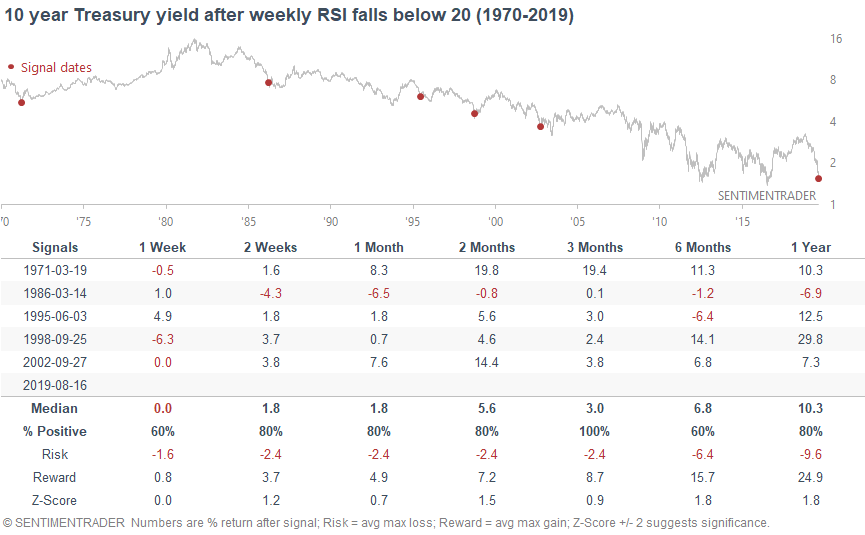
Despite many calls for a bottom in Treasury yields, yields continue to fall (and bonds continue to surge). The 10 year yield’s 14 week RSI has now fallen to among the lowest readings in the past 50 years.
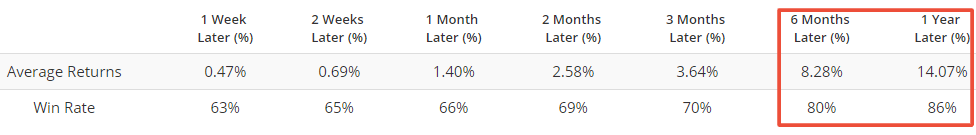
When the 10 year yield’s weekly RSI fell below 20 (e.g. now), risk:reward favored bond bears.
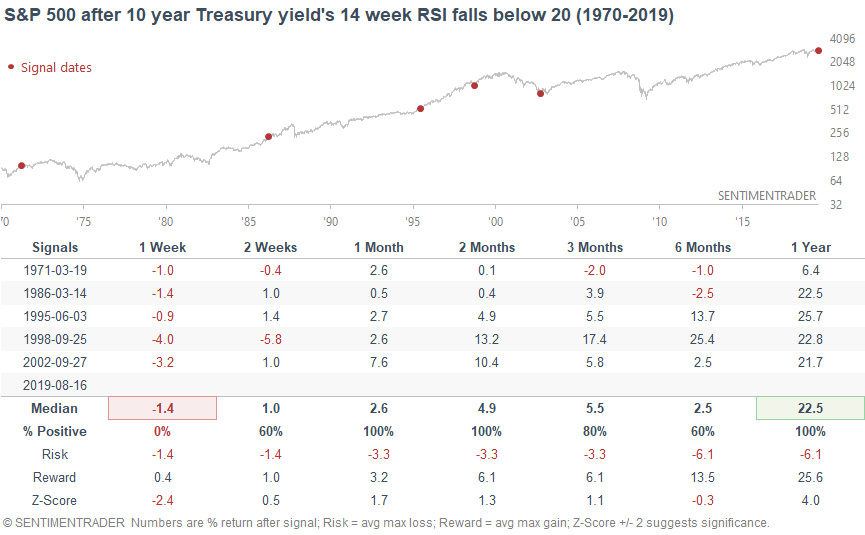
And in case you’re wondering, a bottom in Treasury yields was not consistently bearish for stocks after 1 week.
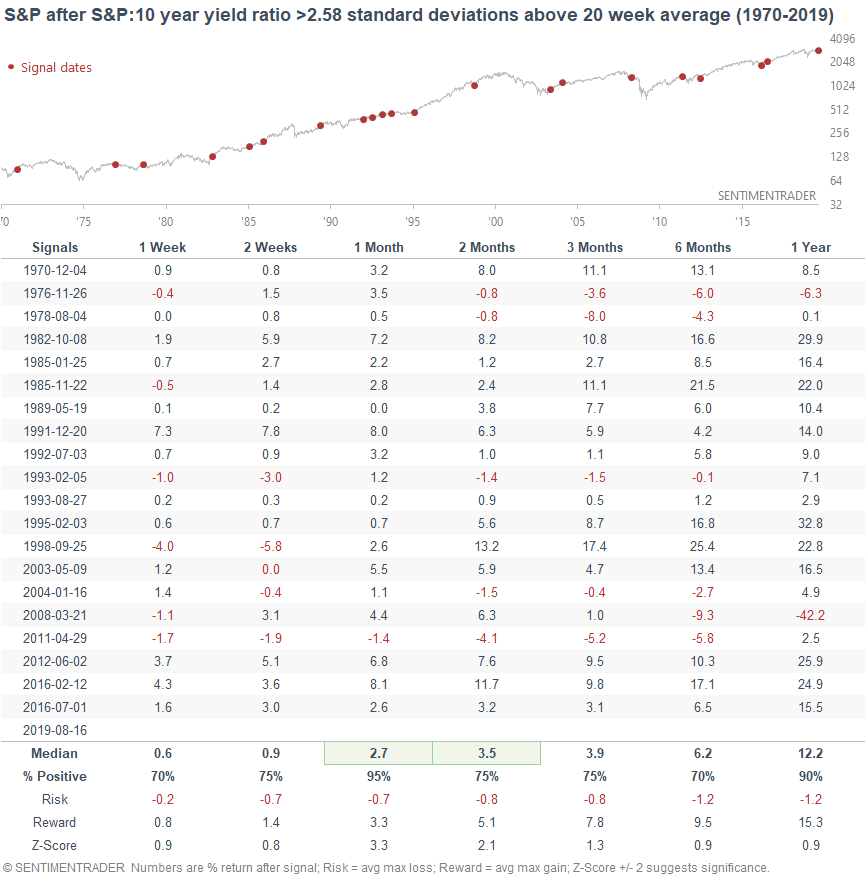
We can look at stocks vs. bonds from another perspective. With Treasury yields falling, the S&P:10 year yield ratio has soared. This ratio is now more than 2.58 standard deviations above its 20 week average.
*Standard deviations are commonly used in Bollinger Bands.
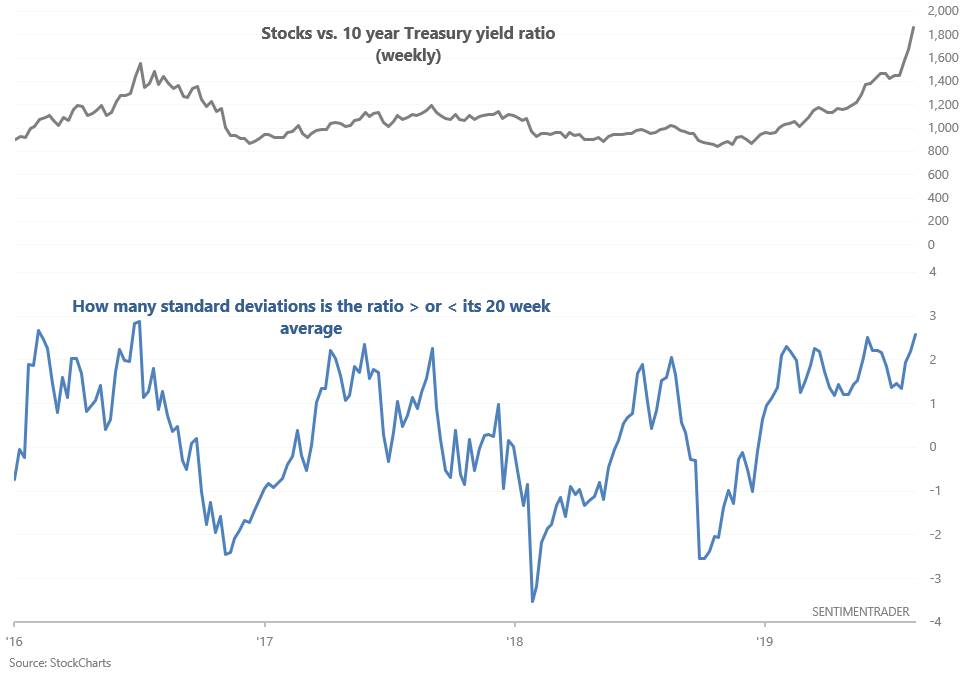
When the stocks:yields ratio surged in the past, the S&P was consistently bullish 1 month and 1 year later.
Fundamentals (6-12 months)
The economy and the stock market move in the same direction in the long term. Hence, having an accurate understanding of fundamentals can help investors and traders make better long term decisions.
With so many different (and often conflicting) fundamental indicators to look at, it’s easy for one to get lost. Here’s how I approach fundamentals:
- There are 3 general types of economic indicators: leading, coincident, and lagging. Focus on the leading indicators. Since a recession typically starts AFTER the stock market tops, we need to find leading indicators that deteriorate SIGNIFICANTLY before a recession starts. Otherwise, our fundamental indicator would be useless for market timing.
- Look at what the leading indicators are saying RIGHT NOW. Do not try to predict what the economy will do 6 months, 1 year, or 2 years in the future. Most predictions of the future are no better than a coin toss because so many factors impact the economy.
- Focus on economic data series that have lots of historical data. The more data, the better. In general, I prefer economic data series that have at least 40-50 years of historical data.
- Focus on leading economic indicators that have fewer false signals. False bearish signals hurt investors and traders by getting them out of the market too early.
I usually monitor a list of 25-26 leading indicators, of which I use 11 to create a “Macro Index”. If you buy stocks when the Macro Index is above 0.7 and sell stocks when the Macro Index is <= 0.7, you will beat buy and hold. As you can see, there are no economic predictions involved. The Macro Index simply states how decent the U.S. economy is today, and how you should be positioned from a long term perspective.
Eric, Jason, and I will hopefully have the Macro Index available here on SentimenTrader sometime over the coming days.
*The Macro Index takes into consideration the fact that economic data is released with a lag.
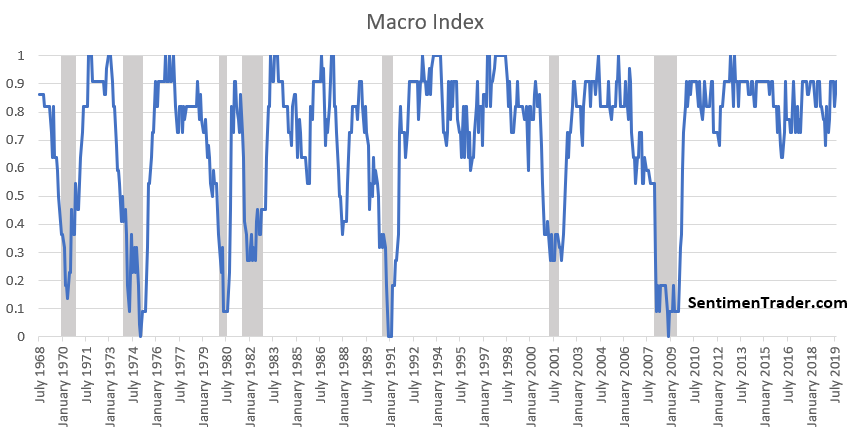
As you can see, the Macro Index does not show significant deterioration right now. I’ll explain the calculations in the future. But for now, let’s look at what the Macro Index covers:
Housing
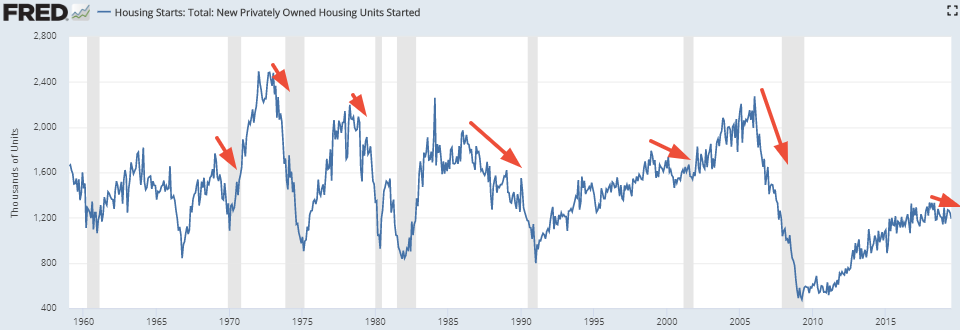
3 of the Macro Index’s 11 indicators are housing related. Housing is an extremely important leading sector of the U.S. economy, and there are plenty of papers explaining why. Right now, 2 of these 3 housing indicators exhibit mild weakness.
Here’s Housing Starts, which has been trending sideways/downwards for months. In the past, Housing Starts trended downwards before recessions began.
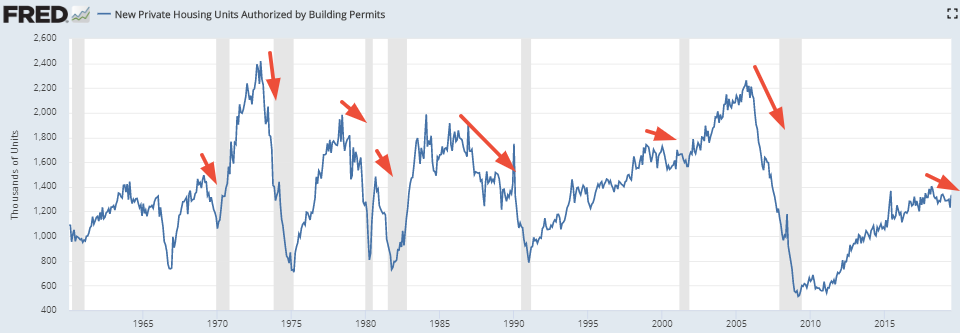
Here’s Building Permits, which has also been trending sideways/downwards for months. In the past, Building Permits trended downwards before recessions began.
And here’s New Home Sales, which is trending sideways. In the past, New Home Sales trended downwards before recessions began.
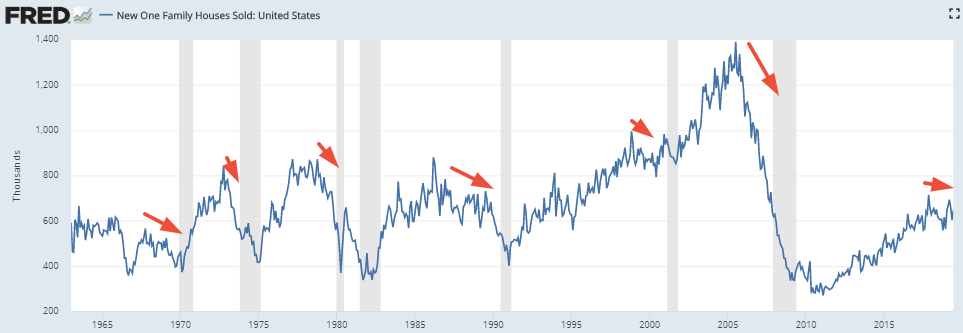
Overall, housing is a slight negative factor for the economy right now.
Yield Curve
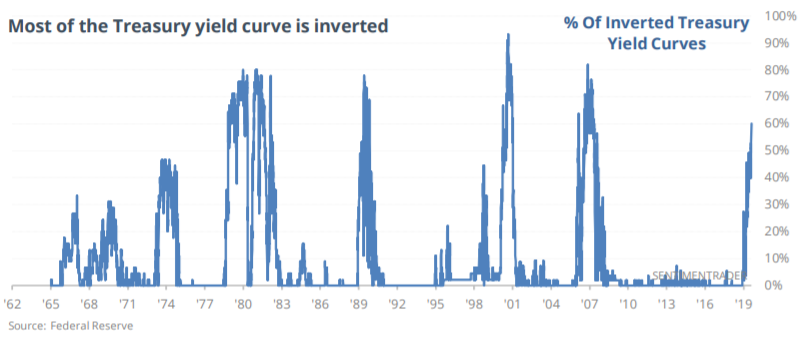
The Macro Index also looks at the 10 year – 3 month yield curve. Most market participants look for yield curve inversions. The Macro index doesn’t.
As Jason has demonstrated, yield curve inversions often precede recessions and bull market tops by 1-2 years.
A more timely bearish signal is to wait for the yield curve to steepen, which typically happens just after the bull market tops.
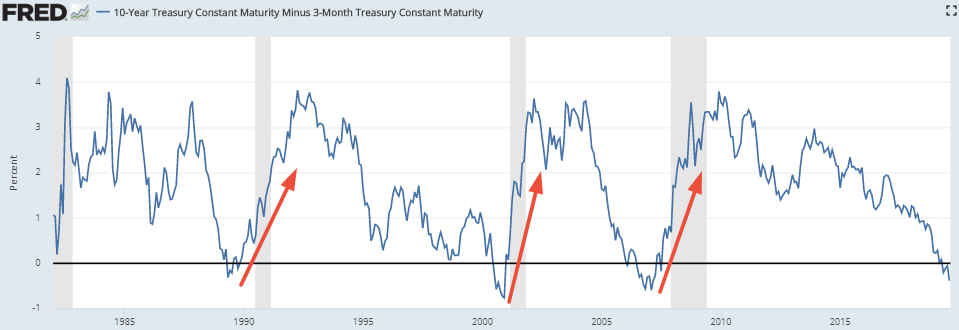
The yield curve has yet to steepen today. The yield curve’s main message right now is:
- The economic expansion is late-cycle. “Late-cycle” does not mean that it will end today. Late-cycle is a range.
- Watch out when the yield curve starts to steepen.
Manufacturing
The manufacturing sector was a better leading indicator for the U.S. economy pre-1970, when the U.S. economy relied more on manufacturing. But as the U.S. economy diversified and moved away from manufacturing, manufacturing-related indicators have become less accurate as leading indicators. Nonetheless, I have included the ISM Manufacturing PMI in the Macro Index to represent this sector of the economy.
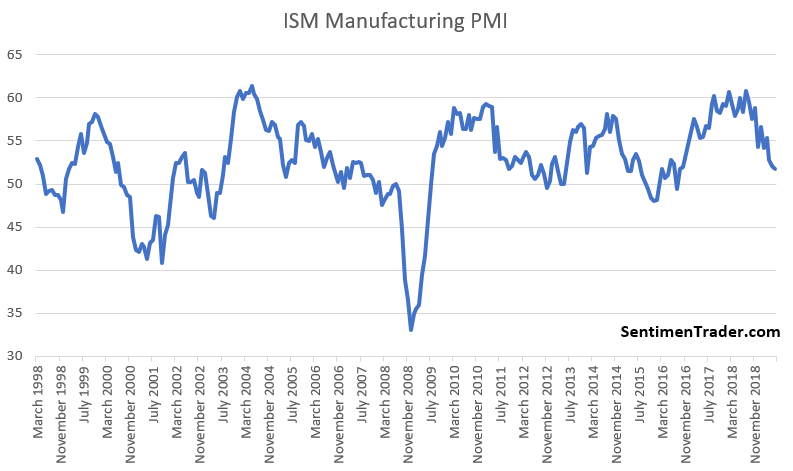
Readings below 50 (contraction) are considered bearish by the Macro Index. This has not happened yet, so it is not yet a bearish factor. But should the manufacturing PMI fall below 50 in the coming months, then this will be a bearish factor when that happens.
Labor market
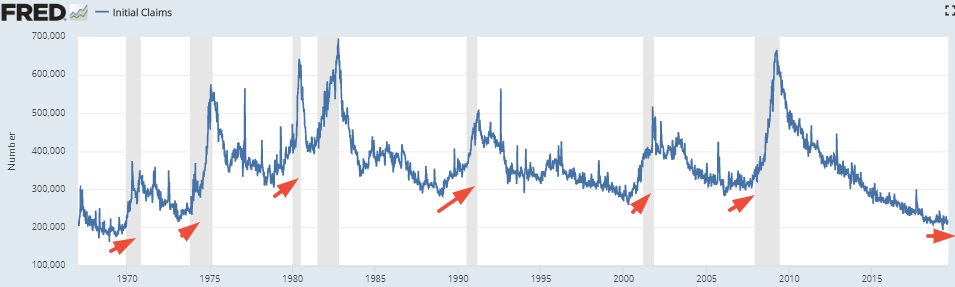
Indicators related to the labor market are extremely useful, timely, and accurate (few false signals). As you would expect, rising unemployment quickly leads to less spending, which leads to a recession. But whereas most people focus on the Unemployment Rate, it’s better to focus on Initial Claims and Continued Claims. These 2 indicators typically lead the Unemployment Rate.
Here’s Initial Claims, which has been trending sideways for months. In the past, Initial Claims trended upwards before recessions began.
Here’s Continued Claims, which has also been trending sideways for months. In the past, Continued Claims trended upwards before recessions began.
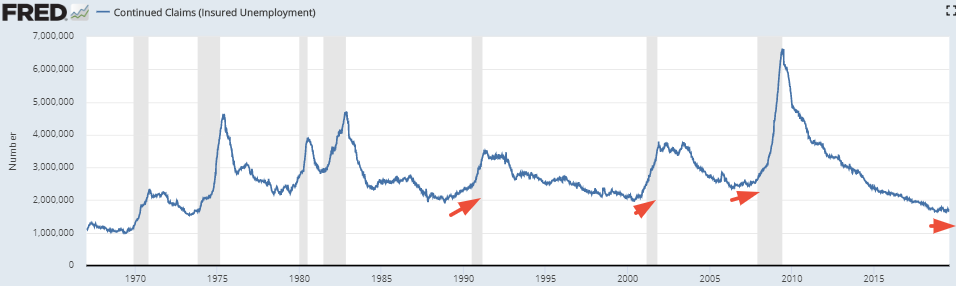
The lack of significant labor market weakness continues to be a positive for macro. But with Unemployment extremely low, I am watching labor market indicators vigilantly.
Heavy Truck Sales
The Macro Index looks for a downtrend in Heavy Truck Sales because in the past, Heavy Truck Sales trended downwards before recessions began.
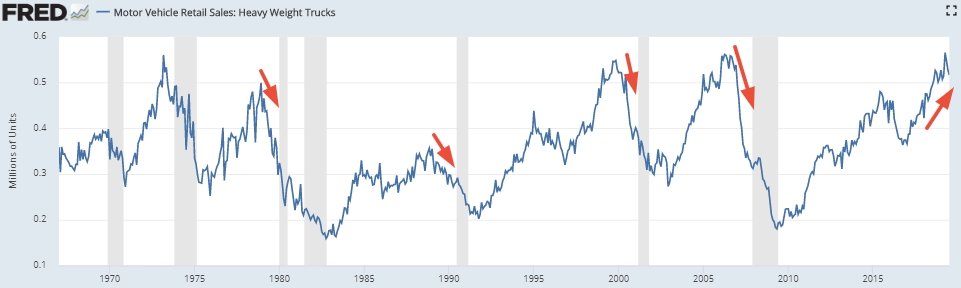
With no significant deterioration in Heavy Truck Sales, this continues to be a positive for the Macro Index.
Rising inflation
Inflation typically trends upwards before a recession begins. This is because the economy typically overheats as the expansion ages.
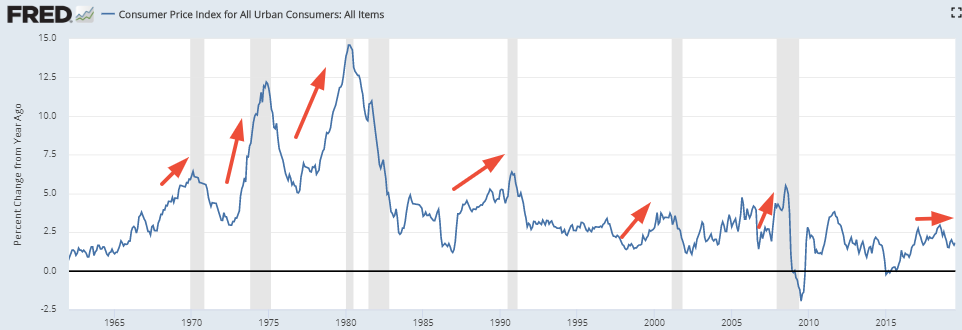
Without an uptrend in inflation right now, this is a positive factor for Macro.
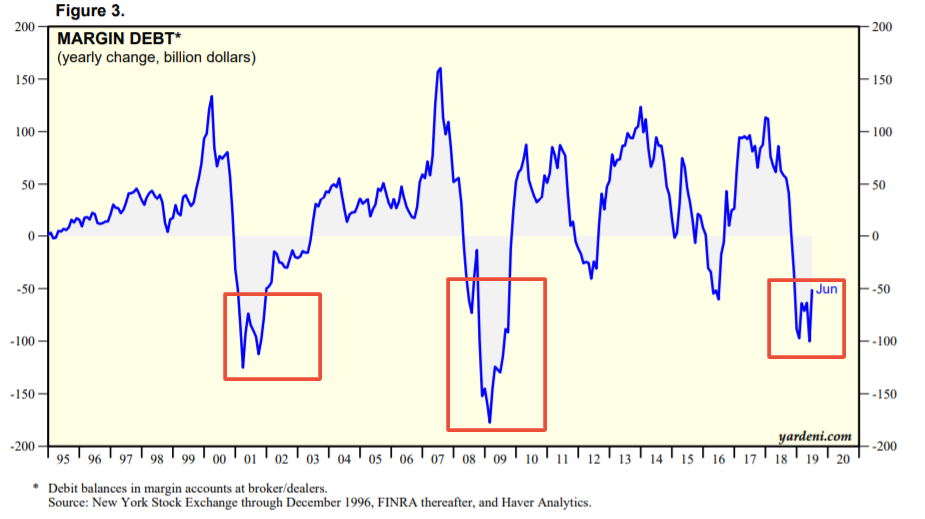
Margin Debt
There are 2 ways to look at Margin Debt:
- When Margin Debt growth significantly outpaces the stock market’s gains, you should be concerned. This has happened before many big corrections and bear markets.
- When Margin Debt growth collapses, you should also be concerned. This is similar to a trend following indicator that turns bearish, because Margin Debt usually moves with the stock market.
Margin Debt growth is in deep negative territory right now. The Macro Index considers this to be a negative factor.
Stock market
And lastly, the Macro Index looks at whether the S&P is in a long term uptrend or downtrend. This may seem weird, because it introduces the potential for “circular logic” (the S&P should go up because it is going up). But this is precisely the concept behind “momentum”, and is why other popular leading indicators (e.g. Conference Board LEI) also use this.
The S&P remains in a tenuous long term uptrend. The Macro Index considers this to be a positive factor.
Overall
Macro remains positive overall. HOWEVER, this can change rapidly over the next few months. The economy isn’t as strong as it was in 2013 or 2017. Small cracks (manufacturing, yield curve, housing) can turn into bigger cracks, and yet-to-be cracks (e.g. labor market) may appear over the next few months.
Overall, macro is positive but we should be extremely vigilant at this stage in the economic expansion. Watch out for signs of SIGNIFICANT and SUSTAINED deterioration.
Long term risk:reward
Long term risk:reward clearly favors bears. That is why I’m extremely vigilant for a potential recession. Guggenheim has been able to model something that many experienced investors and traders know implicitly: valuations determine the size of a bear market.
- Match: A weakening economy is the trigger for a bear market.
- However, the intensity of the recession has little to do with the intensity of the bear market. E.g. 2001 was a mild recession, but the 2000-2002 bear market was big.
- Powder: valuations BEFORE a bear market begins determines the intensity of the bear market. High valuation bull markets are followed by big bear markets.
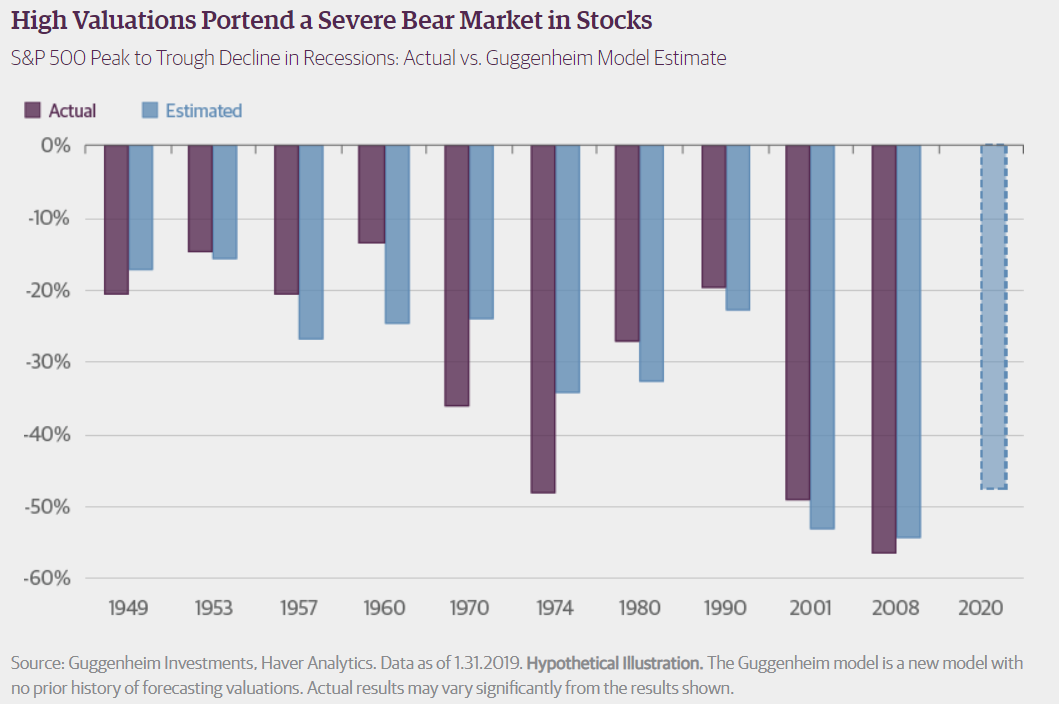
Regardless of what valuation indicator you follow, it’s clear that the stock market’s valuation is high right now. We have the powder. Now we’re just waiting for the match.