
What I'm looking at - CEO confidence, Put/Call spike, new highs %, sentiment divergence, FTSE 100
With stocks bouncing around near an all-time high, here's what I'm looking at:
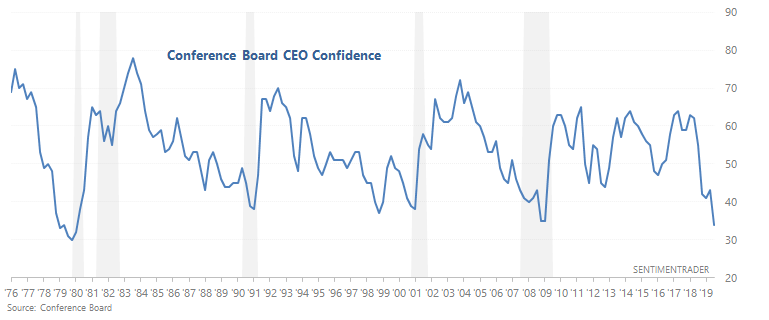
CEO Confidence
The Conference Board's CEO Confidence has fallen to 34, which is the lowest reading in a decade. According to the Conference Board, CEO's are citing the ongoing trade war and slowing global growth as the cause for their pessimism. Moreover, CEO's are more pessimistic towards China and Europe than to the U.S.
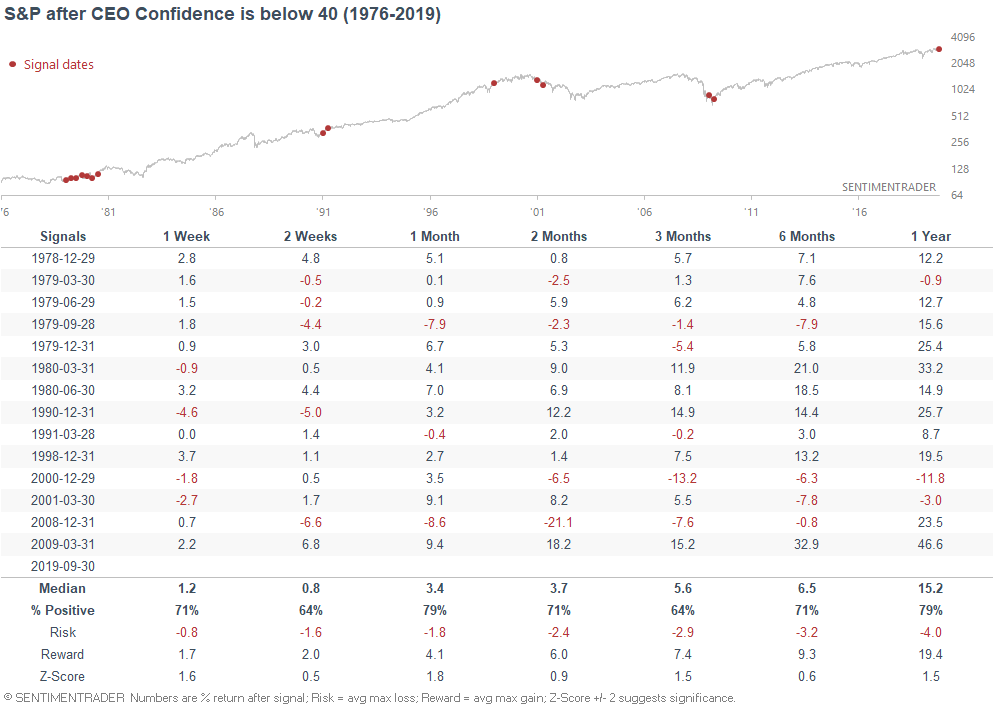
While it's true that such low pessimism readings typically occurred in a recession, it's not clear that this is a bearish sign for stocks. The following table looks at every single quarter in which CEO Confidence was below 40, and what the S&P did next:
We can also examine the first case in 1 year (to avoid overlaps):
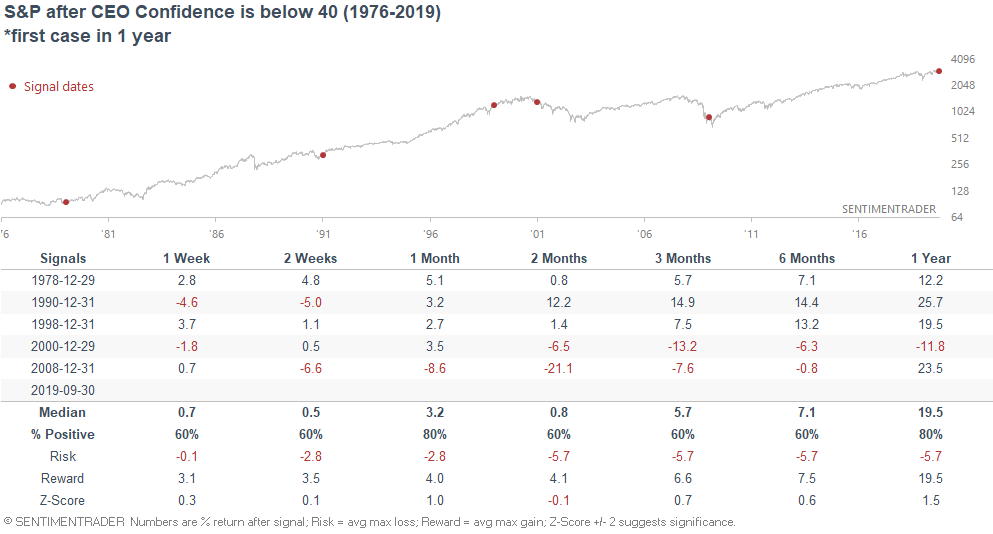
This isn't a consistent bearish factor for stocks on any time frame.
Overall, the trade war is impacting economic and survey data in the following way:
- Soft data (surveys) is much worse than hard data. This is to be expected. When humans are faced with ongoing uncertainty (e.g. trade war), we tend to think about the worst case scenario and exaggerate fears in our mind. The longer this uncertainty lasts, the stronger these fears grow.
- Trade and manufacturing related data (i.e. data related to the international flows of goods and services) is worse than economic data that focuses more on the domestic U.S. economy (e.g. housing, labor market).
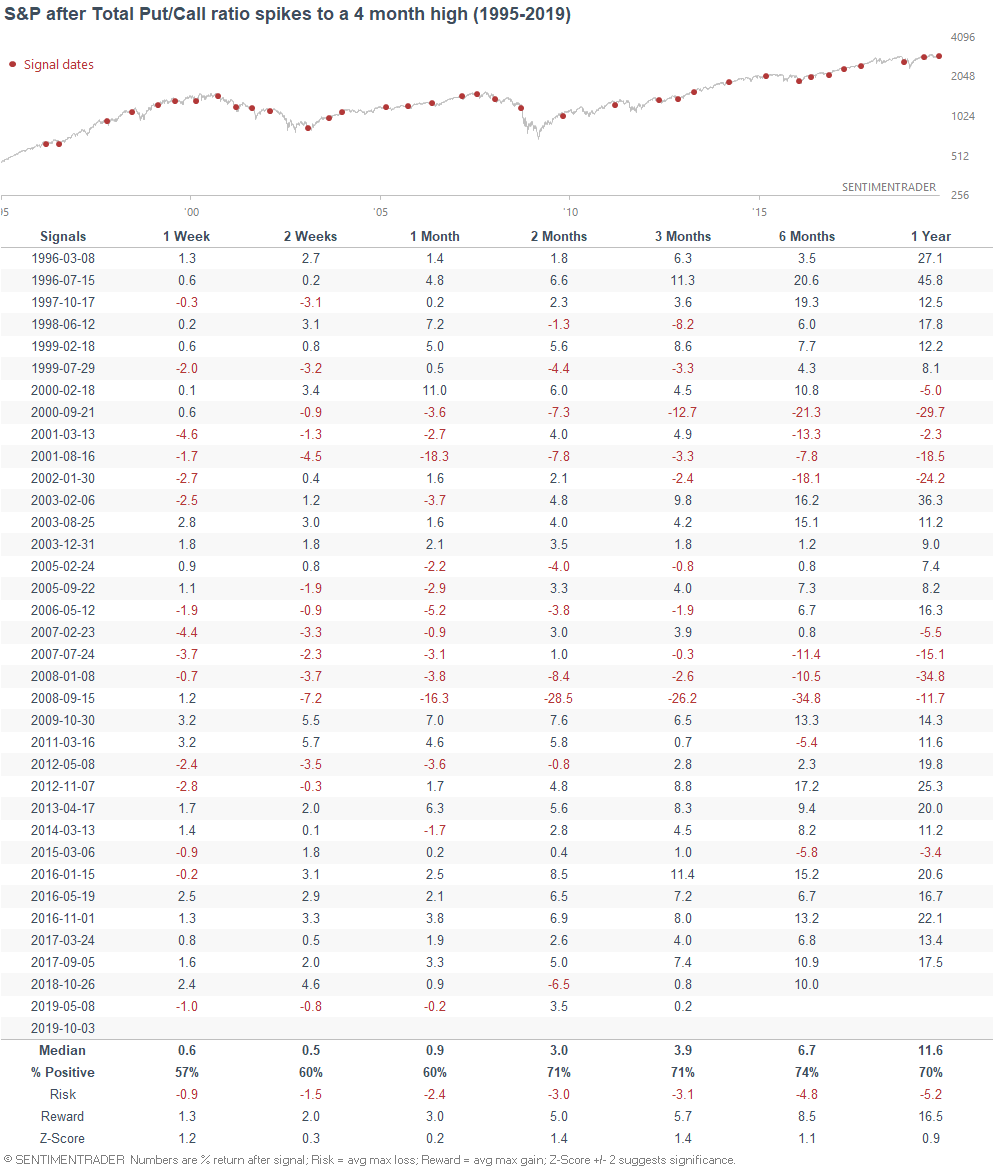
Put/Call spike
The Total Put/Call ratio spiked yesterday to the highest level since late-May.
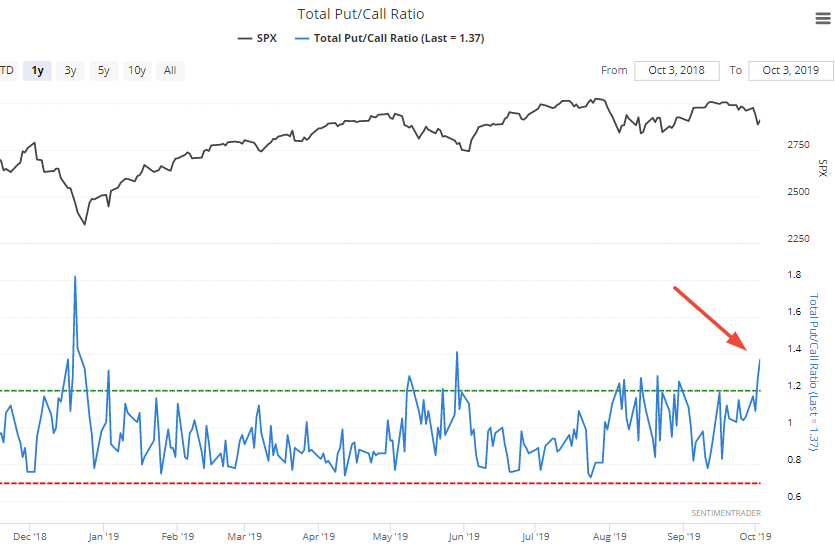
Similar spikes in the past were more bullish than random over the next 2-3 months:
A lot of the bearish cases occurred when the stock market was in a clear downtrend (i.e. below its 200 day average). During those cases, such Put/Call spikes often marked the beginning (and not the end) of a selloff. So if we isolate for the cases that occurred while the S&P was above its 200 day average (like today):
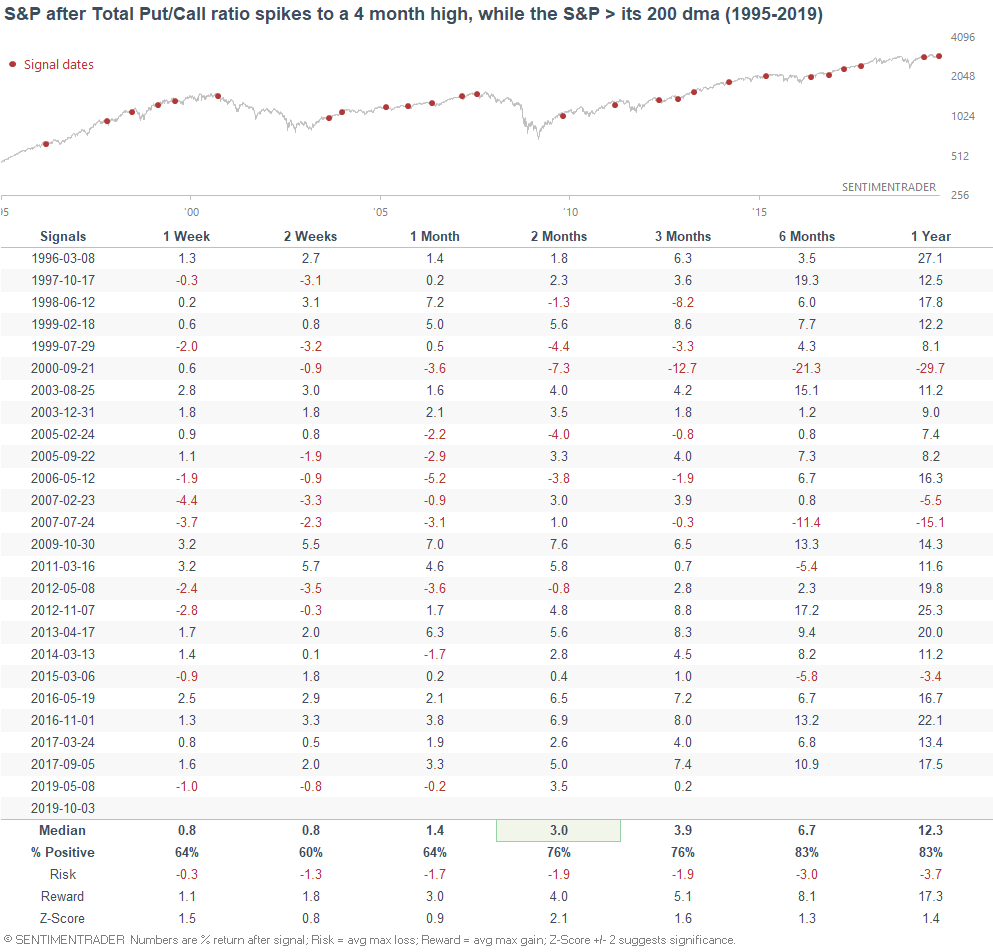
... the S&P's forward returns become more bullish.
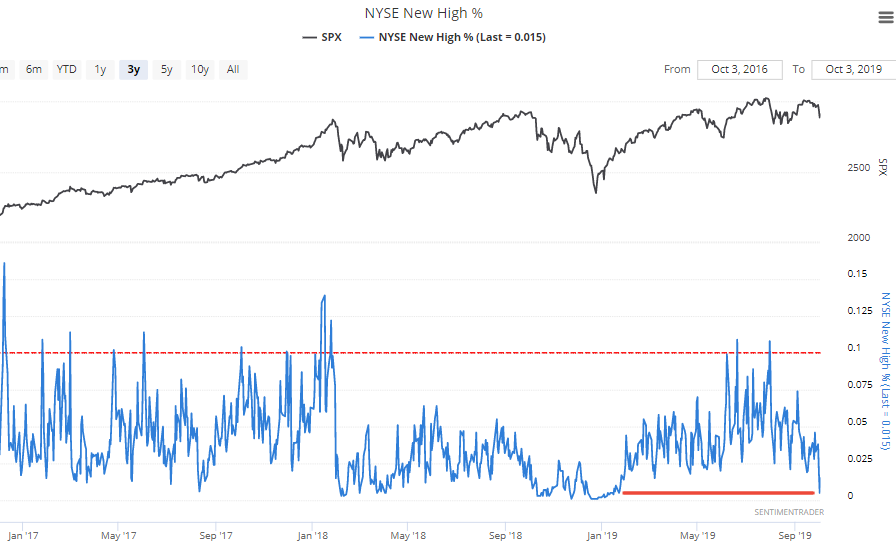
New highs
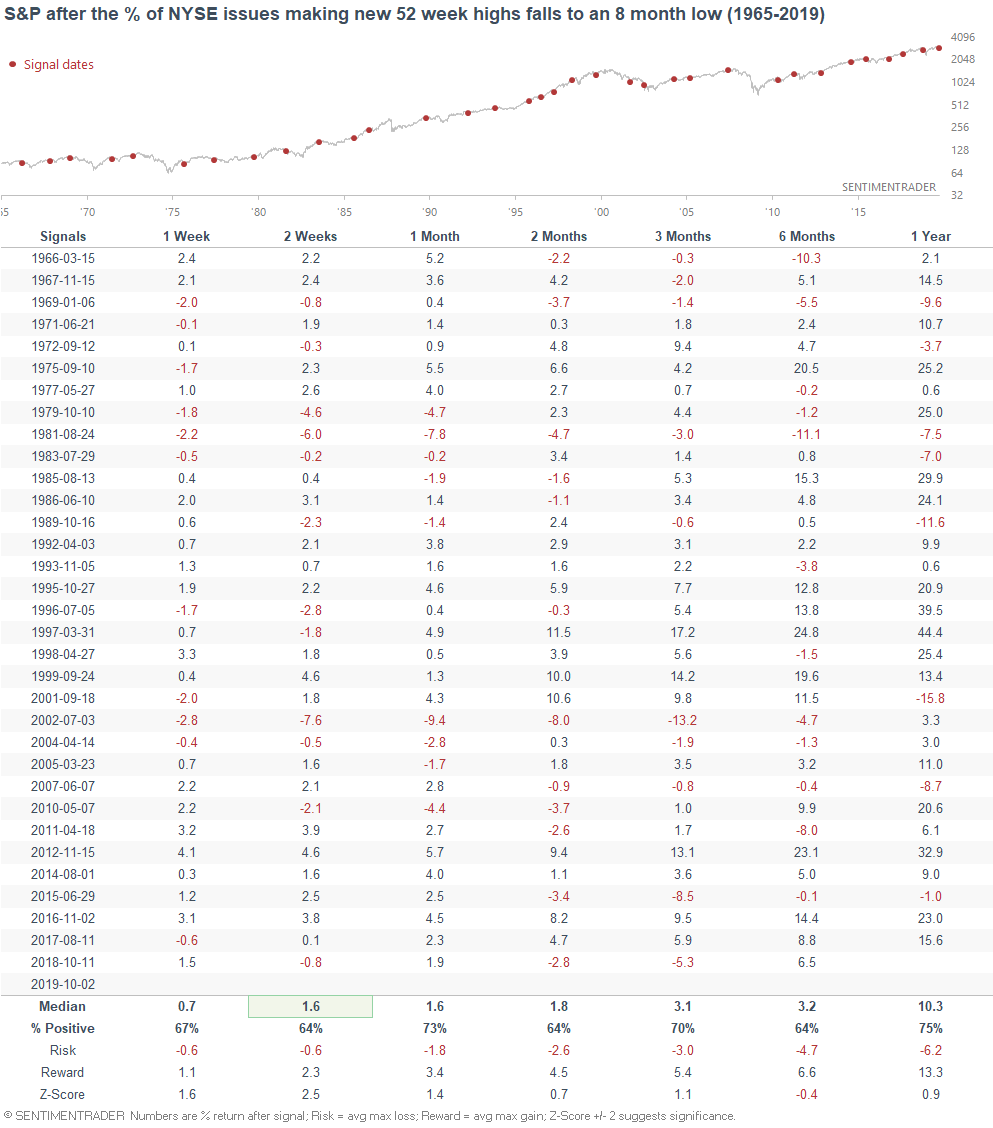
While the stock market tanked on Wednesday, the % of NYSE issues making a new 52 week high fell to the lowest level since January.
When this happened in the past, the S&P's returns over the next few weeks were more bullish than random. As we've demonstrated plenty of times here at SentimenTrader, multi-month bullish momentum doesn't die that easily. Even if the stock market is about to rollover into a much bigger correction, it usually doesn't fall in 1 straight line. Even Q4 2018's crash started off with a normal decline, lots of chop, and then a crash.
AAII + NAIM
As Jason noted, AAII Bullish % is very low, which has usually been a good sign for stocks. The NAAIM Exposure Index (for active managers) is also low, but not quite as low as AAII. And as Willie Delwiche pointed out, the responses are all over the place. Some managers are quite bullish, while others are quite bearish.
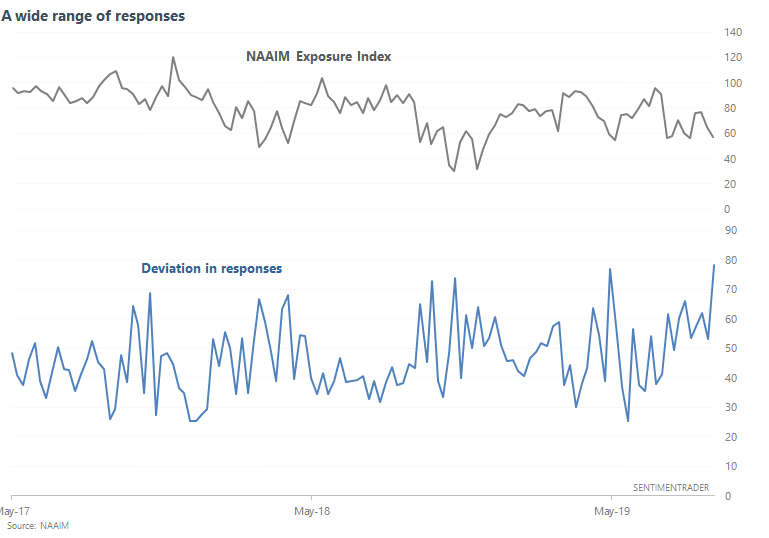
Here's a complete look at the deviation in responses:
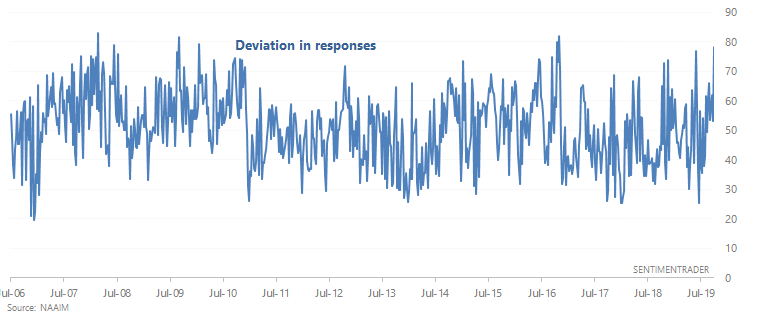
We can notice something interesting here:
- This typically happens around major inflection points in the market, when investors and traders split into 2 groups (those who are extreme bearish, and those who are extremely bullish). One camp is eventually proved to be very right, and the other is proved to be very wrong.
- For example, this occurred during the beginning of the 2007-2009 bear market, when some managers saw the potential for a crash while others thought that the selloff was a great buying opportunity.
- This also occurred during 2009 (after the market had already bounced), when the primary question on everyone's mind was "is this rally sustainable? Or just another bear market rally?"
- This occurred in late-2016, when some believed that last year's economic slowdown (2015-2016) and Trump's election would cause stocks to tank.
- This DOES NOT occur during the worst of a crash or during a year of calm (e.g. 2017 and 2013), when investors and traders are uniformly bearish or bullish.
I wouldn't consider this to be a bullish or bearish sign for stocks right now, but merely indicating what I can anecdotally feel on Twitter.
I like to keep track of tweets from popular people on Twitter, and see how many retweets/likes bullish tweets get and how many retweets/likes bearish tweets get. Putting aside the fact that bearish tweets almost always get more engagement than bullish tweets (people love bad news, because it sounds so smart), here's what I've noticed:
- From October-November 2018, bullish tweets were equally as popular as bearish tweets. The usual "stocks will CRASH" crowd loved the selloff, whereas bullish people came out in force to engage with bullish tweets that suggested the correction was over.
- In December 2018, bearish tweets were all the rage. Comparisons to "this is just like the Great Depression" and "this is just like 2008" got the most engagement.
- From January-February, short term bullish tweets started to get more popularity as many bears also expected a short term bounce. However, there were few popular tweets suggesting that stocks will soar over the next few years.
- From April-present, the popularity of tweets has bifurcated into 2 groups. On one hand you have the usual "stocks will crash" crowd ("see how today is similar to 1987?"). But on the other hand, there are many who think that "stocks will SOAR one last time in this bull market", stating how today is similar to 2016.
In short, Twitter is an interesting way to view sentiment. As NAAIM also suggests, investors and traders are quite split right now. One side will be proven very right, and the other side will be proven very wrong.
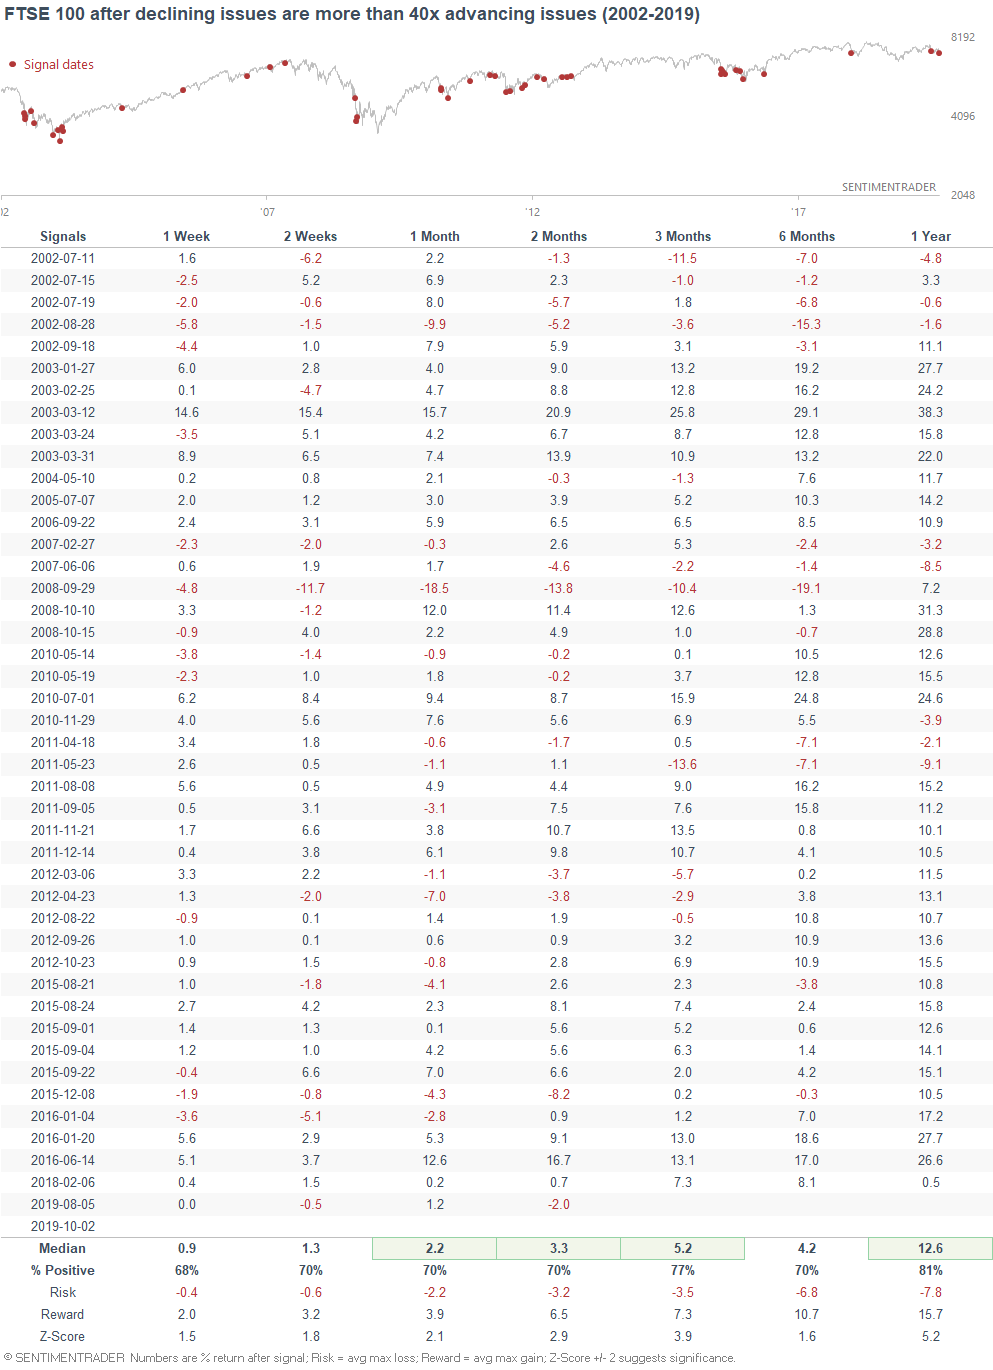
FTSE 100 (U.K.)
And lastly, Wednesday's selloff saw a lot of red. Most stocks in most global indices went down. For example, the FTSE 100 saw declining issues exceed advancing issues by almost 50-to-1:
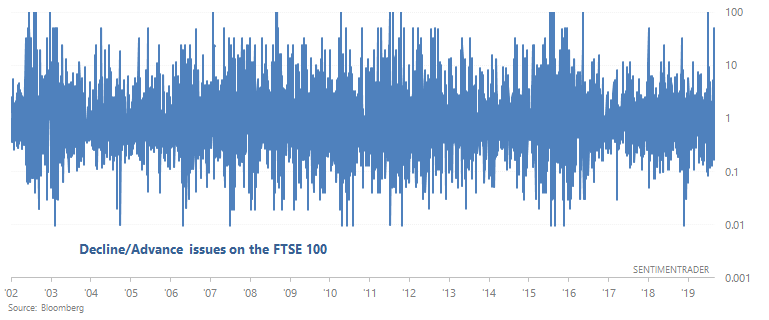
Such across-the-board selloffs were more bullish than random for the FTSE 100 over the next 1-3 months:
If you have any questions or comments, please feel free to email me at [email protected]