Thursday Color - Depressed investors, negative gamma, Anti-Zweig thrust, signs of anxiety

Here's what's piquing my interest as traders take in the latest batch of not-so-great economic data.
Depressed
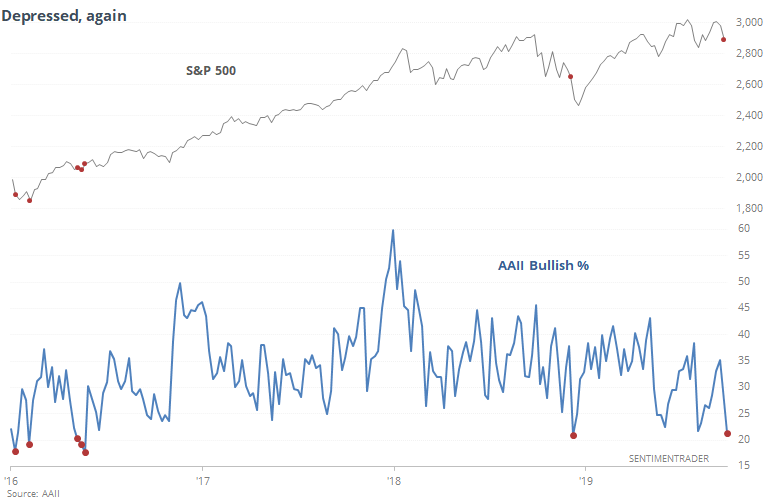
In what has become something of a pattern, individual investors are once again saying they have little optimism about rising prices. Even though they still hold a high proportion of their portfolios in stocks and relatively little in cash, they're saying they don't believe stock prices are likely to rise in the months ahead.
This week's AAII survey showed fewer than 22% of respondents expect a rising market.
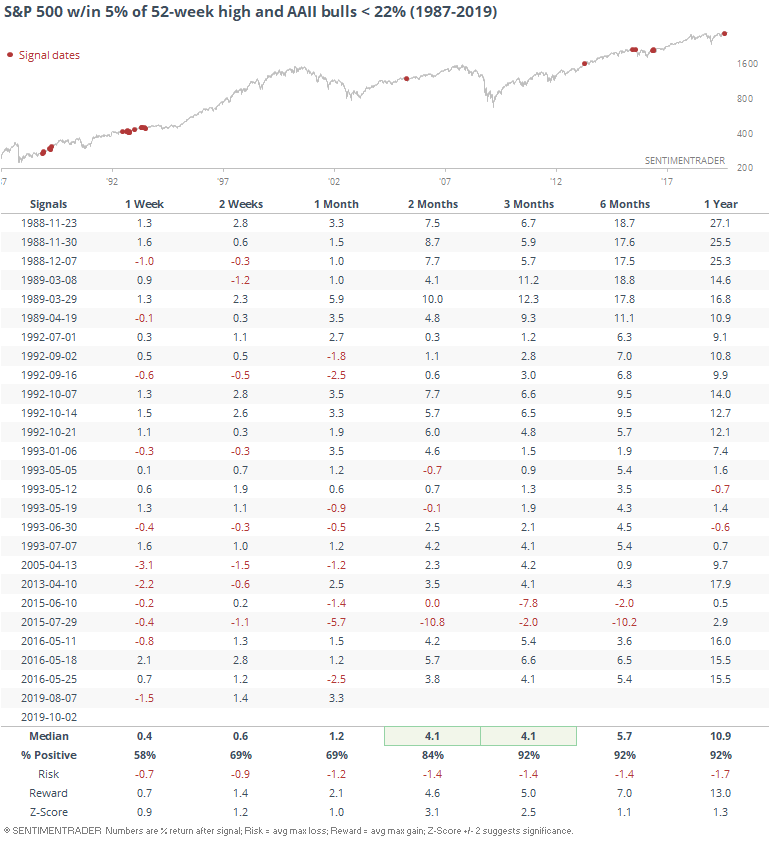
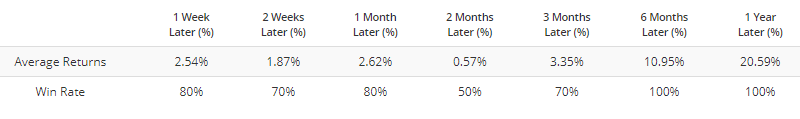
When the S&P 500 was within 5% of its 52-week high and bullish opinion was this low, its future returns were mostly pristine. It didn't prevent a few temporary selloffs, but returns over the next 3-12 months were consistently good.
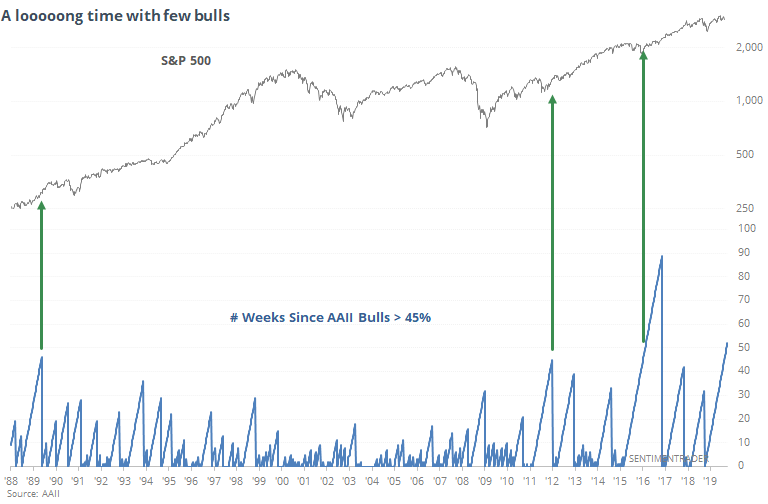
It has now been 52 weeks since the bullish percentage exceeded 45%, the 2nd-longest stretch of "no optimism" in the survey's history. The only one that exceeded it was in late 2015.
Slow Going
Supposedly the biggest trigger for weakness has been the ISM survey of manufacturing sentiment. That hasn't had much of a bearing on future stock prices. Potentially more of a worry is that the services side of the survey has also come in weaker than expected. The history here is short, barely 20 years, but when adding the two surveys together, it's barely above 100.
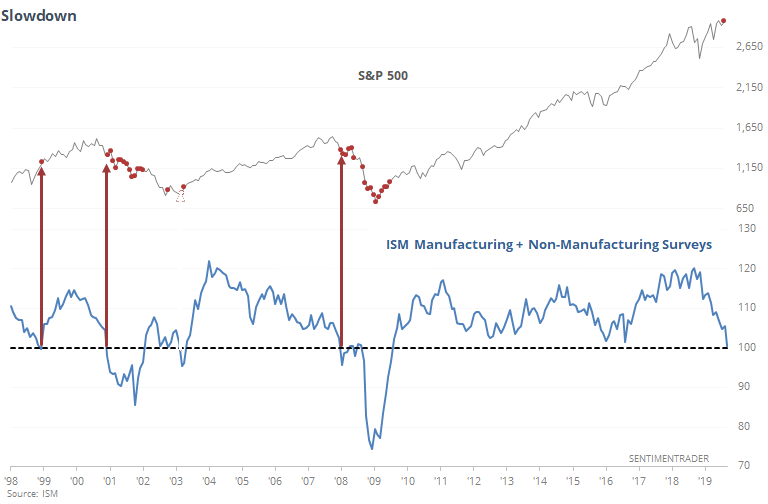
When the combined surveys fell to this low of a level in '98, it was a false signal. But in 2000 and 2007, gave an excellent heads-up that trouble was brewing. In 2012 and 2015, the average *almost* fell to 100, but not quite. Maybe that's just splitting hairs, but either way, stocks took off to the upside almost immediately thereafter. If stocks can't shrug this off in the weeks ahead, it would be more of a warning sign.
Freshly Squeezed
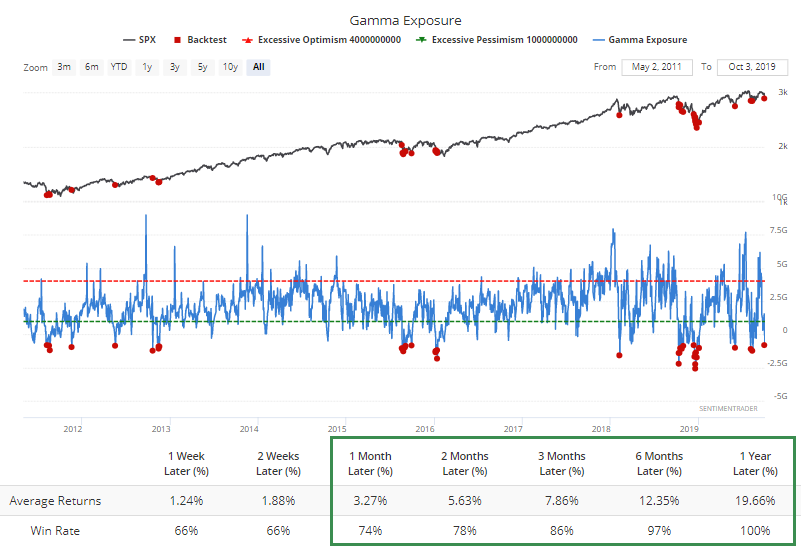
According to SqueezeMetric's calculation of options traders' positioning, there is suddenly a large potential number of shares needed to buy, as Gamma Exposure has plunged to one of the most negative values of the year.
Gamma exposure (GEX); refers to the sensitivity of existing option contracts to changes in the underlying price of the S&P 500. On the chart, a GEX value of 6 billion implies that if price moves +/-1%, 6 billion shares will come to market to push price in the opposite of the prevailing direction. The highest values tend to occur as prices peak and the lowest values as prices bottom.
According to the Backtest Engine, a reading this low has typically resulted in buying pressure coming into the market, though there was some short-term volatility (a polite word for "losses) a few times.
Anti-Zweig
Earlier this year, we'd seen positive breadth thrusts, popularized by the great Martin Zweig. The 10-day average of breadth had cycled from a very low level to very high level in a short period of time. There are no rules in technical analysis (or most other forms for that matter) but typically one uses a 10-period exponential moving average (not a simple average), using NYSE advancing vs declining stocks (not volume) and over a 10-day period (not a 15-day or longer).
So, technically, we haven't seen the inverse of a Zweig Breadth Thrust over the past couple of weeks. But I have little patience for semantics and rules, and would rather focus on the spirit of the concept rather than the particulars.
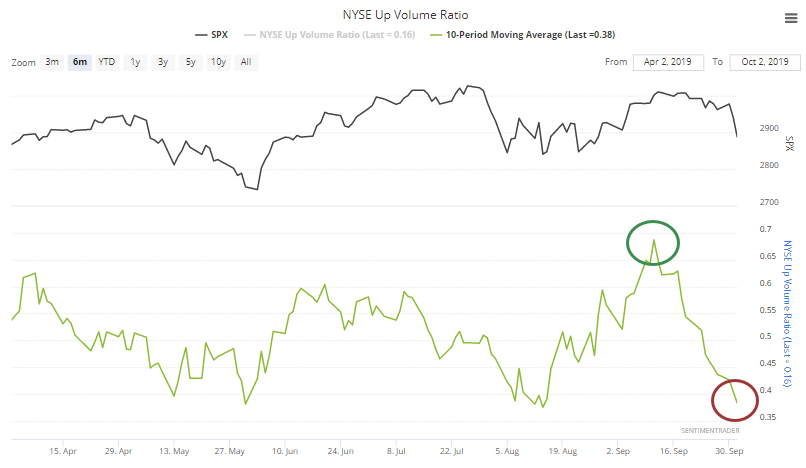
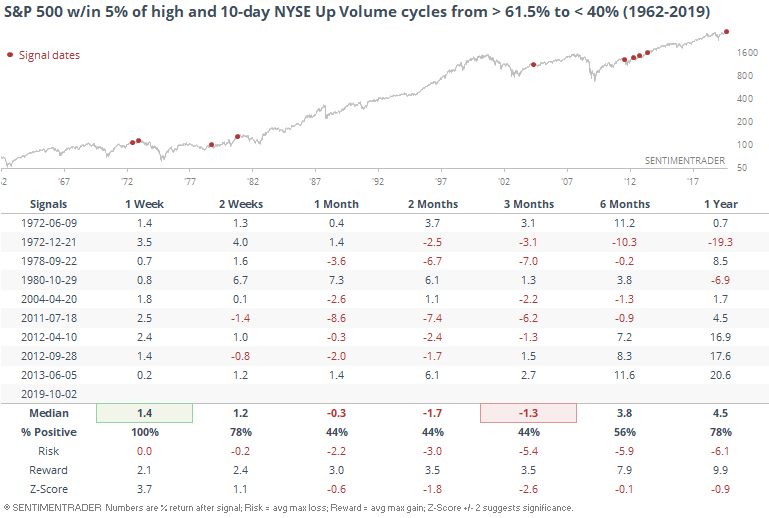
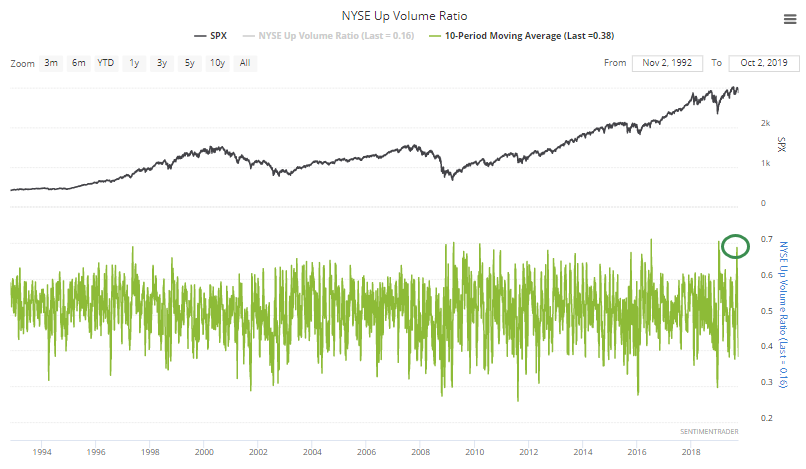
If we look at a 10-day simple moving average of the NYSE Up Volume Ratio, it has gone from above 61.5% (Zweig's cutoff) to below 40% in less than 3 weeks.
If positive breadth thrusts indicate a return of eager buying interest, then the Anti-Zweig should prove to be the opposite. One could kinda-sorta make that claim, but it's dubious.
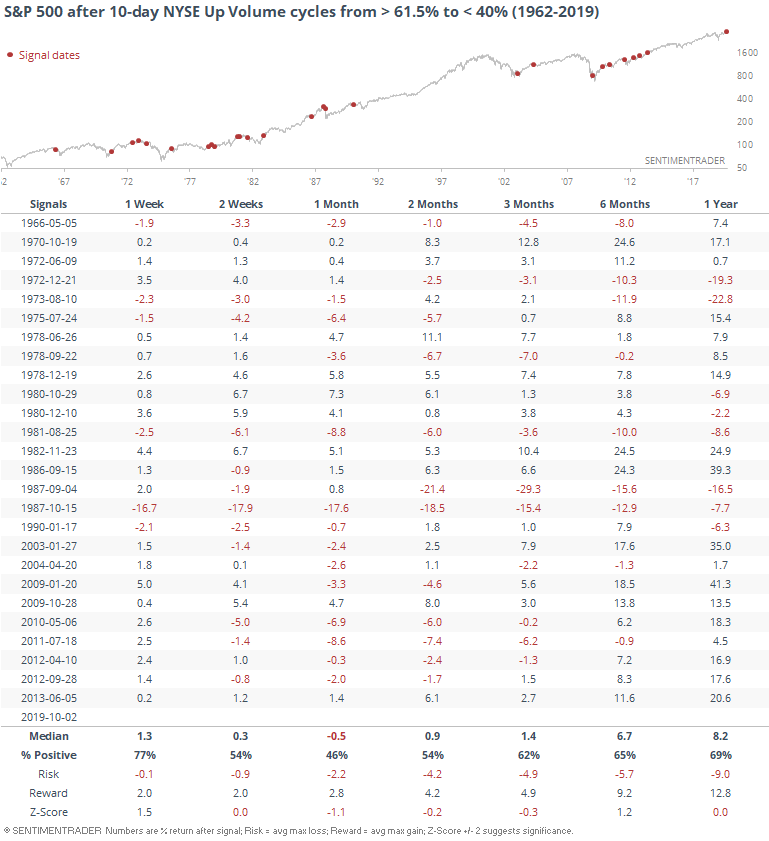
If we filter the table to only include signals that triggered when the S&P was still within 5% of its peak, returns degraded over the next 1-3 months.
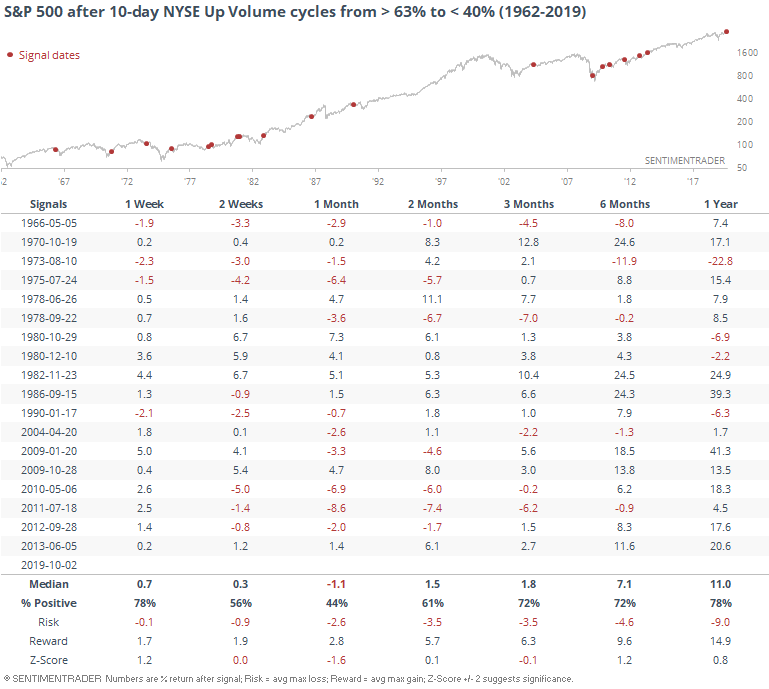
But this ignores just how extreme our current case is. The 10-day average didn't just reach 61.5% over the past few weeks, it was higher than 63%. Those cases led to a bit more weakness over the next month, but better returns in the medium- to long-term.

The 10-day average hadn't just eclipsed 63% in late September, it exceeded 65%, one of the highest readings in 25 years.
If we look at selloffs from that extreme of a reading, then the sample size diminishes to only a few.
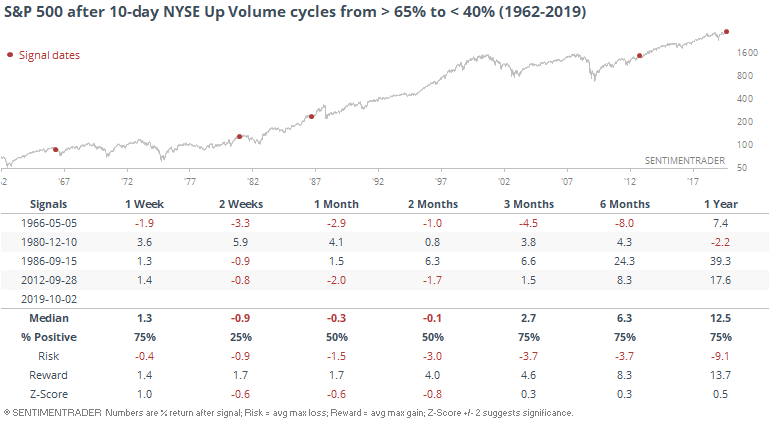
In 1966, this led to a modest decline in the months ahead. The other times, rallies.
Bad Breadth
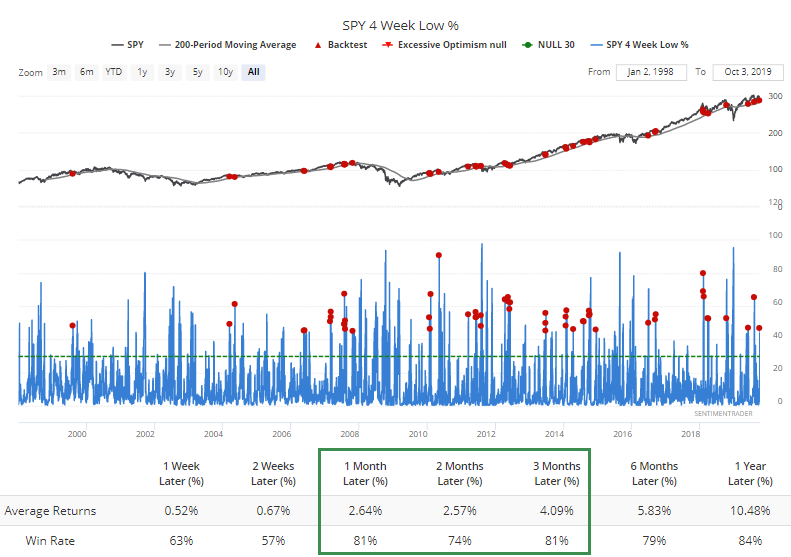
The selling over the past two sessions triggered a number of extremes among indexes and sectors. More than 45% of stocks in the S&P 500 fell to their lowest level in a month, even while SPY is still trading above its upward-sloping 200-day average.
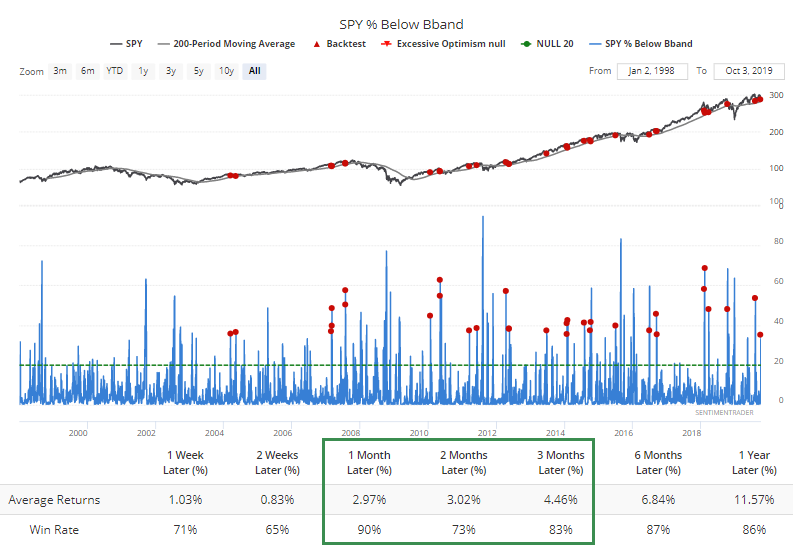
And more than 35% of them fell below their lower volatility bands. During a rising market, that preceded gains 90% of the time a month later.
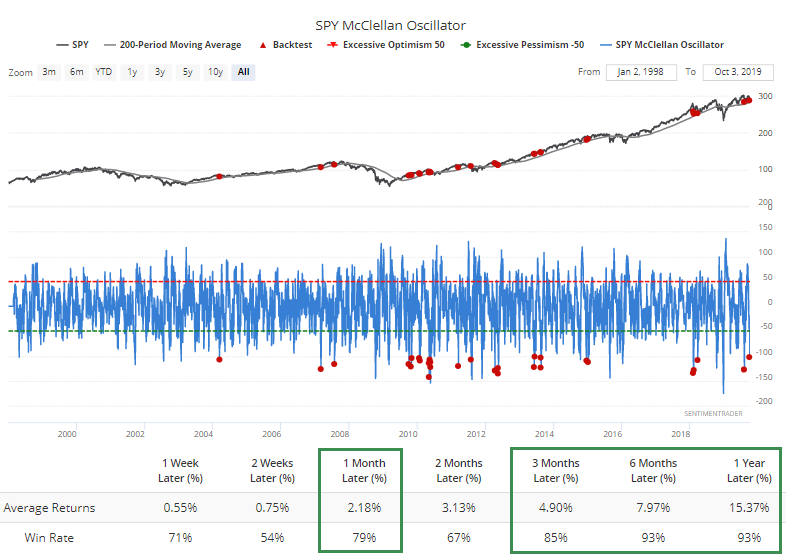
The McClellan Oscillator fell below -100 (again, during a rising market).
Industrial stocks were slapped quickly and hard, pushing more than 60% of them below their Bollinger Bands.
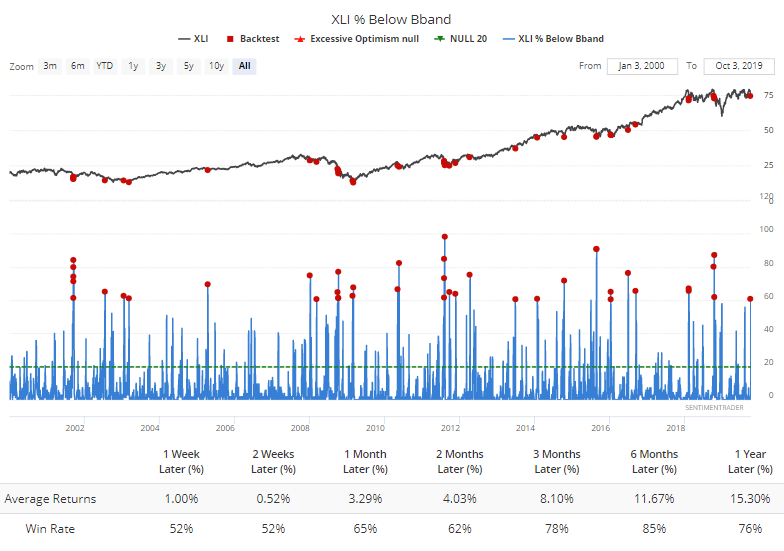
That's led to some pretty impressive returns when XLI was still trading above its upward-sloping 200-day average.
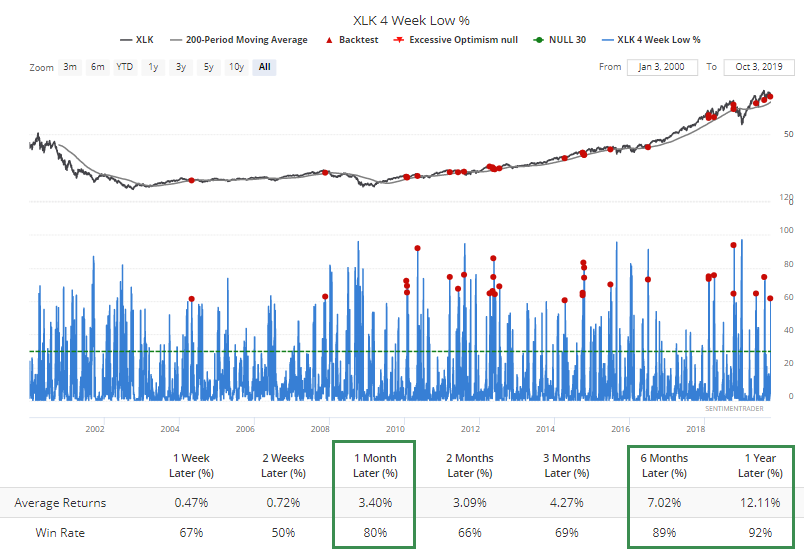
In tech, more than 60% of stocks hit a 1-month low. Again, during a rising market, that has typically preceded snapbacks.
Stressed
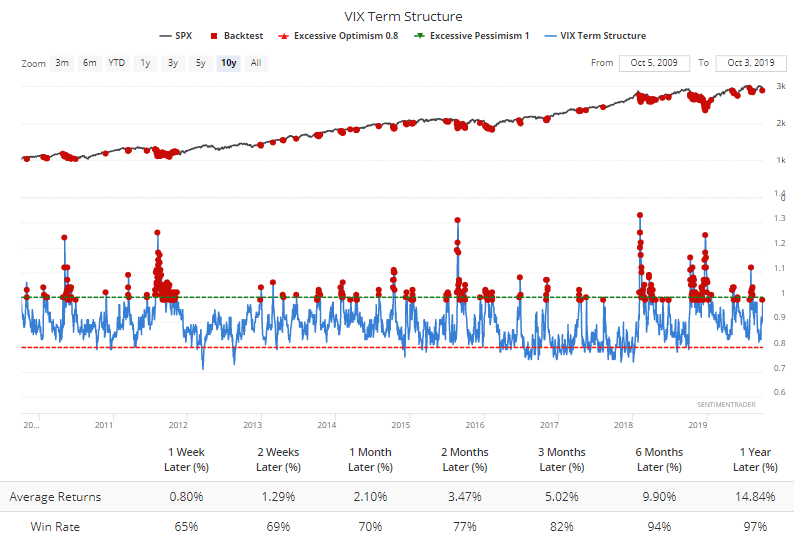
Signs of severe anxiety have popped up quite a few places. The VIX Term Structure has almost inverted.
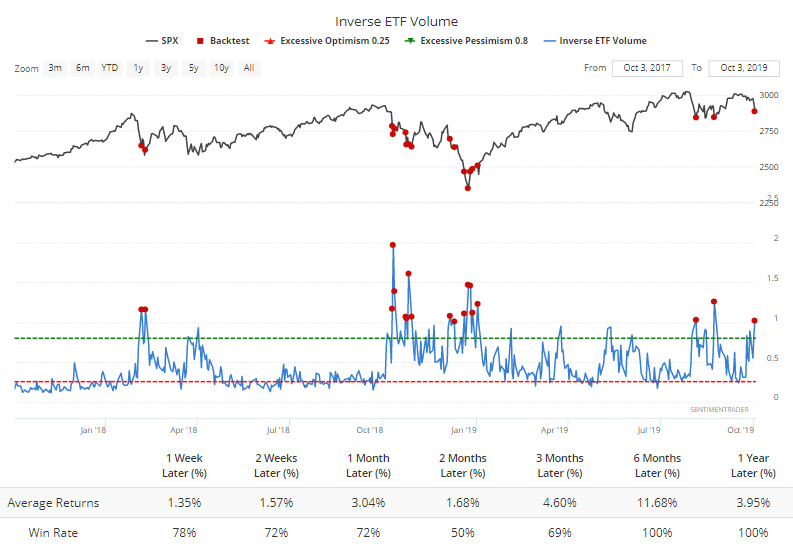
Inverse ETF volume spiked to more than 1% of total NYSE volume.
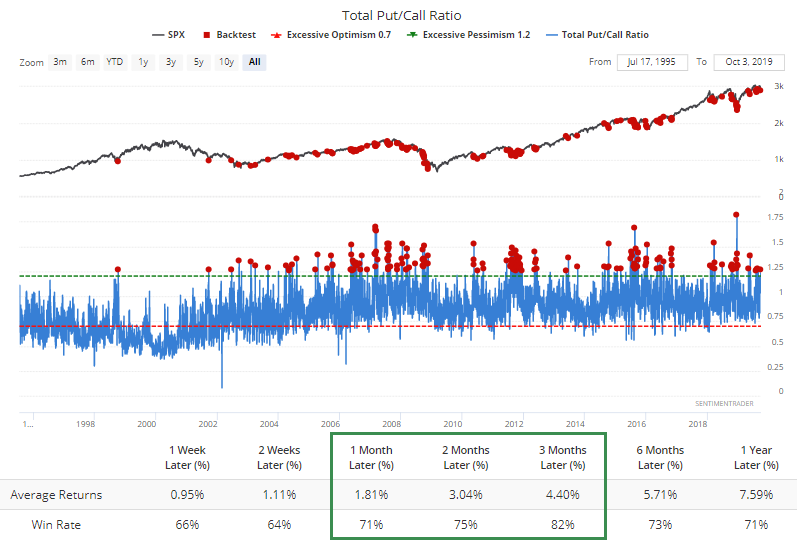
Options traders turned over 25% more puts than calls.
As Troy noted, there was also a spike in the VIX put/call ratio. He also made a great point about the focus on the current obsession with the manufacturing data.
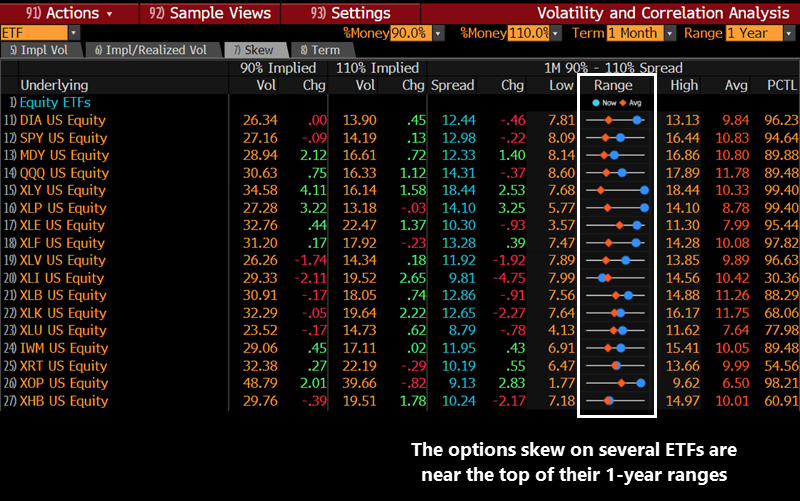
We can also see some anxiety in the skew in some of the most popular index and sector ETFs, many of which are in the top 5% - 10% of readings over the past year.