
TradingEdge: Short-term speculation within long-term recovery

This is a recap of the most notable research published during the week.
Even more than in prior weeks, there has been an impressive recovery in price and breadth over a sustained time frame. That has almost always led to higher prices for stocks over the longer-term. Shorter-term, there are still signs of the kind of speculative activity that normally precedes a short- to medium-term pullback.
If there is a piece of research that hadn't been published by Friday, then you'll see a [NEW] tag.
Sentiment has mostly recovered, with some exceptions
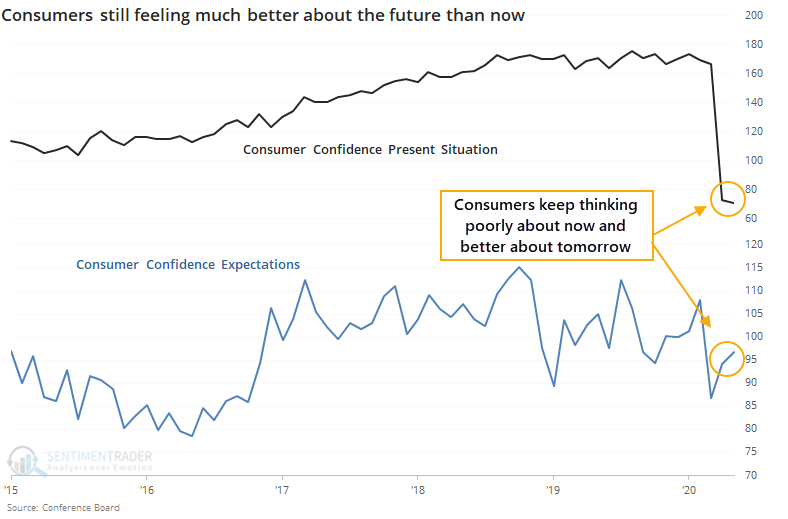
The latest release on consumer confidence from the Conference Board shows further evidence that Americans are feeling much better about the future than they are about the here-and-now.
Responses for May show that consumers' attitudes about their present conditions dropped again and are the lowest since 2013. Meanwhile, their expectations about the future rose from where they were in April.
Because of that tendency to see iffy returns over the medium-term, it's not a strong buy signal. The risk/reward is good even up to a year later, though, so it's certainly not a reason to sell. Opinions will vary on whether the confidence figures favor bulls or bears; the evidence suggests it's a very slight tailwind for the former.
The positive market further encouraged small options traders. For the week ended May 22, they used more than 45% of their total volume on buying speculative call options, on par with the highest levels of aggressive betting in 15 years. Prior to that, it only happened in the year 2000. For the latest week, ending May 29, it didn't change much at all.
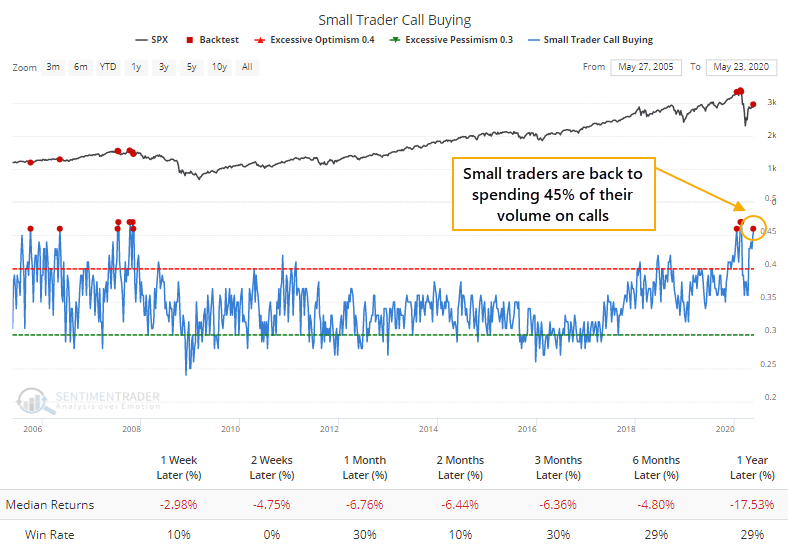
The contrary record of small trader call buying activity is much better than their futures positioning (which is showing a large short position), and we'd give that a lot more weight. Even the couple of times they were buying a lot of calls that weren't confirmed by their futures positions led (at some point) to a decline. Overall, it's not a clear warning sign like it would be if their options and futures positions were more in alignment, but we'd still consider it a negative.
Overall, sentiment was extremely pessimistic in March and is now bouncing back - various sentiment indicators are back to neutral.
The Smart Money/ Dumb Money Confidence Spread has crossed below 0. When it cycled from extreme pessimism to neutral over a 3 month period, the S&P 500's returns over the next 3 months were more bearish than random. Granted, most of the bearish cases occurred when the market was still in a bear market, and in a bull market this wasn't bearish.
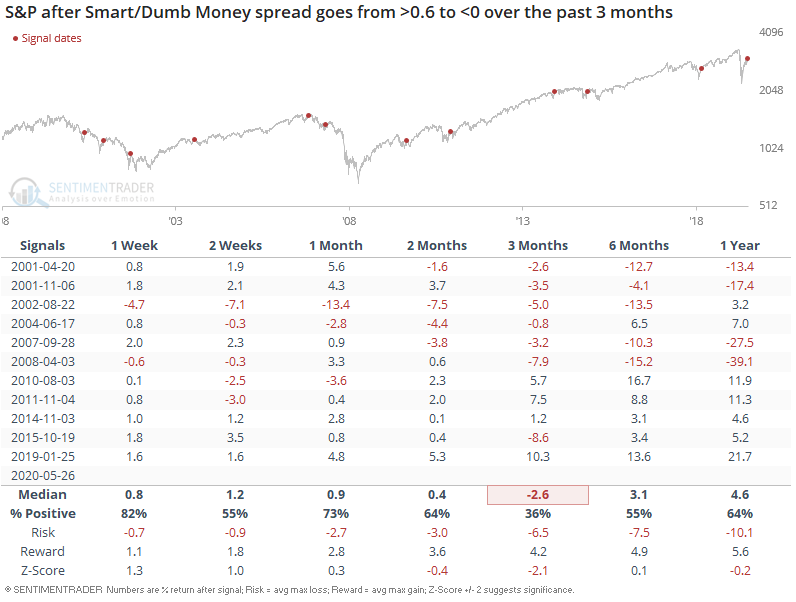
If we only look at the cases when this occurred after the S&P was recently in bear market territory, the S&P was consistently bearish over the next 2-3 months.
Most stocks have regained their medium-term trends (but not long-term ones)
With Tuesday's jump, an overwhelming number of stocks have moved into medium-term uptrends. It's not just the S&P 500 - many other indexes, both domestic and overseas, are seeing similar surges.
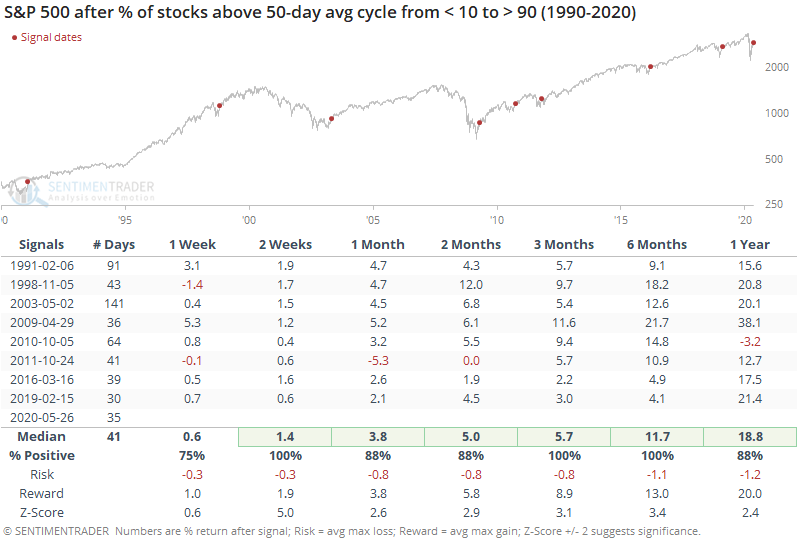
Looking at the most benchmarked index in the world, fewer than 10% of stocks were trading above their averages 35 days ago and now more than 90% of them are. When it cycles from one extreme to the other like this, it has preceded further medium-term gains every time and the risk/reward ratio was ridiculously positive.
As of Wednesday, 95% of S&P stocks were above their 50-day average but only 43% were above their 200-day, so the spread between them was more than 50%. That's the 2nd-highest in 30 years, next to January 2009. Forward returns were shaky in the shorter-term, but positive over the next 6-12 months every time.
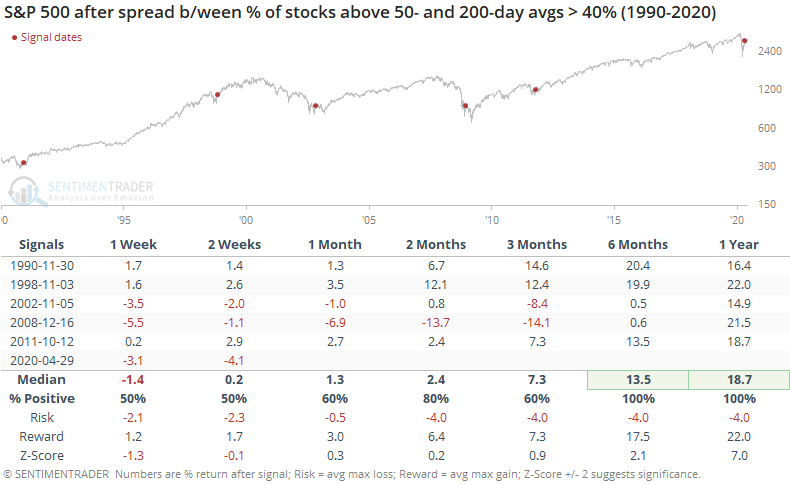
It's extremely hard to ignore the positive implications of this, even though we haven't seen much of the digestion that normally comes after an initial recovery.
So, how do we reconcile that against some of the negatives that have popped up, especially the surge in speculative activity? Sometimes, we simply can't. There are a couple of times in most years when everything we look at tilts a certain direction, which makes having high confidence in an outlook "easy." This is not one of those times. We'd still give more weight to the negatives over the short- to medium-term but the positives medium- to long-term.
Stocks continue to rally around the world, pushing the first of global stock indices above their 200-day average. For 2 months every major countries' stock index was under its 200-day average, and this is no longer the case as the S&P 500 has broken above its own.
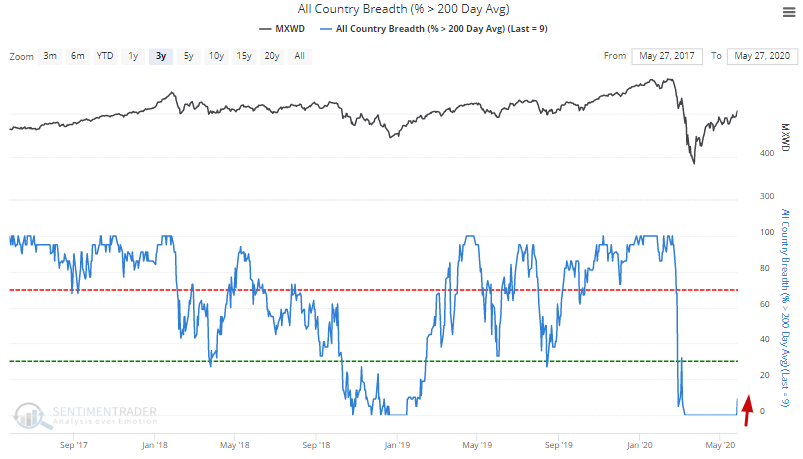
When long streaks of every stock market being in a downtrend ended in the past, the S&P 500 and other equity markets around the world usually pushed higher over the next 6-12 months.
On a shorter time frame, the global stock market's rally has pushed more stocks to 8-week highs. For example, the S&P 500 has swung from bear market territory (-20% below 1-year highs) to more than 33% of its members at an 8 week high:
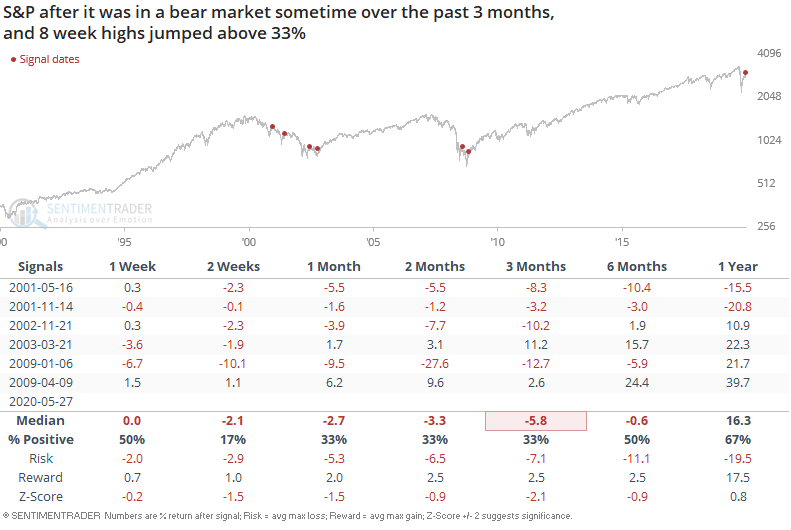
When this happened in the past, the S&P's returns over the next few weeks and months were mostly bearish. Historical cases that occurred when the market was still in a bear market were bearish, and historical cases when the bear market was over were mixed.
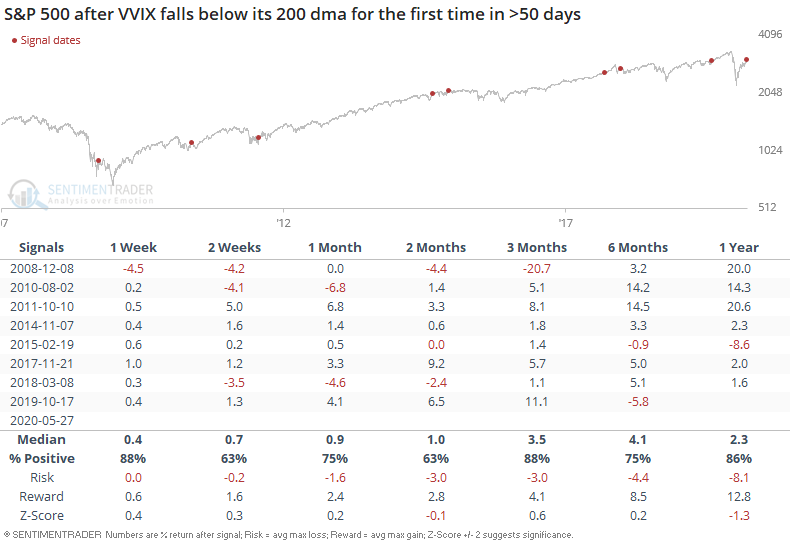
[NEW] Troy notes that the stock market's relentless push higher has caused volatility to drop. VIX and VVIX (volatility of volatility) are falling after one of the largest spikes in history. This has pushed VVIX below its 200 dma for the first time in more than 50 days:
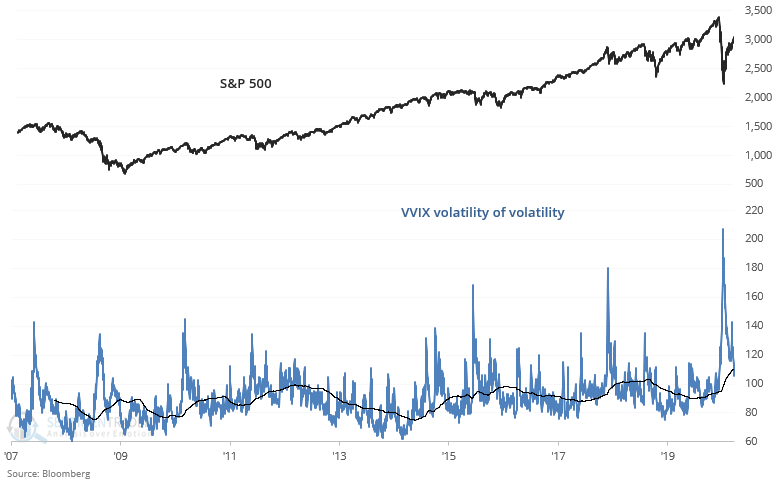
It's easy to assume (from a contrarian perspective) that stocks should fall because they've rallied "too much" and volatility should jump because it has fallen "too much". But that hasn't always been the case, at least historically. On the contrary, the S&P rallied more often than not over the next week. Granted, all the bullish cases have occurred within the context of a bull market, so it's hard to consider this to be a bullish factor for stocks.
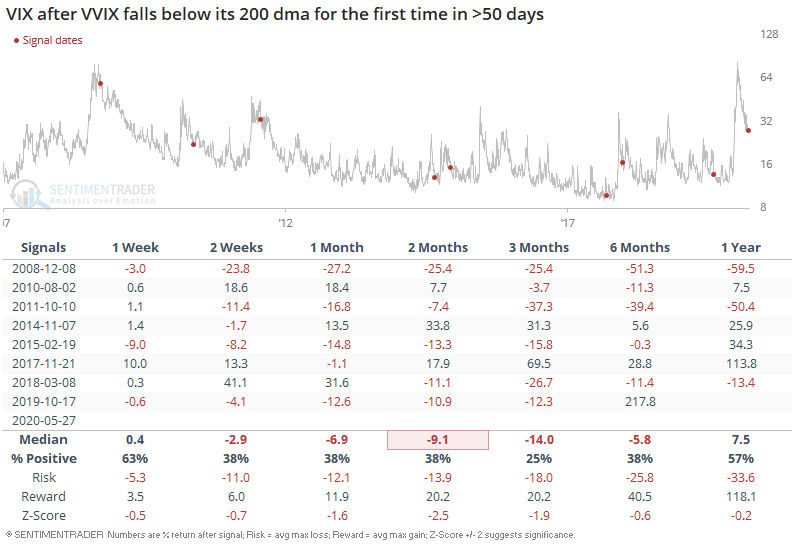
This wasn't a consistent bullish factor for VIX, as VIX usually fell even more over the next 2-3 months:
Historic 2-month rallies
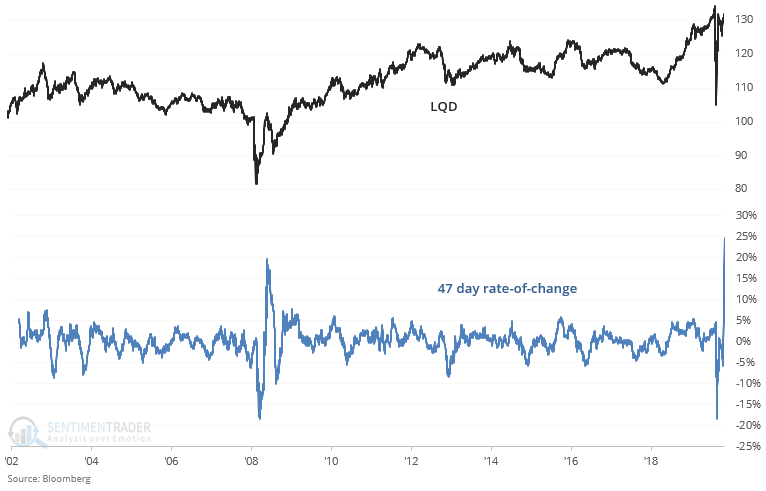
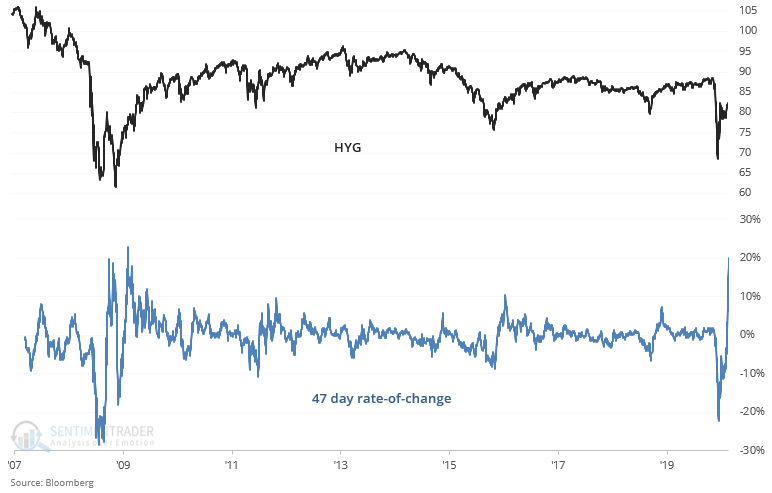
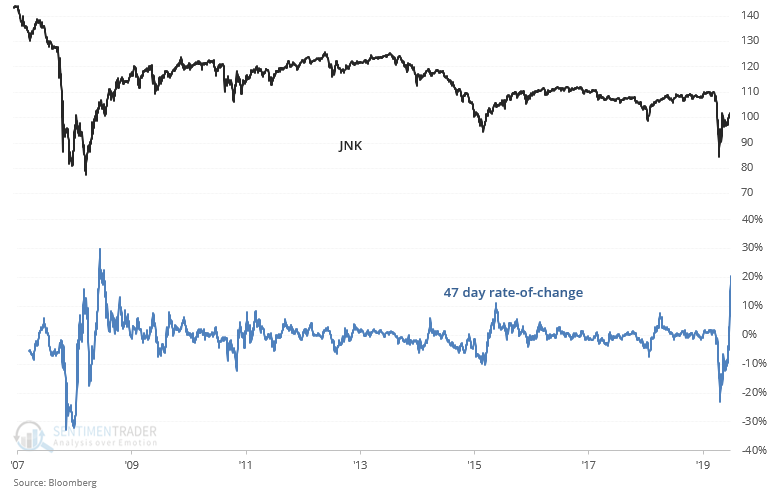
[NEW] Troy shows that Bloomberg noted that the Fed has been buying bond ETFs in its bid to save the global financial markets. This is among the largest 47-day spikes in the history of LQD, HYG, and JNK:
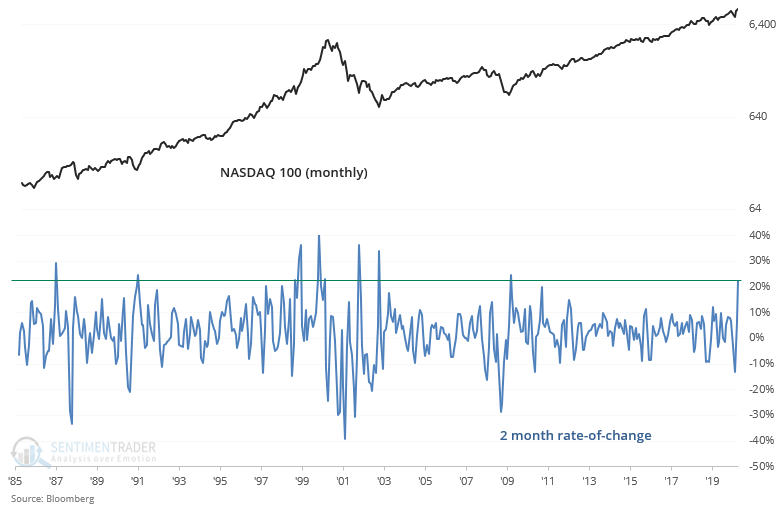
While the Fed has been buying up corporate bond ETFs, investors and traders have been enamored with tech stocks. On a monthly chart basis, both the NASDAQ 100 and NASDAQ Composite have made an all-time monthly closing high.
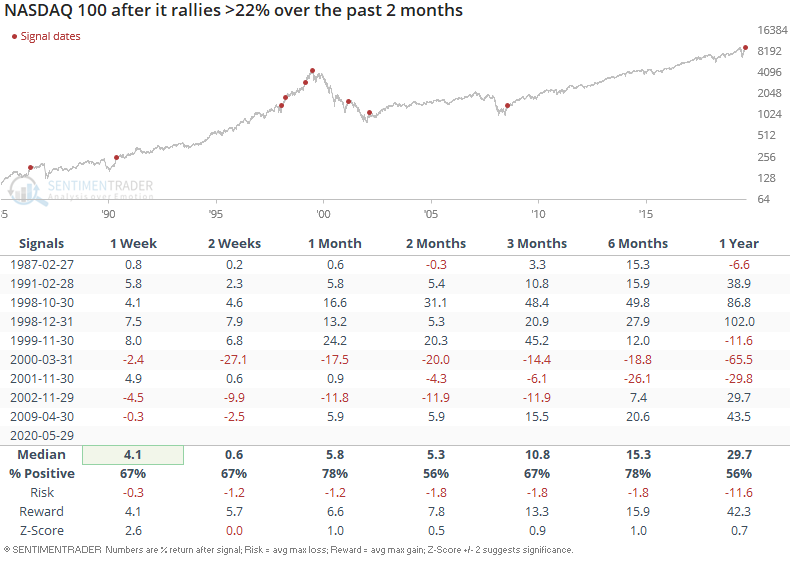
The NASDAQ 100's rally over the past 2 months has been spectacular (+22%), and has only been matched several times from 1985-present:
This has been a consistent bearish factor over the past 20 years as the NASDAQ Composite always pulled back over the next few weeks/months, regardless of whether it was a bull market or bear market:
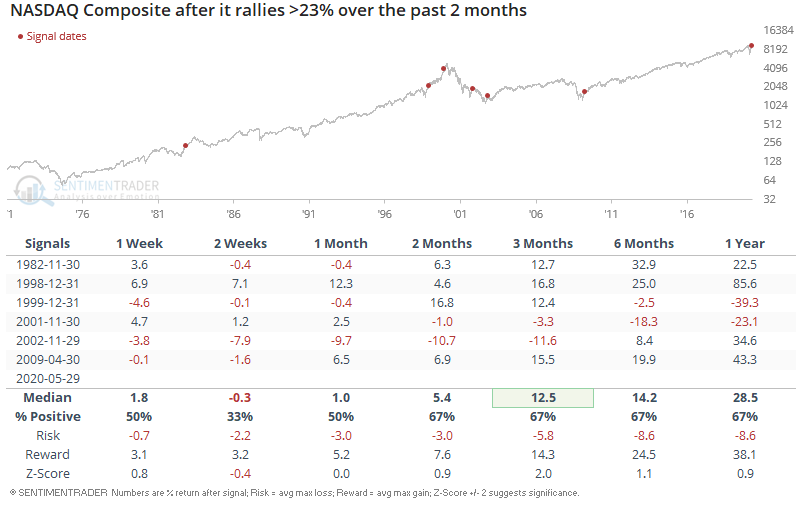
Similarly, this has been one of the largest 2-month spikes in the NASDAQ Composite ever:
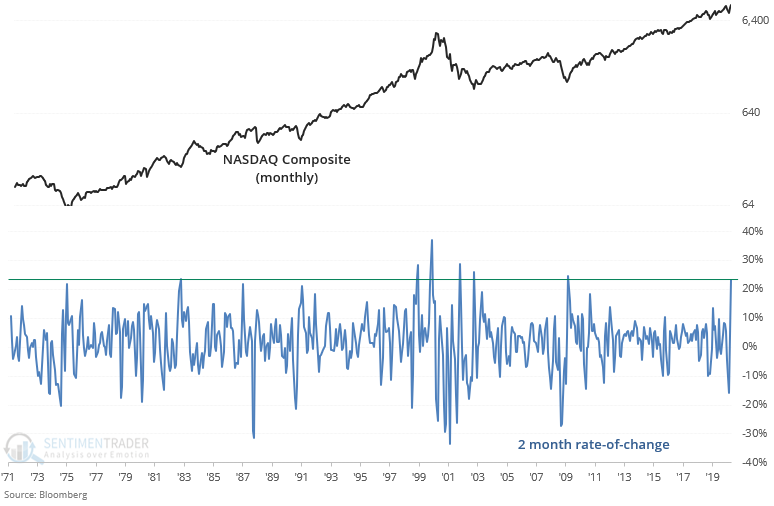
Similar spikes usually led to a pullback in the NASDAQ Composite over the next 2 weeks:
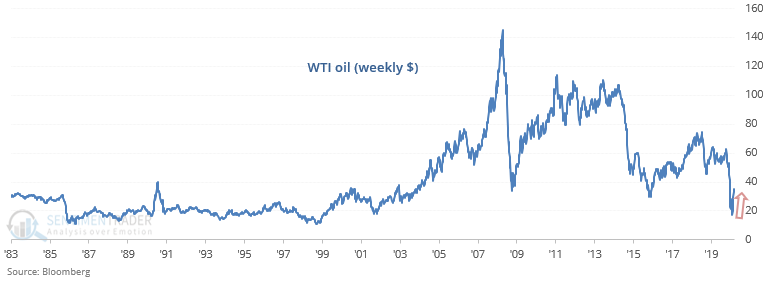
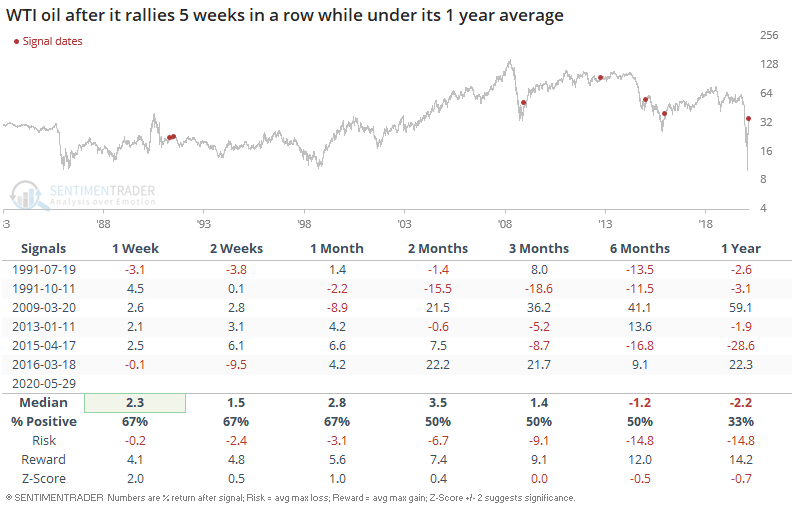
The recovery in global markets is broad, with oil rallying 5 weeks in a row after one of the biggest oil plunges in history.
When oil rallied 5 weeks in a row while below its 1-year average, oil could rally further in the short term. But on a 1-year forward basis, this wasn't a clear sign that oil would rally even further.
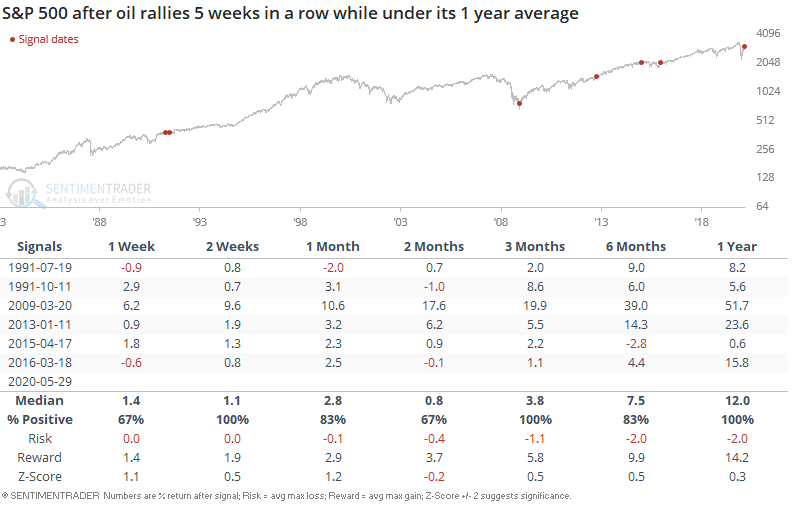
As for the S&P, it was mostly a bullish sign over the next 3-12 months as the recovery in oil prices signified a recovery in the global economy:
It's hard to ignore the positive implications of the price and breadth recovery, even though we haven't seen much of the digestion that normally comes after the initial kick-off. How do we reconcile that against some of the negatives that have popped up, especially the surge in speculative activity? Sometimes, we can't. There are a couple of times in most years when everything we look at tilts a certain direction, which makes having high confidence in an outlook "easy." This is not one of those times. We'd still give more weight to the negatives over the short- to medium-term but the positives medium- to long-term.