Data &
Technology
Research
Reports
Report Solutions
Reports Library
Actionable
Strategies
Free
Resources
Simple Backtest Calculator
Simple Seasonality Calculator
The Kelly Criterion Calculator
Sentiment Geo Map
Public Research Reports
Free Webinar
Pricing
Company
About
Meet Our Team
In the News
Testimonials
Client Success Stories
Contact
Log inLoginSign up
< BACK TO ALL REPORTS

So many recoveries in trend, it's historic

Jason Goepfert
2020-05-28
A near-record number of stocks within the S&P 500 have recovered above their 50-day averages relative to their 200-day averages. The S&P index itself has moved from more than 25% below its 50-day to more than 10% above. And the S&P joined the Nasdaq as the two indexes leading the "big four" out of a major decline.

We've spent a lot of time looking at the 50- and 200-day moving averages over the past week, and this will likely be one of the last posts about it for a long while. This form of looking at the market has become wildly popular lately and while that doesn't mean it's no longer effective, it's certainly becoming less unique.

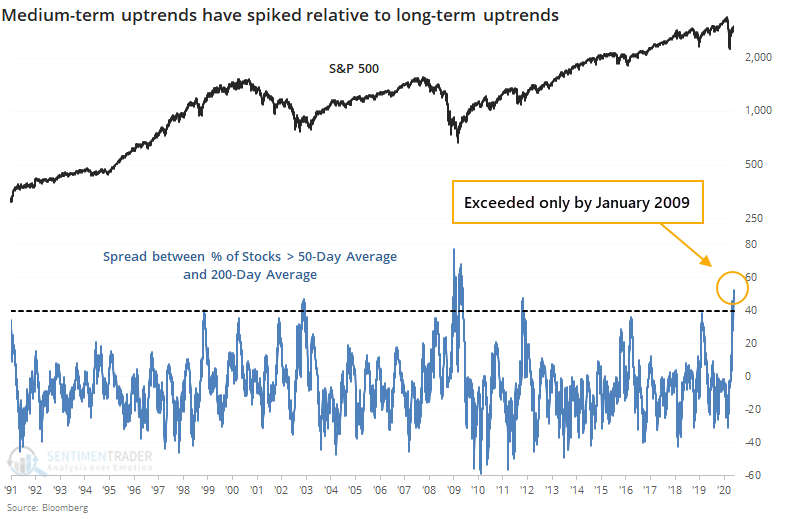
As we saw on Wednesday, there has been a surge in stocks within the S&P 500 rising above their 50-day moving averages but relatively few have climbed above their 200-day averages. As of Wednesday, 95% of S&P stocks were above their 50-day average but only 43% were above their 200-day, so the spread between them was more than 50%. That's the 2nd-highest in 30 years, next to January 2009.

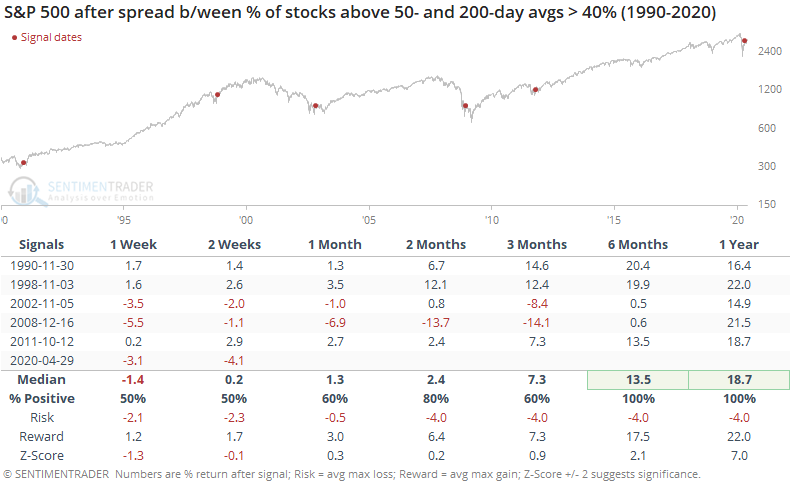
By the time the spread hit 40%, it indicated moments of medium-term upside momentum during markets that were showing longer-term struggles. As a result, forward returns were shaky in the shorter-term, but positive over the next 6-12 months every time. When the spread got this high in 2009, it indicated only the beginning of the long-term bottoming process.

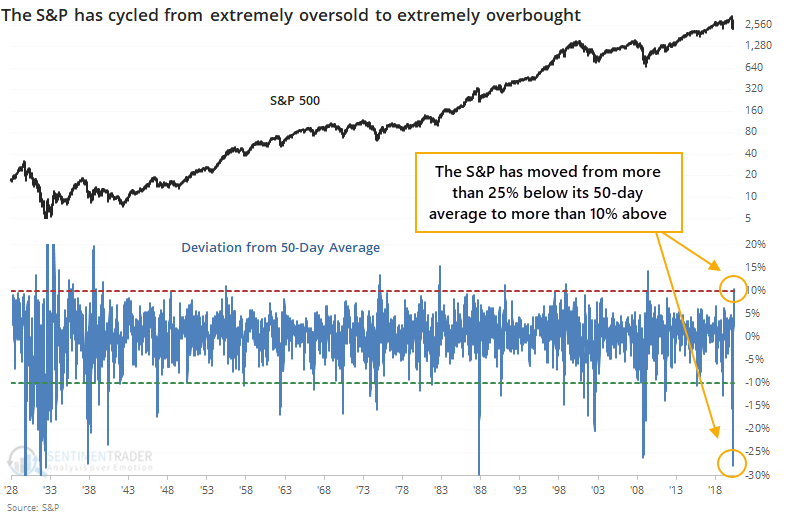
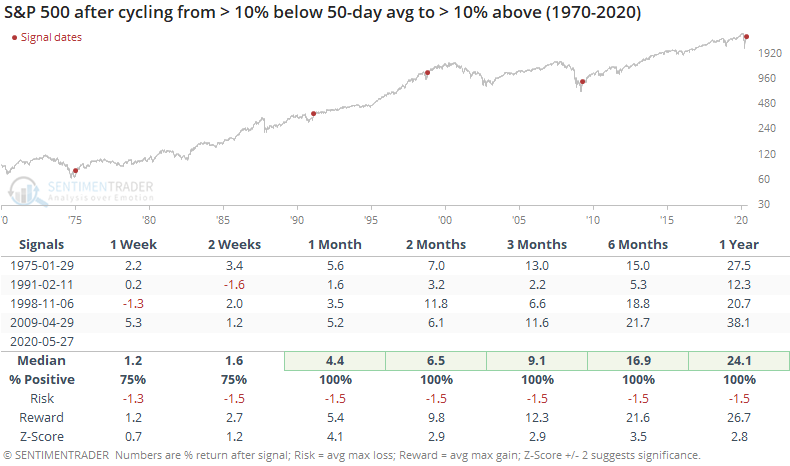
For the S&P 500 index itself, it has cycled from more than 25% below its 50-day moving average, one of the most oversold readings in history, to more than 10% above, one of the most overbought.

If we look at lesser extremes, times when it moved from 10% below to 10% above, then we get the following.

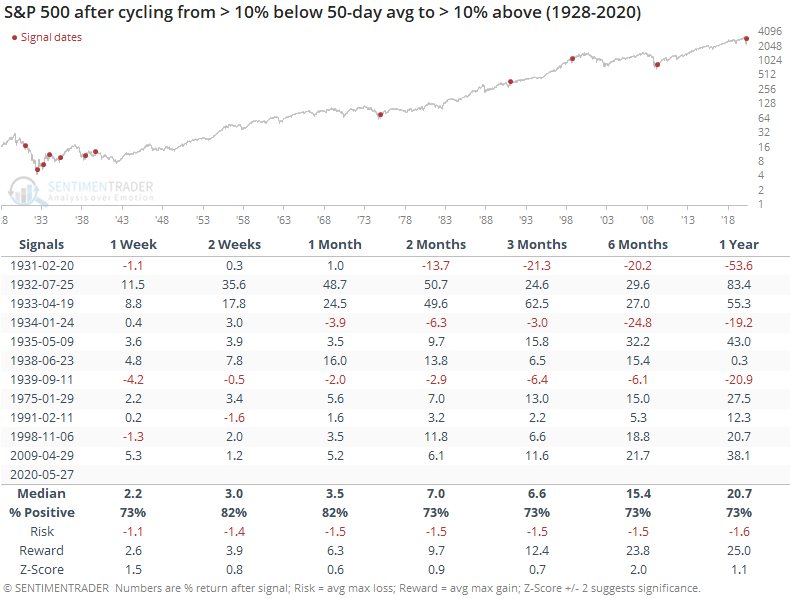
Returns were mixed-to-positive, but the negatives were due to the 1930s. If we make the assumption that lessons have been learned and we're not going to repeat some of those same mistakes, then we can focus on the post-1930s era. Those forward returns were pristine.

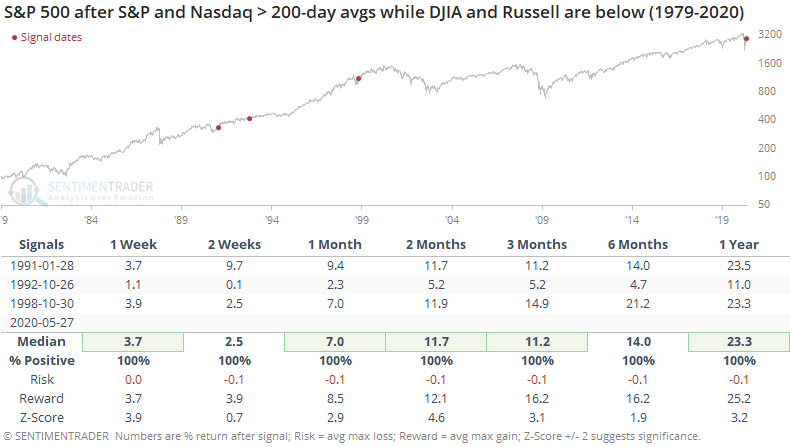
The S&P 500 and Nasdaq Composite are the first of the "big four" equity indexes to trade above their 200-day averages. The Dow Industrials and Russell 2000 remain below. When the S&P and Nasdaq led the other two out of declines, it was a good sign the few other times it happened.

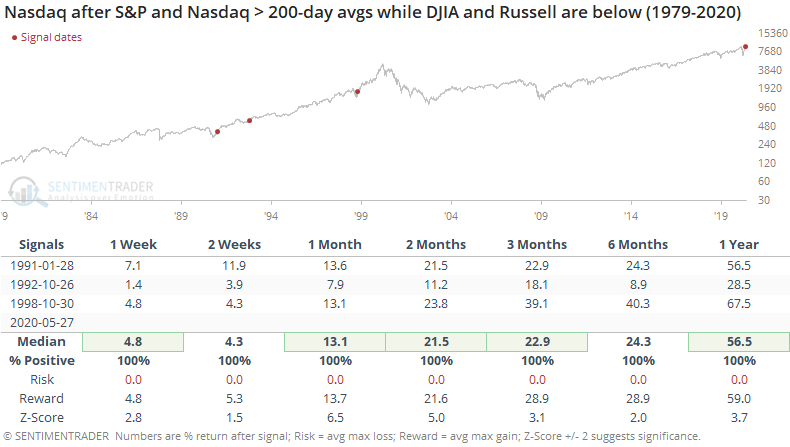
For the Nasdaq, it was an even better signal. Those one-year returns and risk/reward skews are impressive, with the caveat that the sample size is minuscule.

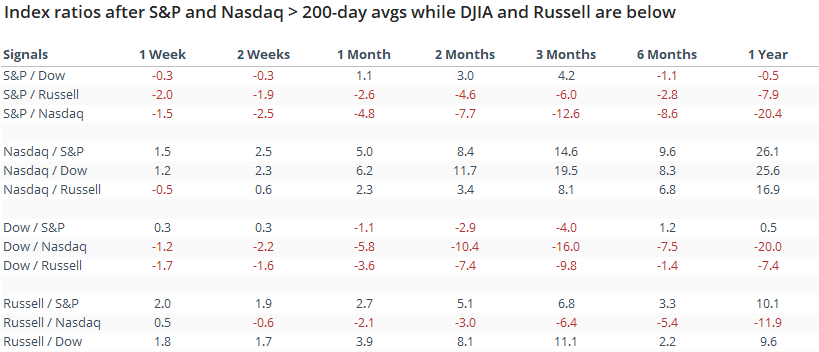
Comparing all four indexes to each other, the Nasdaq consistently outperformed the others. The Russell also tended to do well. The S&P and Dow consistently under-performed.

The overall takeaway from the indexes and stocks recovering above their medium- and long-term averages is that this kind of behavior, to this degree, have typically only come during long-term recoveries, with excellent medium- to long-term returns. The short- to medium-term was more of a question.

Sorry, you don't have access to this report

Upgrade your subscription plan to get access
Go to Dasboard
DATA &
TECHnologies
IndicatorEdge
‍
BackTestEdge
‍
Other Tools
‍
DataEdge API
RESEARCH
reports
Research Solution
‍
Reports Library
‍
actionable
Strategies
Trading Strategies
‍
Smart Stock Scanner
‍
FREE
RESOUrCES
Simple Backtest
Calculator
Simple Seasonality
Calculator
The Kelly Criterion
Calculator
Sentiment Geo Map
‍
Public Research Reports
‍
Free Webinar
COMPANY
‍
About
‍
Meet our Team
‍
In the News
‍
Testimonials
‍
Client Success Stories
Pricing
Bundle pricing
‍
Announcements
‍
FAQ
© 2024 Sundial Capital Research Inc. All rights reserved.
Setsail Marketing
TermsPrivacyAffiliate Program
Risk Disclosure: Futures and forex trading contains substantial risk and is not for every investor. An investor could potentially lose all or more than the initial investment. Risk capital is money that can be lost without jeopardizing ones’ financial security or life style. Only risk capital should be used for trading and only those with sufficient risk capital should consider trading. Past performance is not necessarily indicative of future results.

Hypothetical Performance Disclosure: Hypothetical performance results have many inherent limitations, some of which are described below. No representation is being made that any account will or is likely to achieve profits or losses similar to those shown; in fact, there are frequently sharp differences between hypothetical performance results and the actual results subsequently achieved by any particular trading program. One of the limitations of hypothetical performance results is that they are generally prepared with the benefit of hindsight. In addition, hypothetical trading does not involve financial risk, and no hypothetical trading record can completely account for the impact of financial risk of actual trading. for example, the ability to withstand losses or to adhere to a particular trading program in spite of trading losses are material points which can also adversely affect actual trading results. There are numerous other factors related to the markets in general or to the implementation of any specific trading program which cannot be fully accounted for in the preparation of hypothetical performance results and all which can adversely affect trading results.

Testimonial Disclosure: Testimonials appearing on this website may not be representative of other clients or customers and is not a guarantee of future performance or success.