
TradingEdge: Questionable participation, a historic Nasdaq run, consumer attitudes

This is a recap of the most notable research published during the week.
The main themes are (mostly) formerly high optimism during a still-unhealthy market environment, with relatively few stocks, industries, sectors, and countries holding above their 200-day moving averages. The biggest positive is that we saw many readings of high - even historic - momentum during April and May, which are starting to return to normal ranges, That is very often a good medium- to long-term sign. We're also seeing multiple extremes in the performance and weight of tech and growth stocks relative to other parts of the market.
If there is a piece of research that hadn't been published by Friday, then you'll see a [NEW] tag.
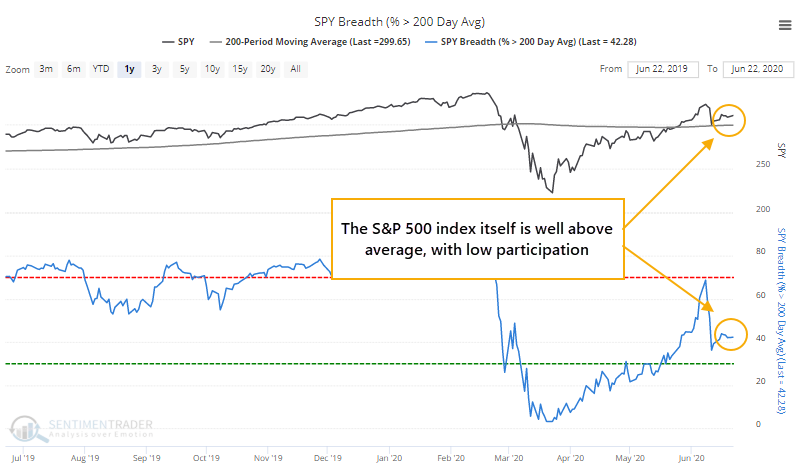
Still seeing too few stocks holding above long-term averages
The S&P moved to more than 3% above its 200-day average, and yet less than half of stocks within the index have managed to climb above their own averages. As we saw last week, this is a theme across industries, sectors, and world indexes.
In 30 years, the only other time this happened included a handful of days from 1998 - 2000. If the S&P was above its 200-day average by any amount, while fewer than 45% of its members were above their averages, then that only happened in 2007, and 1999 prior to that.
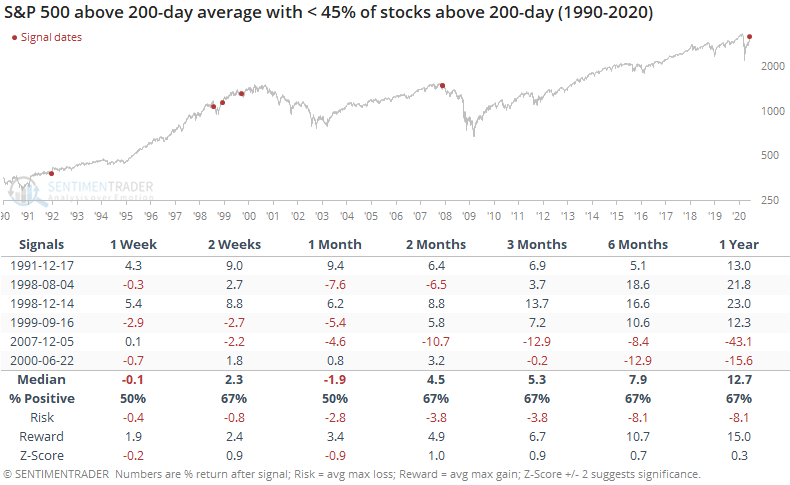
The sample size is too small to suggest it's a sign of a peak, and while the 2007 instance stands out, it was way too early to become bearish in 1999.
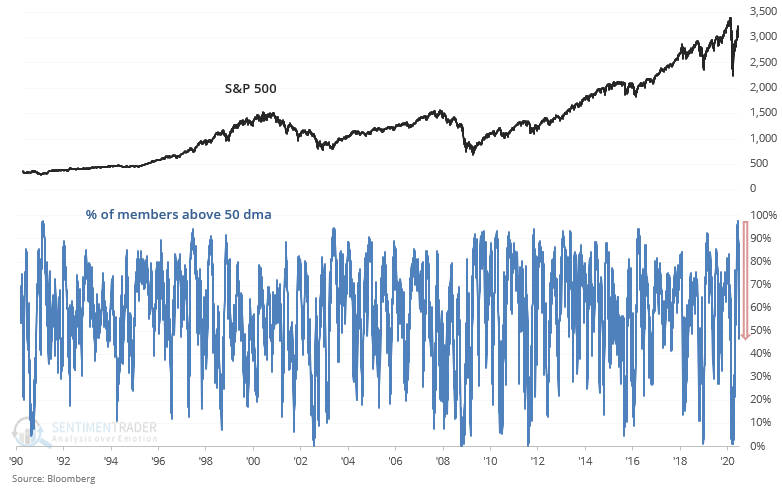
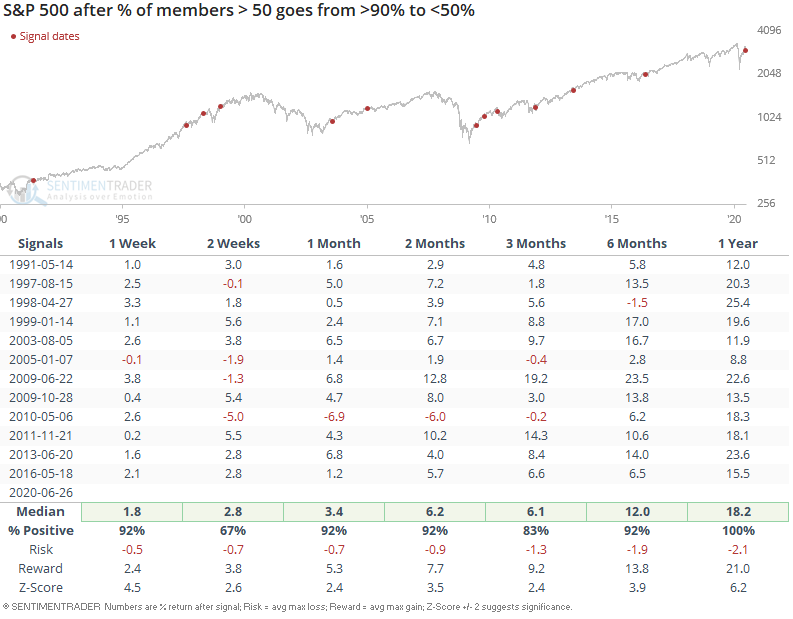
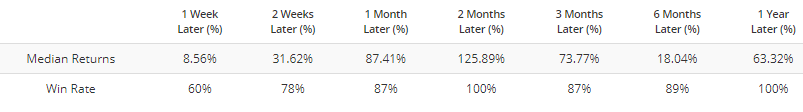
[NEW] On the bright side, Troy notes that a month ago, more than 90% of S&P 500 members were above their 50-day moving averages. But now that the U.S. stock market's rally is starting to falter, this figure has dropped below 50%, as more than half of the S&P's members are below their medium-term average.
When this happened in the past, it wasn't a clear bearish factor for stocks on any time frame. Such pullbacks after extreme momentum led to further gains for the S&P in the weeks and months ahead with only a couple of small losses from 3 months forward, and long-term gains every time.
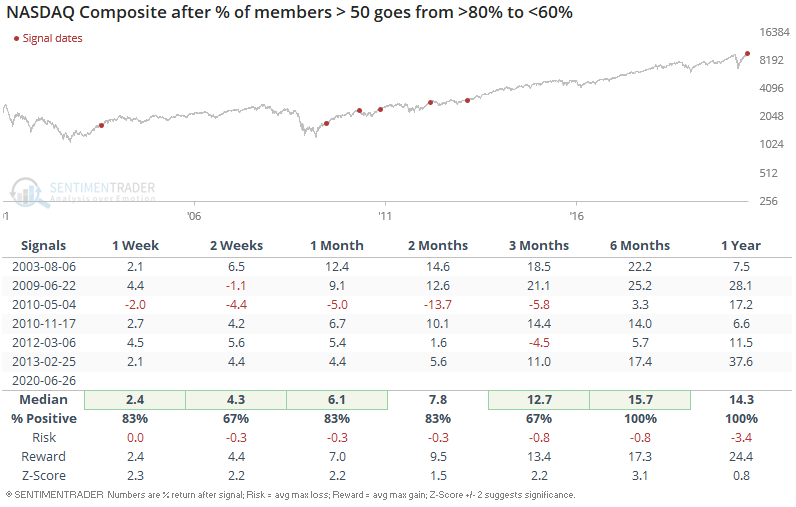
Similarly, the % of NASDAQ Composite members above their 50-day average has slipped from the highest level ever.
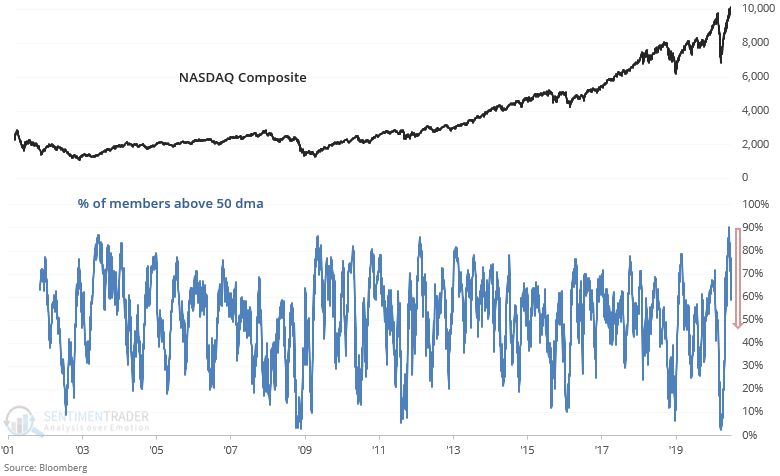
Weakening breadth after strong momentum did not usually lead to a sustained pullback/correction, as the NASDAQ Composite usually pushed higher.
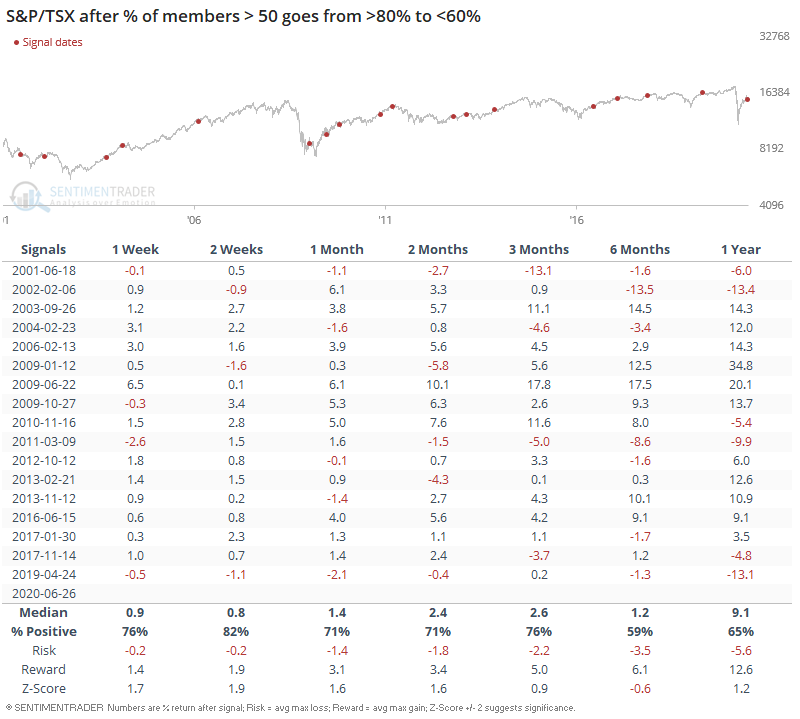
Up north in Canada, the % of S&P/TSX equities above their 50-day average has fallen from similar extreme readings.
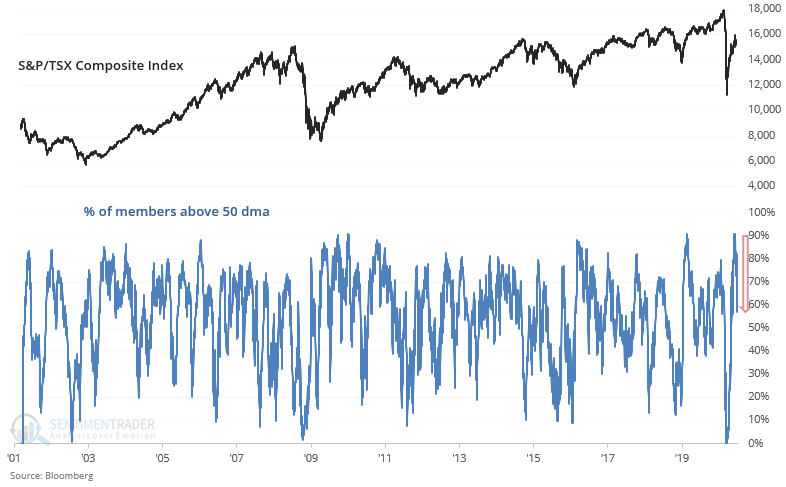
Once again, this was not consistently bearish for Canadian equities on any time frame, but it was not as bullish as similar studies are in the U.S.
Tech and growth stocks have become king of the hill
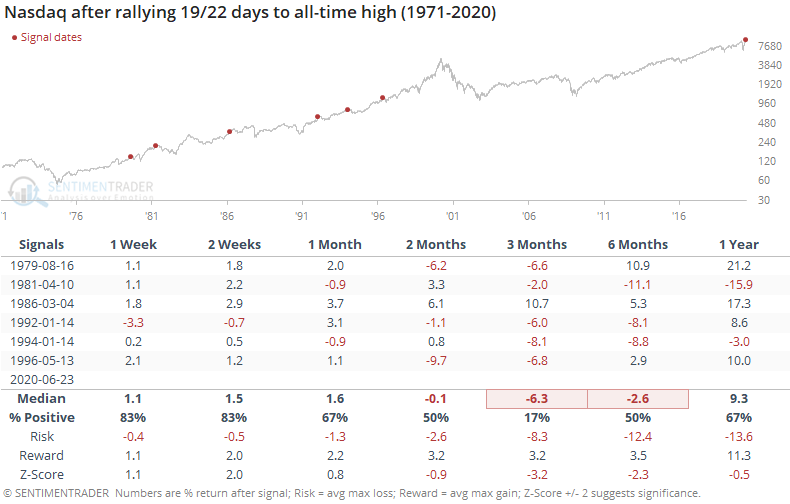
The Nasdaq Composite rallied 19 out of 22 days heading into Wednesday. That's a tie for the best streak in almost 25 years.
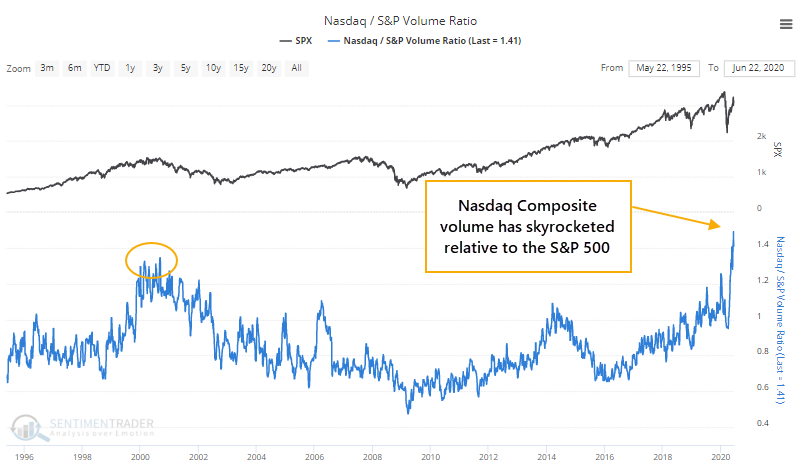
Its volume has jumped relative to volume in the S&P 500.
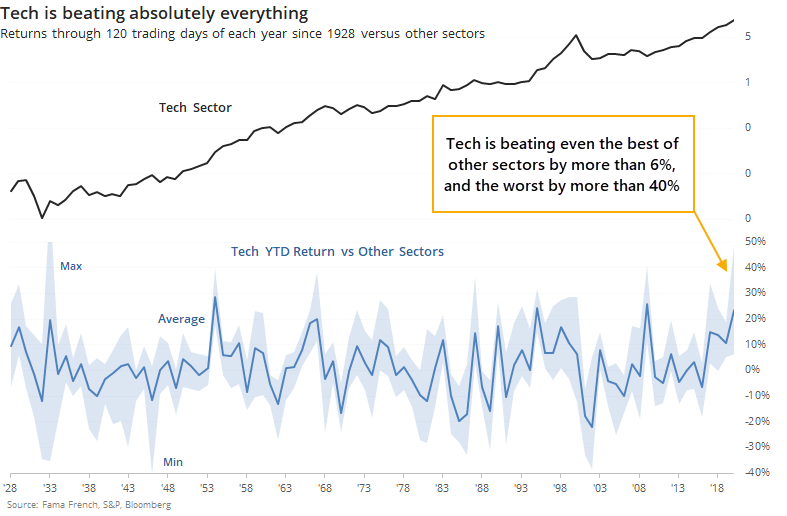
Through 120 trading days so far this year, tech is beating every other major sector by at least 5%. Going back to 1928, there haven't been too many years when tech has been such a winner.
Tech is beating industrial stocks by more than 29% so far this year. Only 2009 saw a greater spread between the two, and that just barely. Other times tech beat this sector by more than 15% through the approximate half-way point of the year, it tended to relatively struggle over the next 3-6 months.
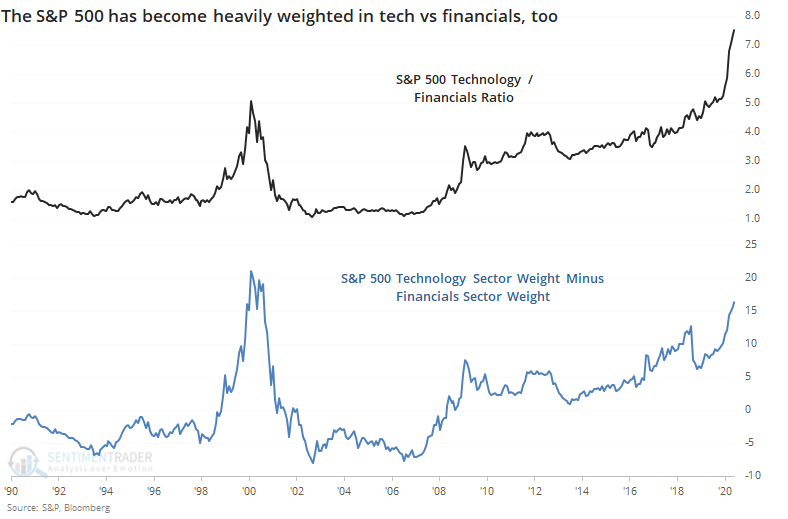
Tech is beating the financial sector by more than 36%, the most ever. The next most extreme outperformance through 120 days was 29% in 2009. Other times it was beating financial stocks by more than 15%, tech had a strong tendency to give back some relative performance.
The difference in investor preferences toward tech and away from other sectors has pushed the weights of these sectors to multi-decade extremes, or nearly so.
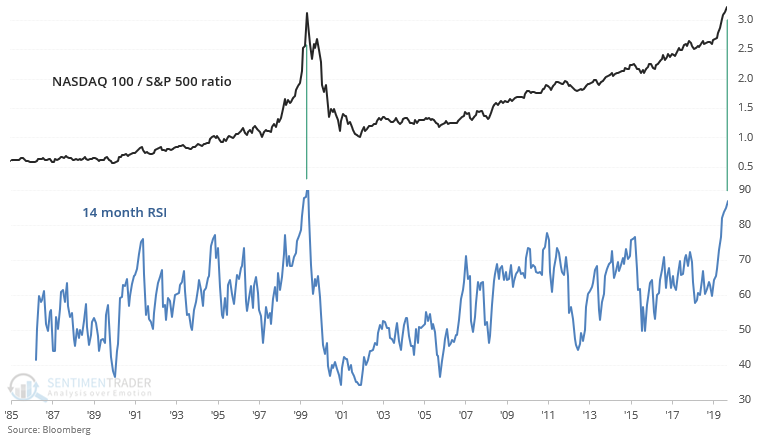
If we just look at the ratio between the Nasdaq 100 (dominated by the big tech firms driving the broader Nasdaq indexes higher) versus the entire S&P 500, the monthly Relative Strength Index (RSI) has been exceeded only one other time.
The ratio between growth vs. value stocks has gone truly parabolic. The MSCI World Growth/Value ratio continues to soar, pushing its 14 month RSI to the highest level ever.
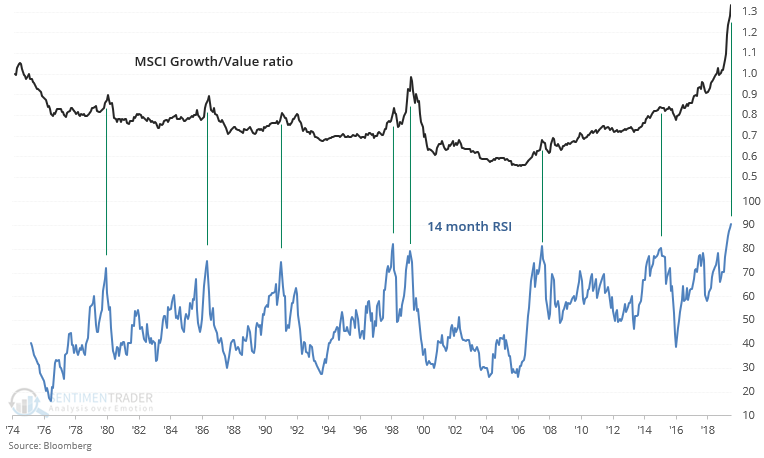
In the past, peaks in the MSCI Growth/Value ratio's 14 month RSI typically led to major problems for the S&P 500 sometime over the next year.
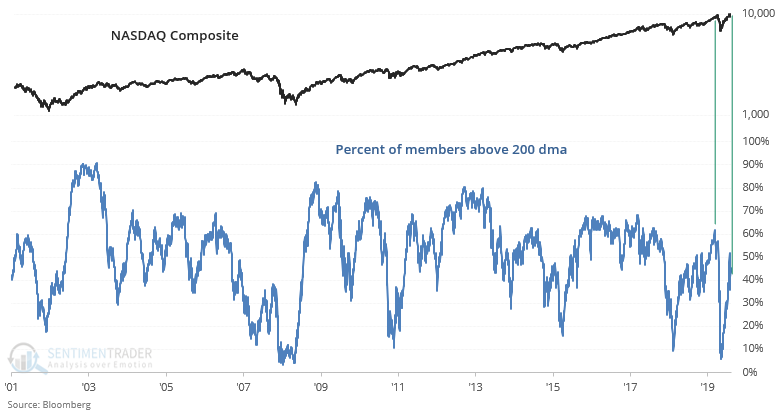
The NASDAQ's non-stop rally, particularly in tech stocks, is driving some comparisons between now and other ominous historical periods. The NASDAQ Composite is more than 16% above its 200-day average while a mere 45% of NASDAQ members are above their own averages. Such weak NASDAQ breadth in the face of such a strong rally has never happened before from 2001-present:
Sentiment is (mostly) skewing toward excessive optimism
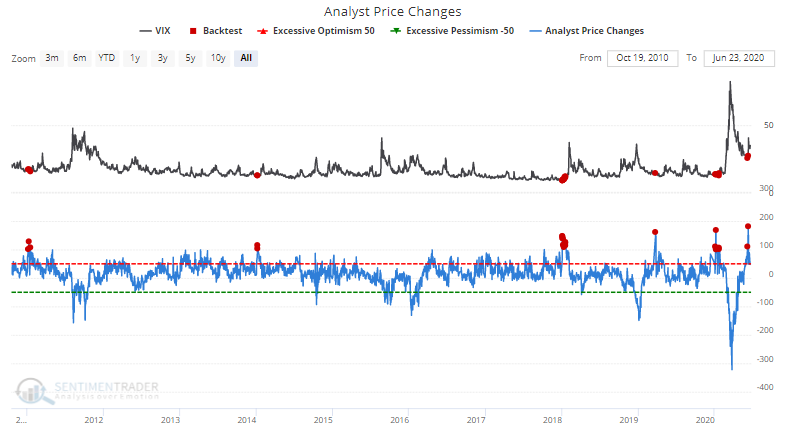
Analysts were aggressively upgrading their price targets for S&P 500 stocks almost 2 weeks ago as the U.S. stock market (and tech stocks in particular) surged. Keep in mind that back in March, analysts were downgrading their price targets at the fastest clip ever as they bet on the end of the world.
This kind of behavior has had a strong tendency to lead to a jump in volatility, usually accompanied by lower stock prices. What we've seen so far would be one of the smallest declines following an extreme like this, unless we see further selling pressure.
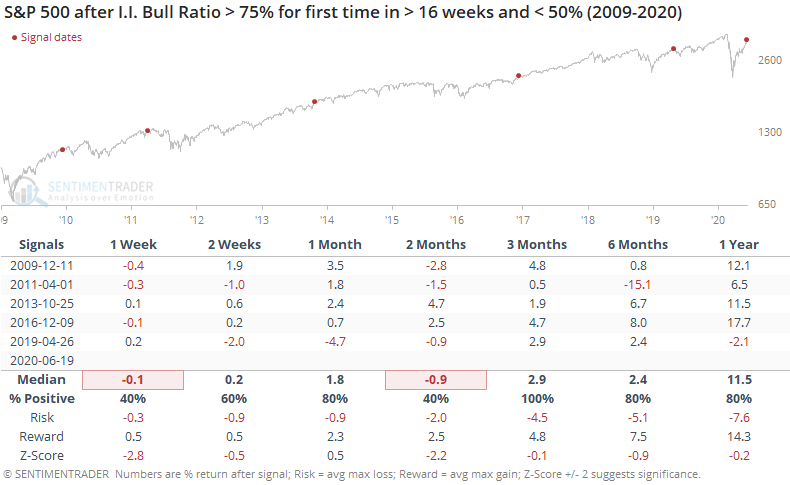
The latest Investor's Intelligence survey showed three times as many bullish newsletters as bearish ones, meaning a Bull Ratio (Bulls / (Bulls + Bears)) greater than 75%. This is the first week in five months that there were so many bulls relative to bears, ending one of the longer streaks of "not optimism" over the past decade.
The most positive medium-term returns came in previous decades. More recently, stocks have tended to back off after optimism returned.
The latest survey from the Association of Individual Investors showed yet another week of apathy, even outright pessimism. This is now the 18th straight week with the survey showing more people thinking stocks will go down than up, the 2nd-longest since the survey's inception.
This streak has pushed the 16-week average of the Bull Ratio below 40% for the first time since 2009.
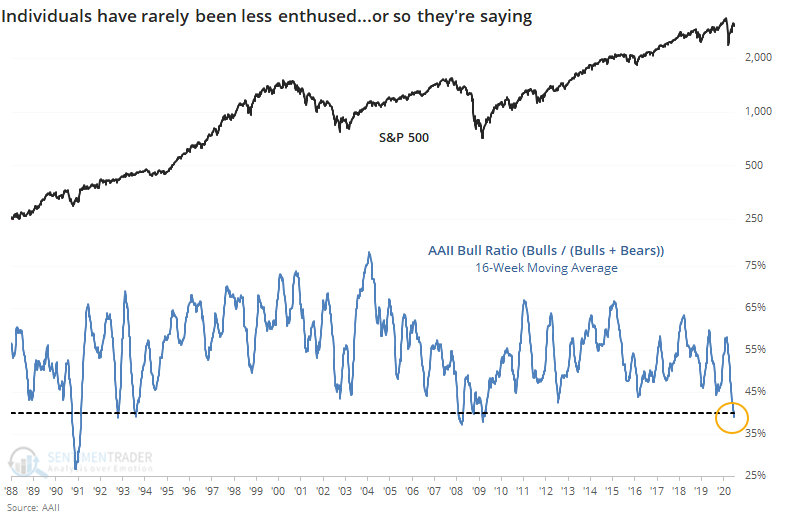
This is a really odd time in the survey. In its nearly 35-year history, it has never really behaved this way. It's exceptionally unusual to see retail investors become more pessimistic during a rally, especially a historic one. When indicators don't behave as they have in the past, we become wary. Because of that, we're reading less into it than we normally would.
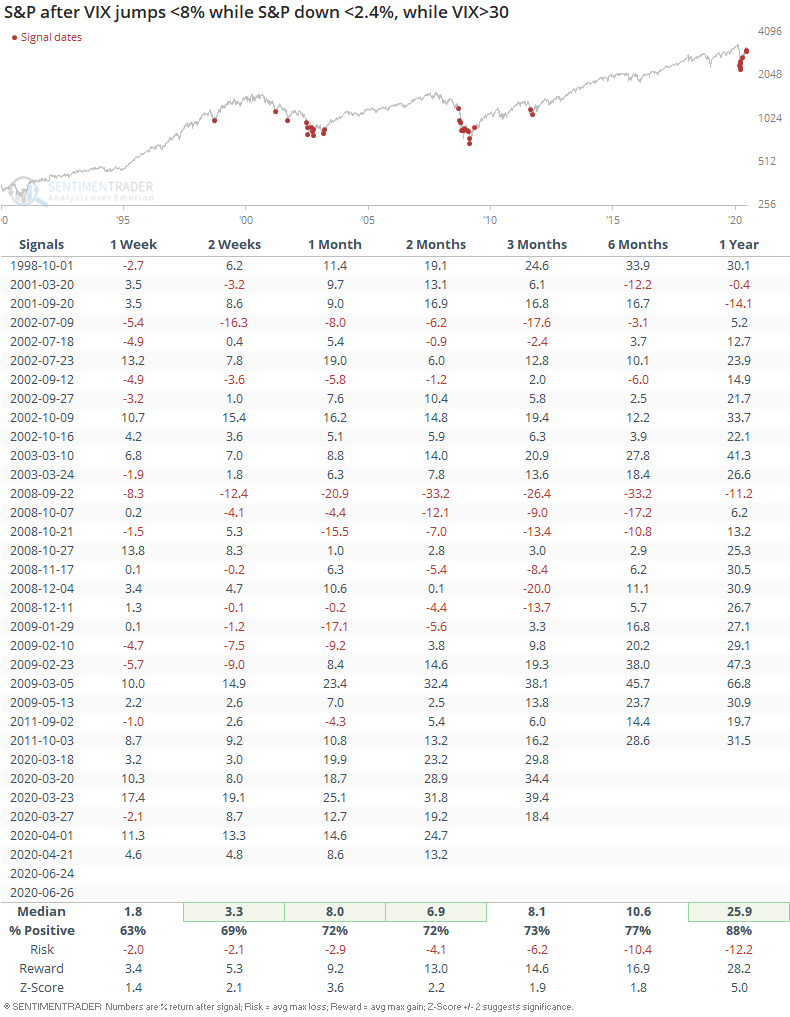
[NEW] Troy notes that the VIX remains elevated, holding above 20 for the 88th consecutive day. It isn't responding as much to S&P price movements as it used to.
When the S&P first starts to decline, even a 1.5% decline in the S&P can lead to a 20%+ jump in VIX. But as corrections/bear markets continue, large daily declines in the S&P lead to relatively smaller jumps in the VIX.
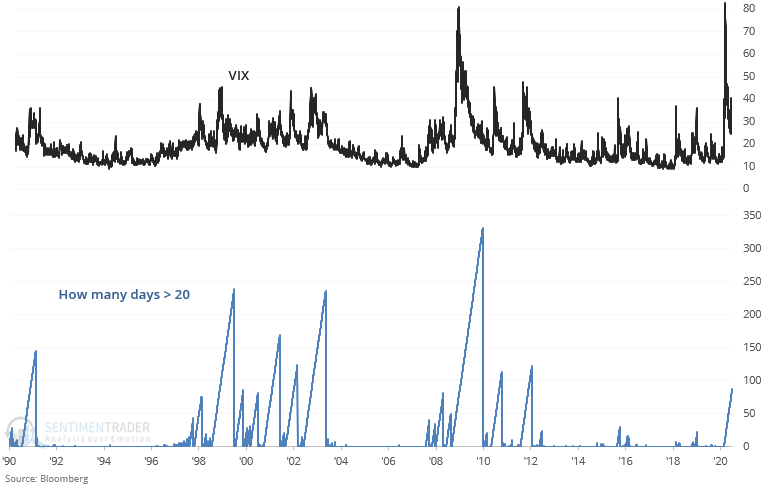
The S&P dumped 2.4% yesterday, but the VIX "only" jumped less than 8%. Historically this usually happened in the later stages of a correction/bear market. As a result, the S&P's returns over the next few weeks and months were more bullish than random.
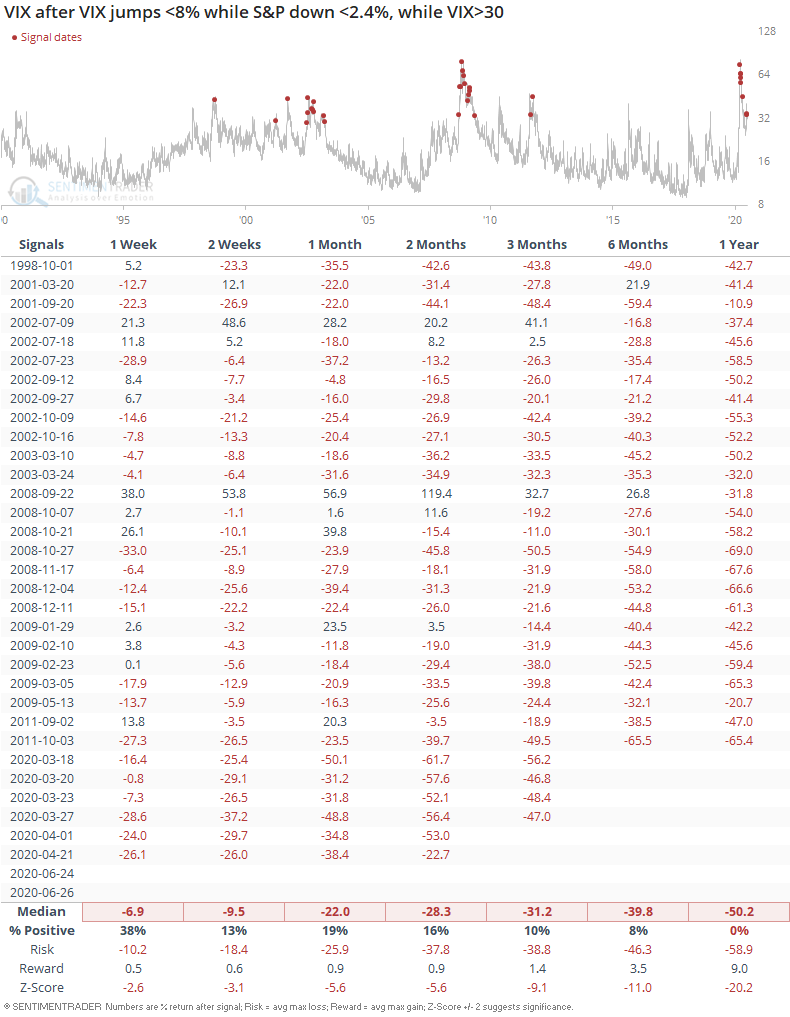
While VIX's forward returns were mostly bearish:
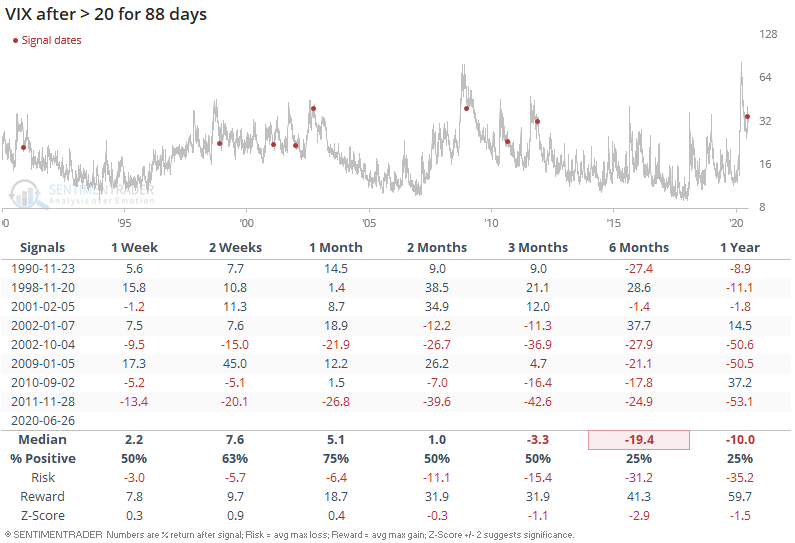
In addition, long periods of elevated volatility usually led to VIX falling over the next 6 months...
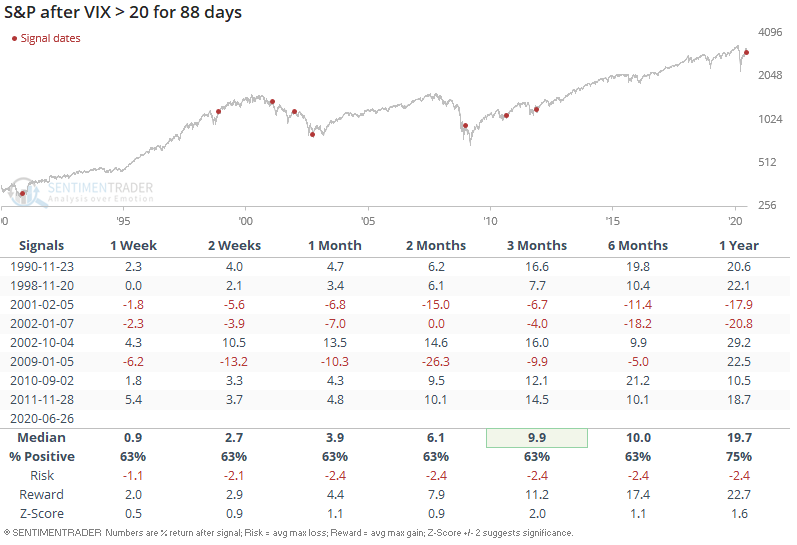
...while the S&P's forward returns were mixed. Just because VIX falls doesn't mean that the S&P must rally.
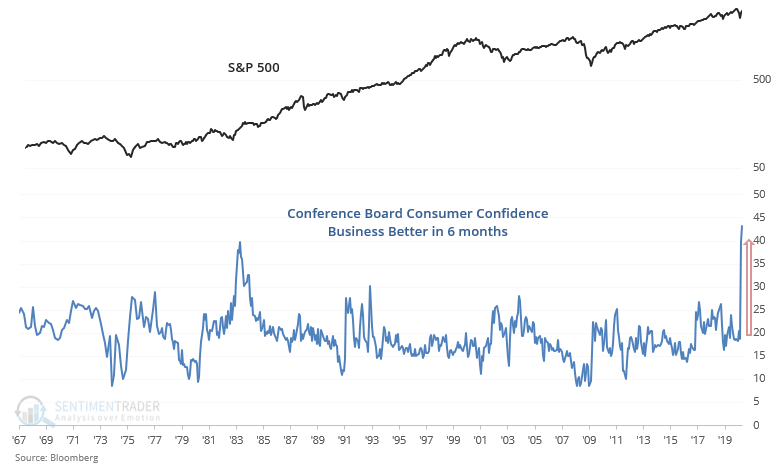
Consumers are feeling better about the future
Consumer sentiment toward economic growth is improving.
The Wall Street Journal on Wednesday showed that this difference in confidence based on time frames has had an extremely strong correlation to the yield curve.
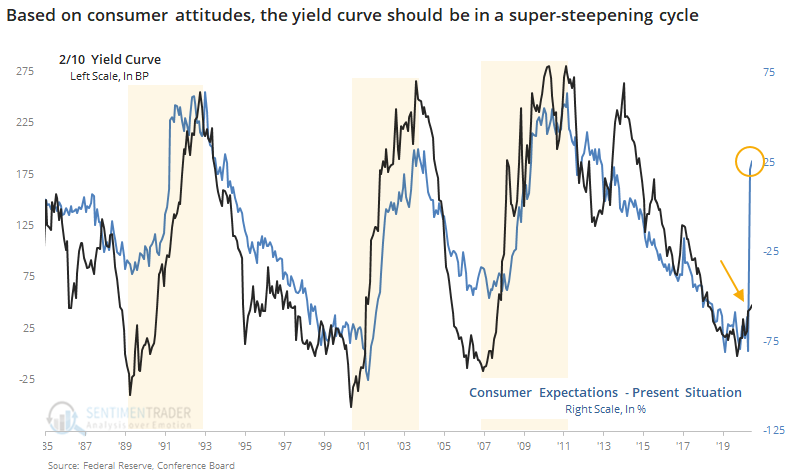
The first two cycles coincided with double-digit annualized gains in the S&P 500, while the last two were terrible times for stocks. Among sectors, the only winner during all four cycles was consumer staples. About the only suggestion we can make is that the chance we're in a super-steepening cycle has increased, and defensive stocks (namely consumer staples) are more likely to outperform in the years ahead.
In late March through most of May, almost all of our indicators and studies were suggesting higher prices. Starting in late May, that was skewing more toward flat or declining prices for the short- to medium-term, but higher prices longer-term. That is still mostly the case, though the negatives are starting to drop off a bit now that prices have relaxed. We're still not seeing anything that is especially compelling in other markets.