
TradingEdge for Oct 22 - Breadth Thrusts, Risk-On Behavior, Metals Double


The goal of the Weekly Wrap is to summarize our recent research. Some of it includes premium content (underlined links), but we're highlighting the key focus of the research for all. Sometimes there is a lot to digest, with this summary meant to highlight the highest conviction ideas we discussed. Tags will show any symbols and time frames related to the research.
| STOCKS | ||
|  |  |
As the indexes stumbled in September, there was a quick washout among stocks. By September 20, fewer than 10% of stocks in that index held above their 10-day moving averages.
Then buyers stepped in, and by the end of last week, more than 80% of members were trading above their averages, a stark change in less than a month.
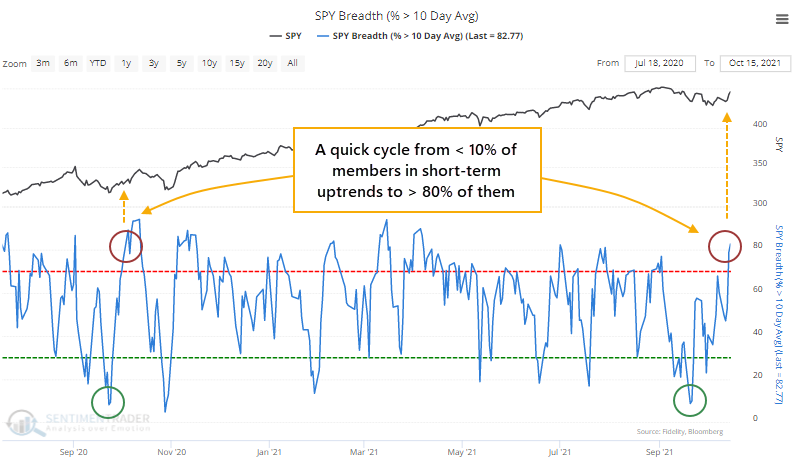
The only recent time we saw a similar move was almost exactly a year ago. That essentially marked the end of that corrective period.
Typically, breadth swings like this during times of general market volatility. It's much rarer to see cycles from very low to very high figures within a few weeks of each other when stocks are trading near their highs.
When we go back to 1928 and look for times when fewer than 10% of S&P members were above their 10-day averages, then more than 80% of them were within a month, and the S&P 500 was within 3% of its prior high, then we get 15 precedents.
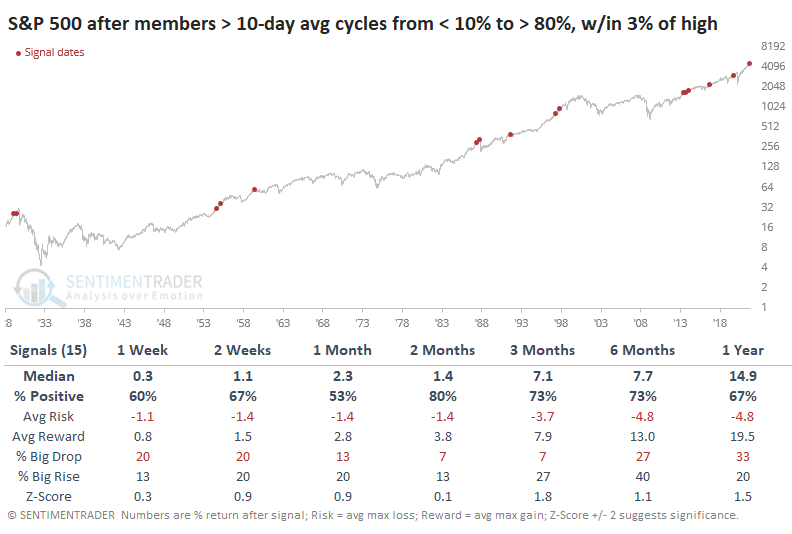
Here, the returns were good and consistently positive over the medium term. There was a colossal failure when it signaled right before Black Monday in 1987, but that was the only time stocks saw more than a 1.6% loss over the next two months.
RISK IS BACK ON
The SentimenTrader.com Risk On/Off indicator registered a range rank reversal buy signal at the close of trading on Monday, according to Dean.
The signal identifies when the indicator reverses from a bearish to bullish condition, from below 5% to above 68.5%. The Risk On/Off Indicator is an aggregate of over 20 indicators with a proven history of showing whether investors are showing risk-on or risk-off behavior.
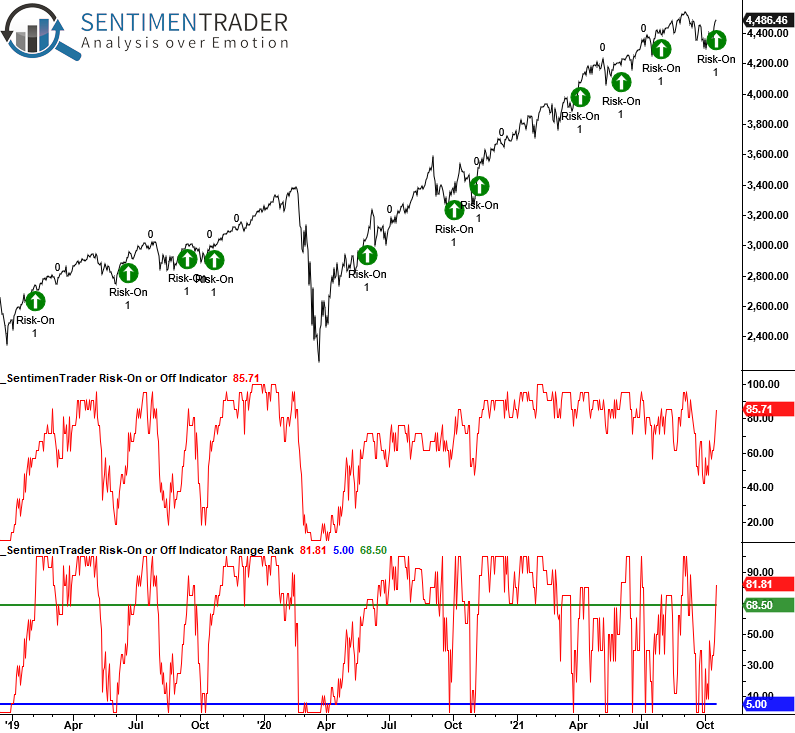
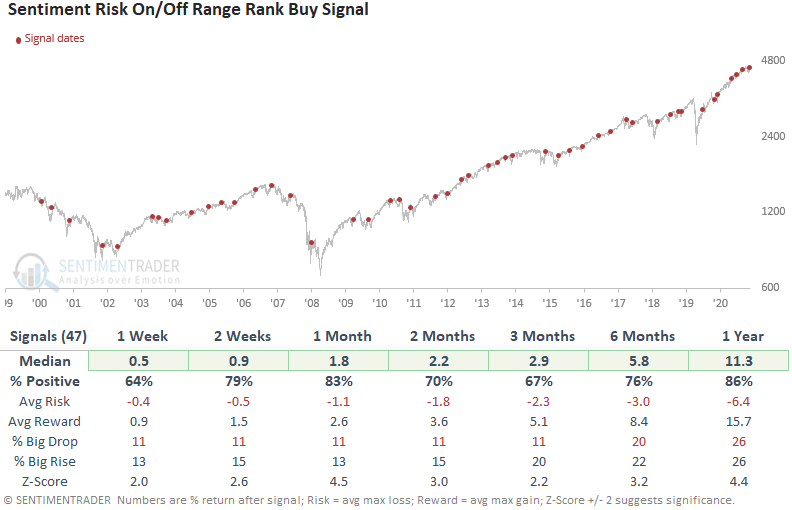
After similar reversals in risk appetite, the performance results and risk/reward profile look excellent across all time frames for the S&P 500. Since 2012, the 2-week timeframe has registered 24/26 winners.
RECESSION PROBABILITY RISES IF COPPER FALLS RELATIVE TO GOLD
Many analysts seem to like to infer that changes in the price of copper have some mystical forecasting capabilities. Many refer to it as "Dr. Copper," based on these supposed abilities. Is there anything to all of this?
Jay took a closer look, using the copper/gold ratio to forecast changes in the Coincident Economic Activity Index (CEI).
The chart below displays the difference between the copper/gold ratio and its 10-month moving average. Readings above 0.018 can be considered favorable, and readings less than that unfavorable.
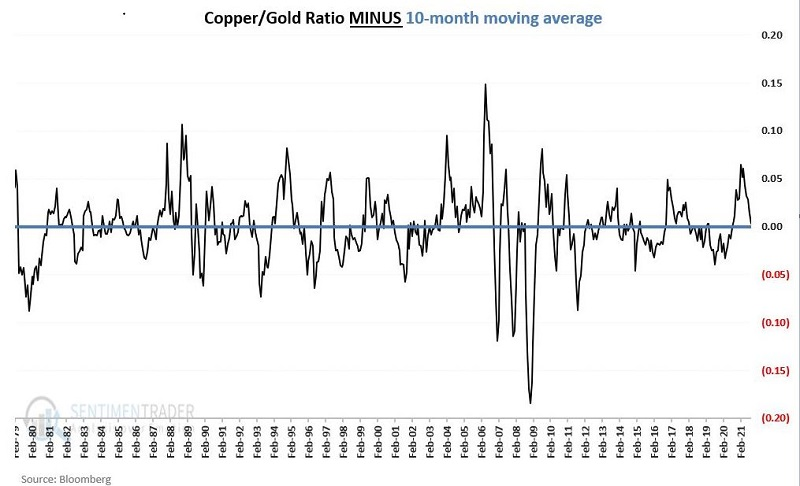
At the end of each month, the goal is to assess whether or not we need to worry about a recession beginning in the month - or months - ahead.
The Bottom Line: 95.1% of the time, CEI rose (or remained unchanged) in the month following a CGTI reading of 0.018 or higher at the end of the previous month.
The Bottom Line in Plain English: If the CGTI > 0.018 at the end of this month, the odds of a recession beginning (or continuing) in the next month is (historically speaking) less than 5%.
The "Practical" Botton Line: Following a CGTI > 0.018 reading, ignore any news you read or hear about "trouble brewing in the economy" during the next month.
MARGIN DEBT NOT YET AN ISSUE
NYSE Margin Debt measures the amount of speculative fervor among investors at any given point in time. In general:
- When margin debt is rising, it suggests investors are bullish and willing to push their bets using leverage
- When margin debt is falling, it suggests investors are bearish and are actively reducing their exposure to risk
Margin debt can reach extreme levels, which can be a warning sign of potential intermediate-term trouble. But Jay focused solely on using the NYSE Margin Debt indicator as a trend-following tool.
The chart below shows margin debt relative to its 12-month moving average.
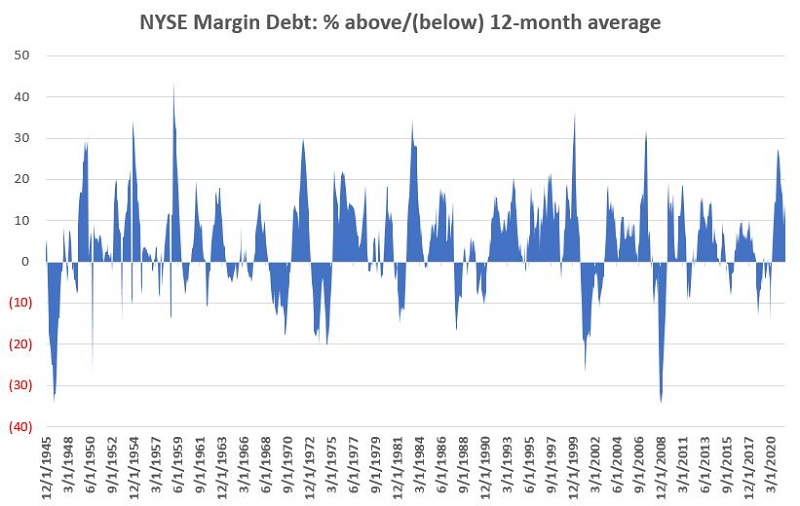
If we stipulate that debt being above its moving average is favorable and below its average as unfavorable, then we can see the stark difference in S&P 500 returns between those environments.
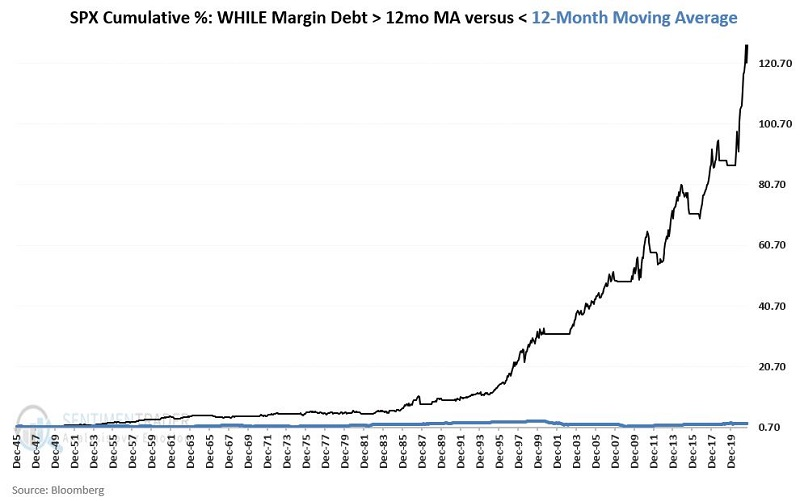
The S&P 500 rose about the same percentage of the time whether margin debt was above or below its average. But it tended to gain much more when debt was above average, and lose much more when below.
STOCKS AND SECTORS - OVERSEAS MARKETS STILL STRUGGLING
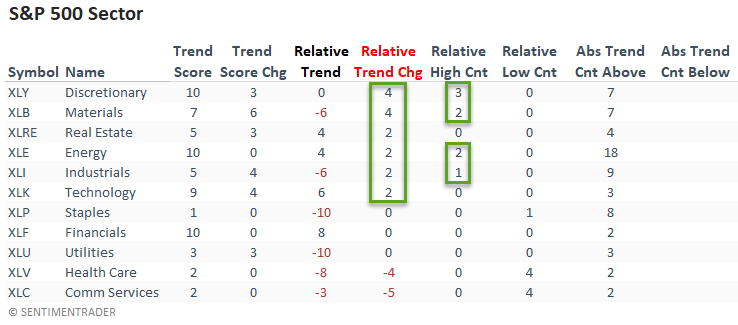
Dean updated his absolute and relative trend following indicators for domestic and international ETFs.
The relative trend score change column shows that sectors with a more offensive tilt improved as the broad market bounced in the latter half of the week.
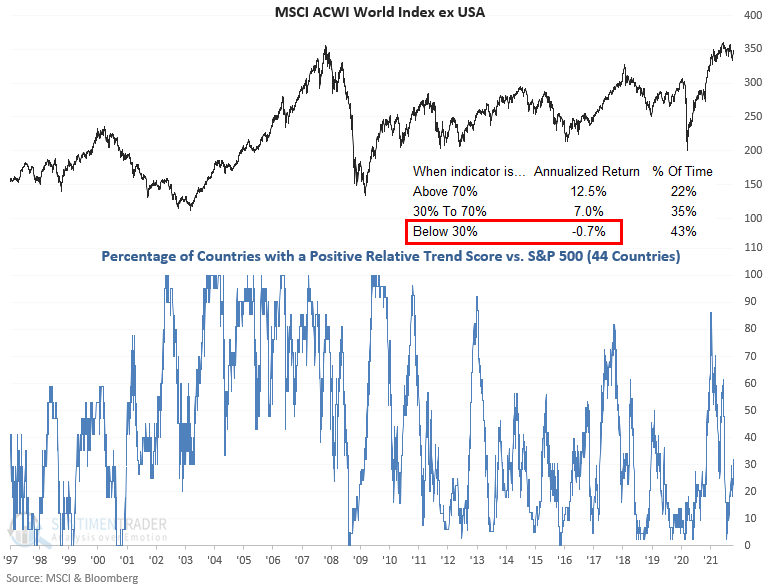
The percentage of countries with a positive relative trend score versus the S&P 500 improved on a w/w basis. If we look at the regional data, we see that Europe and South America improved. At the same time, the Asia Pacific region held steady.
The current all-country data continues to suggest an unfavorable environment for the MSCI ACWI World Index ex USA.
STOCKS AND SECTORS - EMERGING MARKETS REBOUND SIGNALS
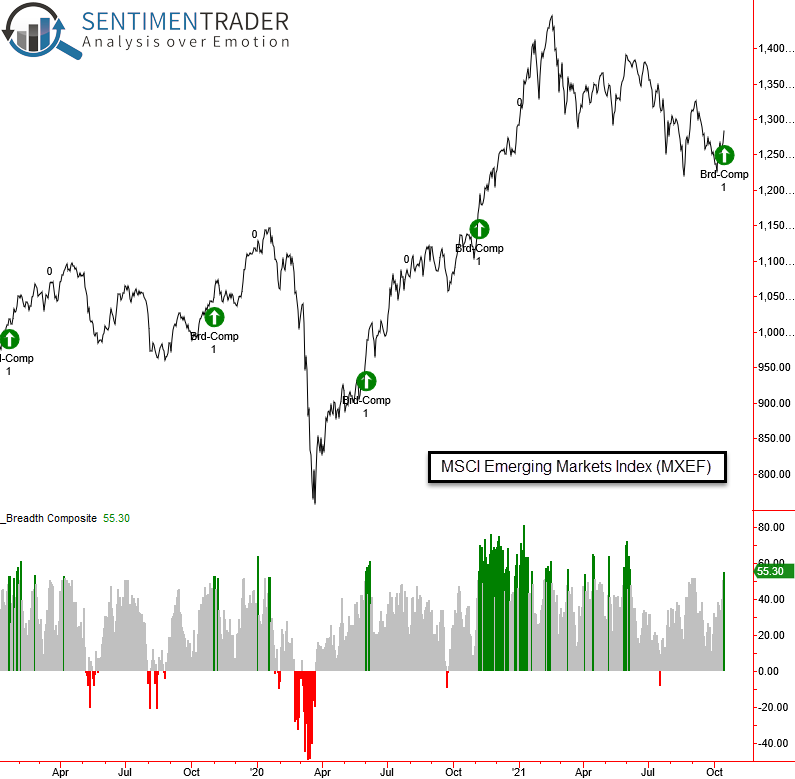
Last Friday, two models for emerging market stocks issued a buy signal.
While there are factors that should weigh on emerging markets over a longer time frame, a couple of signals Dean watches triggered positive precedents. The first was triggered because these markets have gone from a period of high volatility to low volatility.
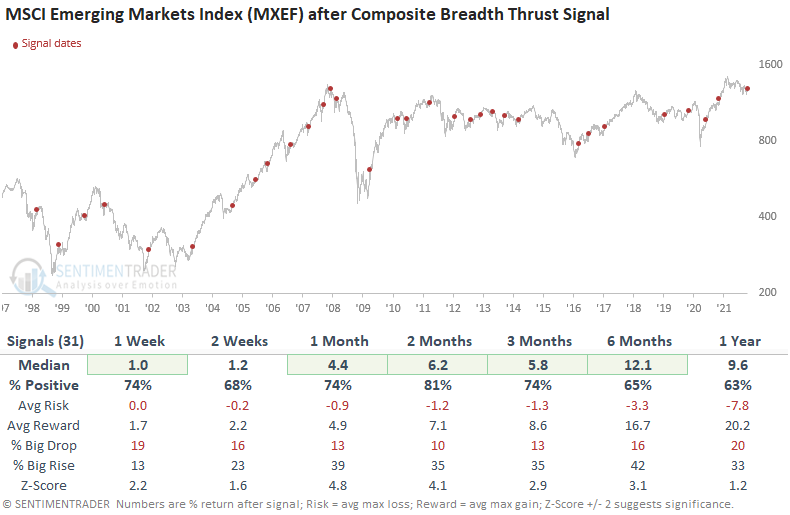
The 2nd signal uses an aggregate of comprehensive breadth data for emerging market stocks, covering 22 countries. Because the recent rally enjoyed broad participation, a thrust was triggered.
Results after similar signals were solid across almost all time frames. While several risk/reward profiles are good, the one and two-month windows are excellent. The 2-month window has registered 16/18 positive gains since 2008.
STOCKS AND SECTORS - HEALTH CARE LOOKS TO REBOUND
Jay noted that the health care sector experienced a near -10% pullback from early September into October. At least two factors are flashing signs of hope for the health care sector. For trading purposes, we will focus on ticker XLV (Health Care Select Sector SPDR Fund).
The first test looks at a measure of breadth for ticker XLV and identifies those times when the 5-period moving average of XLV component stocks above their respective 50-day average crosses above 12.
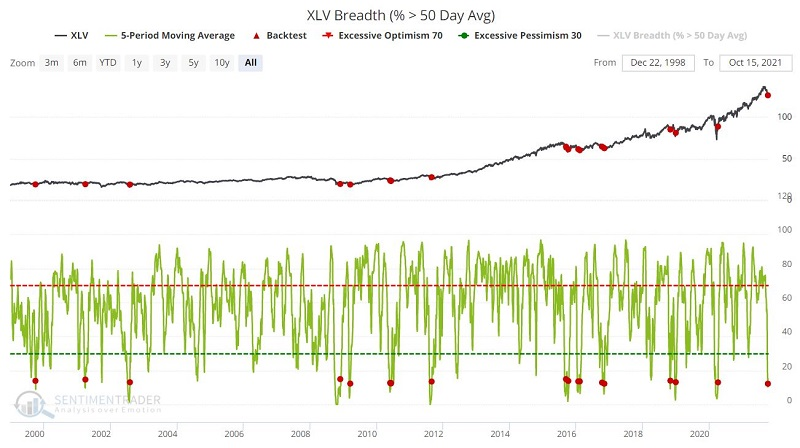
The table below displays a summary of the results.
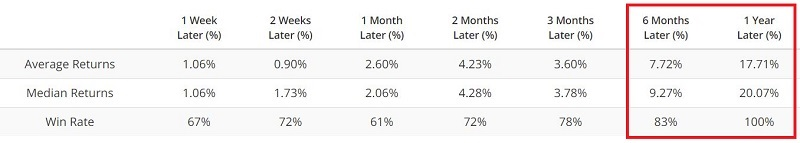
Longer-term returns were excellent. On a shorter-term basis, the chart below displays the Annual Seasonal Trend for ticker XLV.
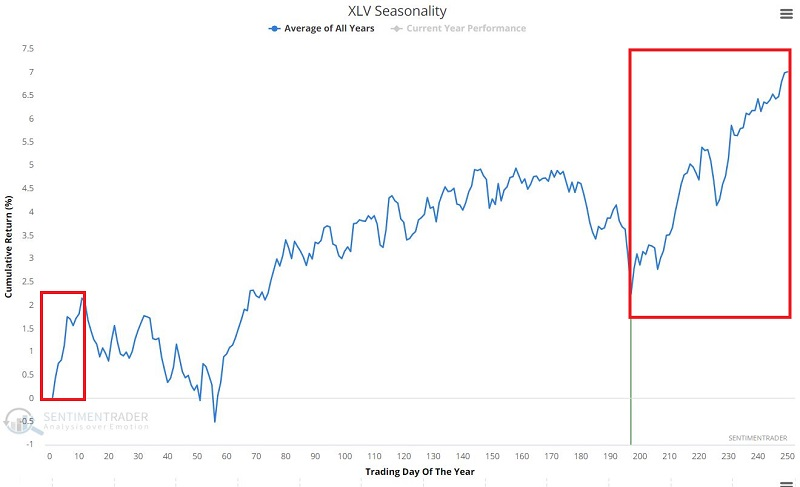
Note that a period of seasonal strength begins after Trading Day of Year (TDY) #197 and extends through TDY #11 of the following year.
| COMMODITIES | ||
 |  | |
When consumers are optimistic about the economy, they buy stuff. That stuff needs to be manufactured by somebody, and those somebodies need materials to make it.
So, manufacturers get busy, inputs are in demand, and industrial materials tend to rise. There's no doubt that's the case now with the S&P GSCI Industrial Metals Index doubling from its pandemic-panic low.
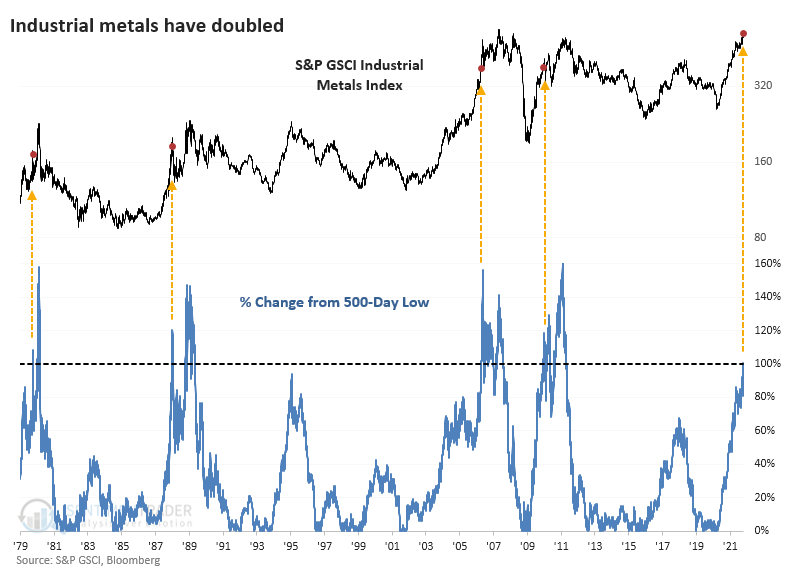
After prices in this market doubled from a low, the metals have typically been about to cool off. High prices tend to generate higher production, leading to lower prices through the magic of market forces. Massive moves like this don't often happen, so the usual caveats about small sample sizes apply.
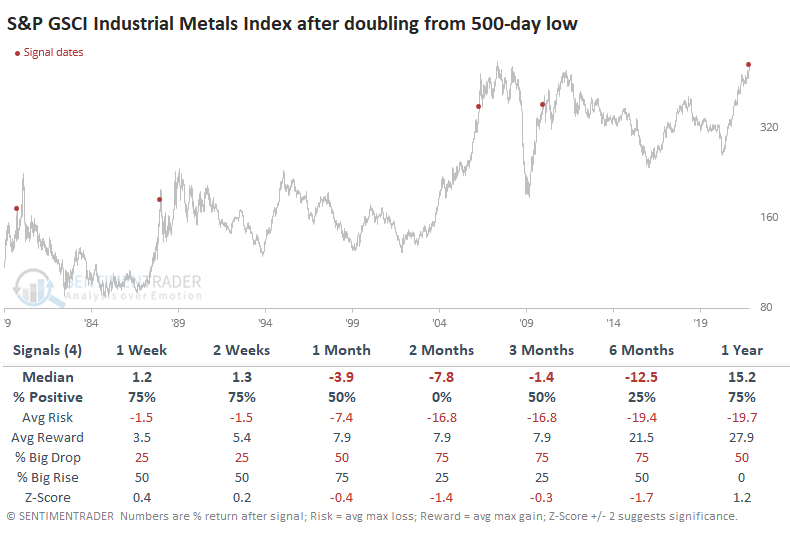
By the time these metals doubled, the upside was relatively limited and, over the next couple of months, cooled off every time. The 2006 spike preceded an incredibly volatile stretch (well, they all did), and metals prices were nearly 20% higher six months later, while the other three all saw double-digit declines.
COMMODITIES FACE A SEASONAL HEADWIND
Jay showed that, unlike stocks, commodities have a history of moving straight to a top and then reversing lower almost on a dime. A classic case in point can be seen in the silver market in the chart below.
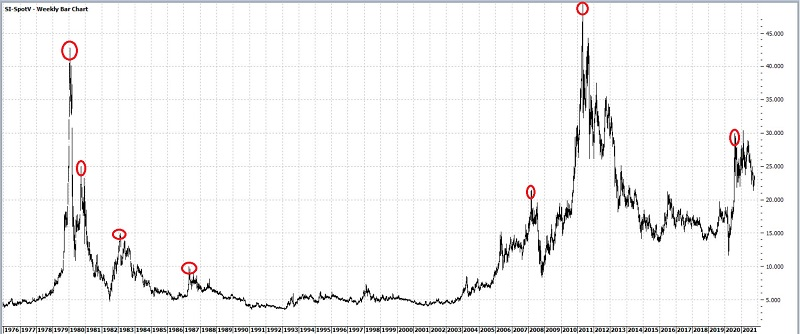
The severely overextended nature of commodities prices in general, combined with a host of unfavorable seasonal trends set to exert whatever effect they may have soon, suggests that commodity traders should be alert to a potential cooling-off period.
Let's look at commodities as an asset class in aggregate. The CRB Index tracks a basket of commodities. The chart below displays the Annual Seasonal Trend for the CRB Index. As you can see, it has just entered a seasonally "unfavorable" period.
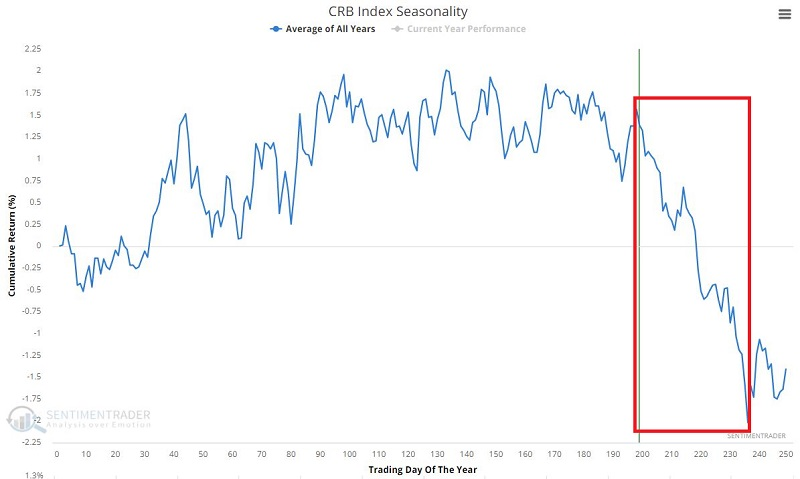
The (approximately) two-month stretch in the CRB Index has seen a positive return 14 times and negative return 13 times over the past 27 years. But the average negative return was -7.8% versus only +2.8% during the average positive period.
Looking through the seasonal charts of most of the major contracts, most of them are now entering a seasonal soft spot.
Does this mean that commodities are sure to pull back in the months ahead? Not at all. Seasonality is only one factor that affects commodity prices. But if commodities are going to pull back, now would be as likely a time as any.
OIL SURGE
Dean noted that crude oil has now closed above its 10-day moving average for 21 consecutive days, a full month. The streak has surpassed 21 days four times since May 2020. The commodity's ability to hold above its short-term moving average looks similar to the period between 2004-06, the last secular bull market environment for oil.
Let's add some context to the study. The table below shows historical instances when the count reached 21 consecutive days above the 10-day moving average, and crude oil closed at a 2-year high. The new condition will identify cases similar to the most recent signal.
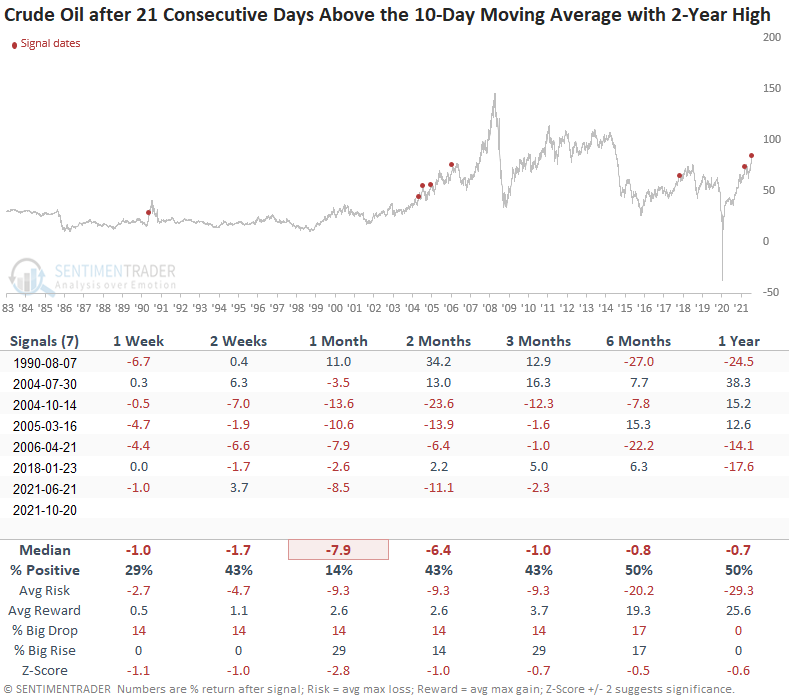
While the sample size is small, results look weak across all time frames, especially the 1-month window.
Dean also assessed the outlook for crude oil prices when the commodity closes above its respective 200-day moving average for 240 days.
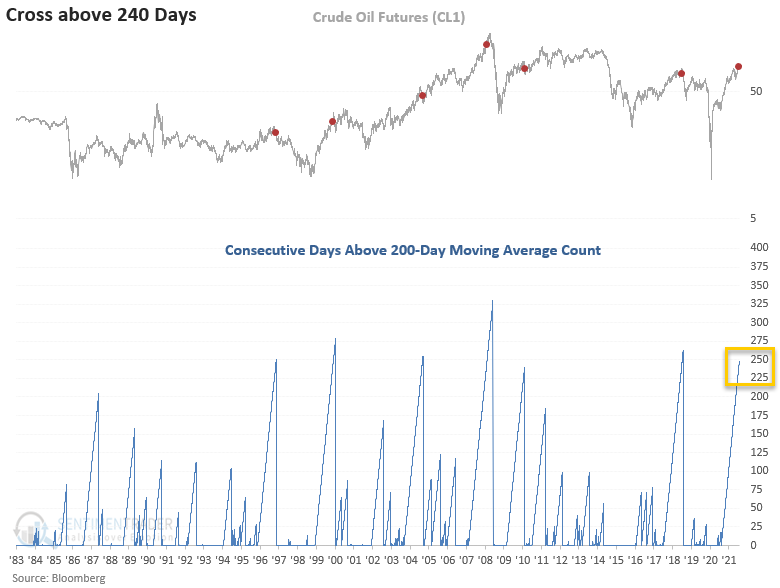 The study suggests that crude oil could continue higher in the short term. However, the one and two-month time frames indicate a correction could be on the horizon.