
Crude Oil Moving Average Trend Persistency

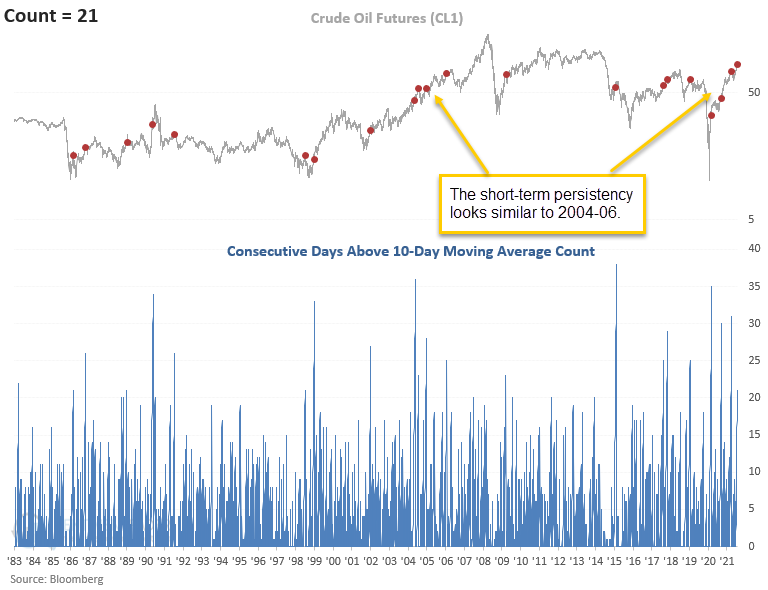
Crude oil has now closed above its respective 10-day moving average for 21 consecutive days as of the close on 10/20/21. If we glance at the chart below, you will notice that the count has now surpassed 21 days, a total of four times since May 2020. The commodity's ability to sustain above its short-term moving average looks similar to the period between 2004-06, the last secular bull.
Let's conduct a study to assess the forward return outlook for crude oil when the commodity trades above its 10-day moving average for 21 consecutive days.
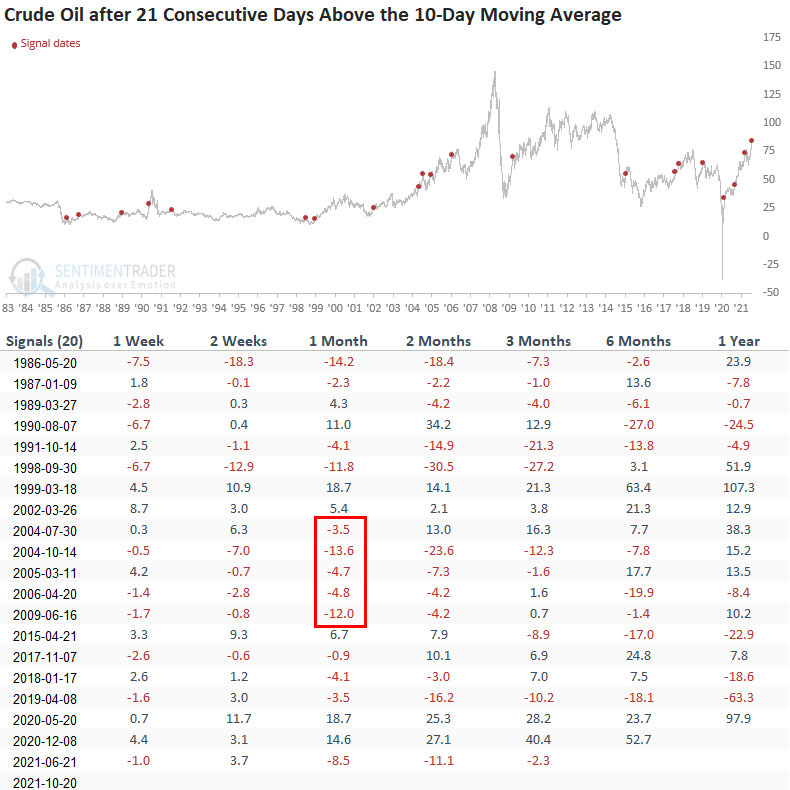
HISTORICAL CHART
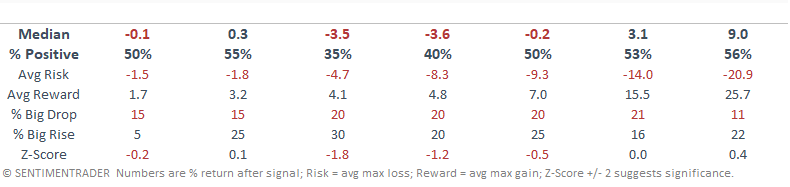
HOW THE SIGNALS PERFORMED
The short to intermediate-term results look weak when compared to historical averages. I would note that the risk/reward profile for the 1-month time frame looks unfavorable, and the negative instances in that window between 2004-06, a secular bull period. Remember, corrections in bull markets should be expected.
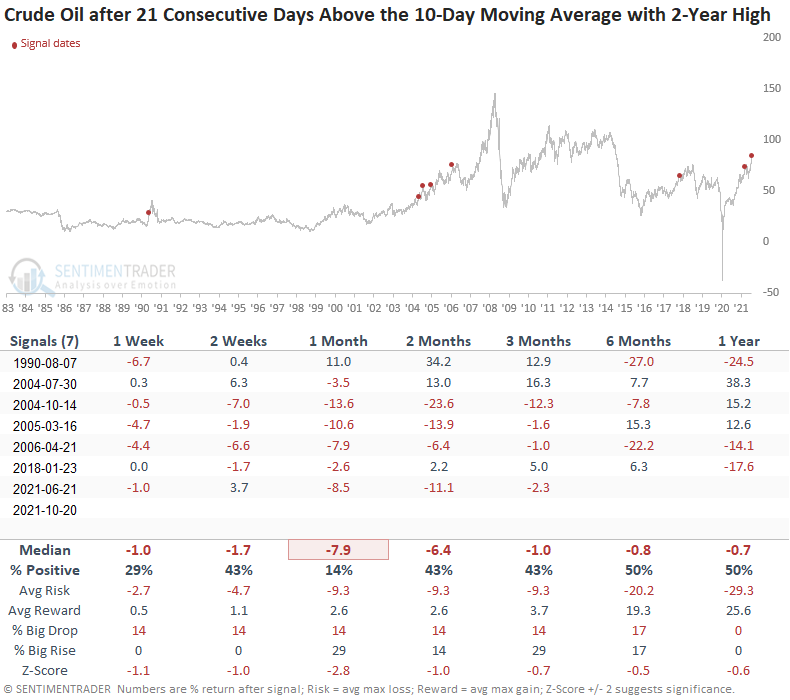
Let's add some context to the study. I will now isolate historical instances when the count reached 21 consecutive days above the 10-day moving average, and crude oil closed at a 2-year high. The new condition will identify cases similar to the most recent signal.
HOW THE SIGNALS PERFORMED
While the sample size is small, results look weak across all time frames, especially the 1-month window. And, I would call your attention to the performance of the previous signal on 6/21/21.
Suppose we modify the moving average duration for the study from 10 days to 200 days. In that case, we see that the count has now reached 248 consecutive days above the average. Historically, a count of this magnitude is associated with cyclical and secular bull markets for the commodity.
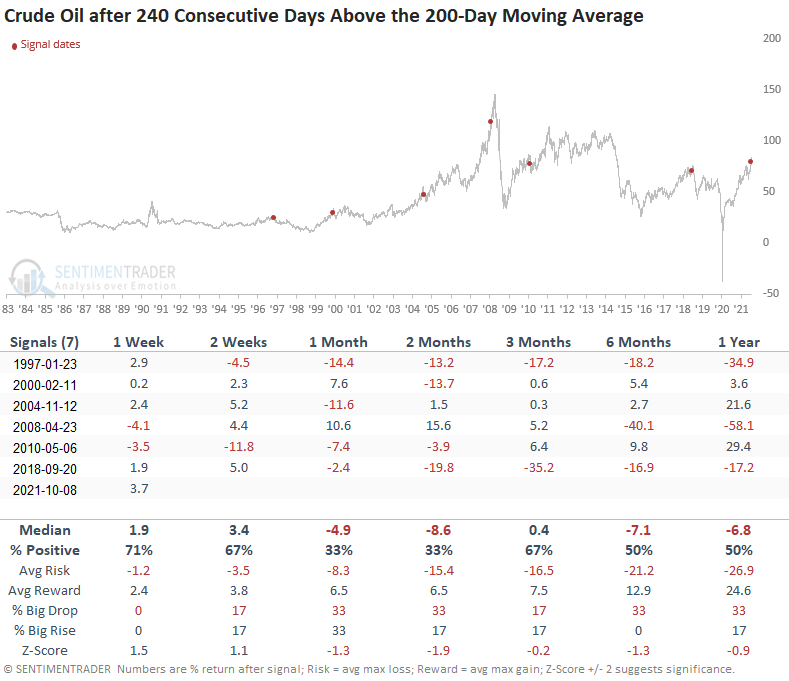
Let's conduct a study to assess the outlook for crude oil prices when the commodity closes above its respective 200-day moving average for 240 days. I lowered the threshold to 240 days to include the 2010 instance.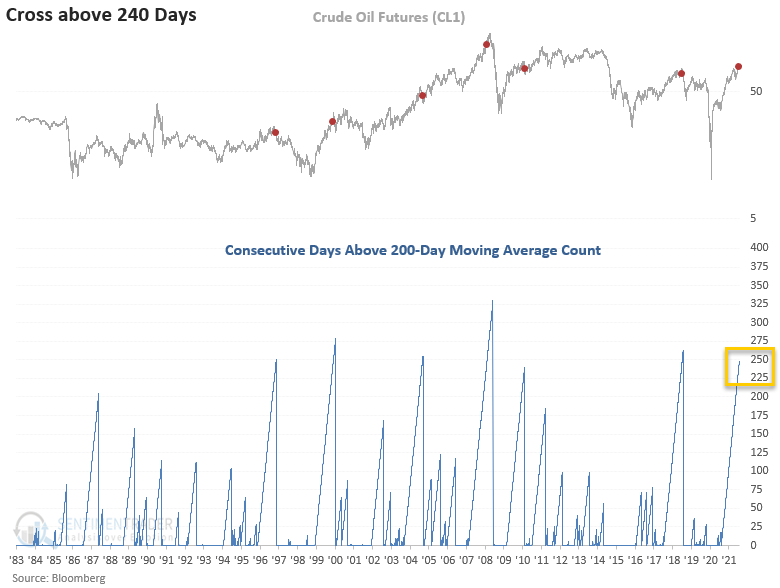
HOW THE SIGNALS PERFORMED
The study suggests that crude oil could continue higher in the short term. However, the one and two-month time frames indicate a correction could be on the horizon.
With crude oil price trends extended on a short and long-term basis, we should be on alert for a potential correction within an ongoing bull market.