TradingEdge: Even more speculation as breadth continues to improve

This is a recap of the most notable research published during the week.
Data from the Federal Reserve showed a record drop in household exposure to equities, just as we were declared "officially" in a recession. Most of the time, that meant prices had already suffered the bulk of their declines. Breadth has continued to improve, even with Thursday's carnage, and it remains the most compelling longer-term positive for stocks. Shorter-term, we continue to see massive speculation, especially among options traders, and that is the biggest worry over a multi-day to multi-week time frame.
If there is a piece of research that hadn't been published by Friday, then you'll see a [NEW] tag.
Sentiment showed signs of excess entering the week
At the start of the week, small traders were pushing their luck in a major way.
Several times in recent weeks, we've looked at the behavior of the smallest of options traders, and how they were establishing positions that rivaled some of their most speculative in at least 20 years. The steady rally has only boldened their views, and they're pushing their positions even more.
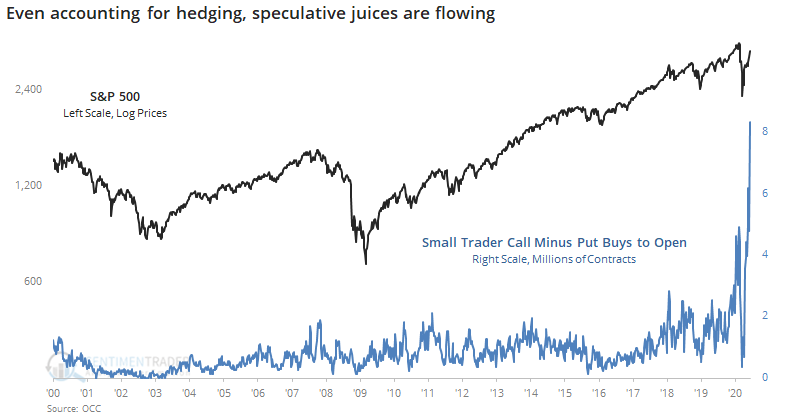
This kind of activity has a strong tendency to lead to negative returns in the S&P 500 and other indexes over a multi-week to multi-month time frame.
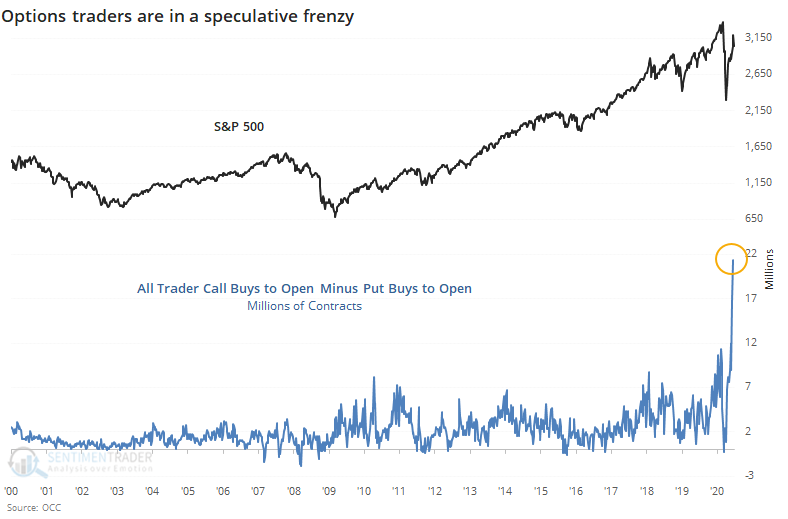
[NEW] This past week, they not only continued their speculative frenzy, they built on it. Despite a rocky week of price action, options traders moved to an even more aggressive position. Among all traders, there were 21.4 million more call options bought to open than put options bought to open. The previous record was 16.9 million more calls than puts, and that was last week. This week's speculation is almost double (!) the peak from February.
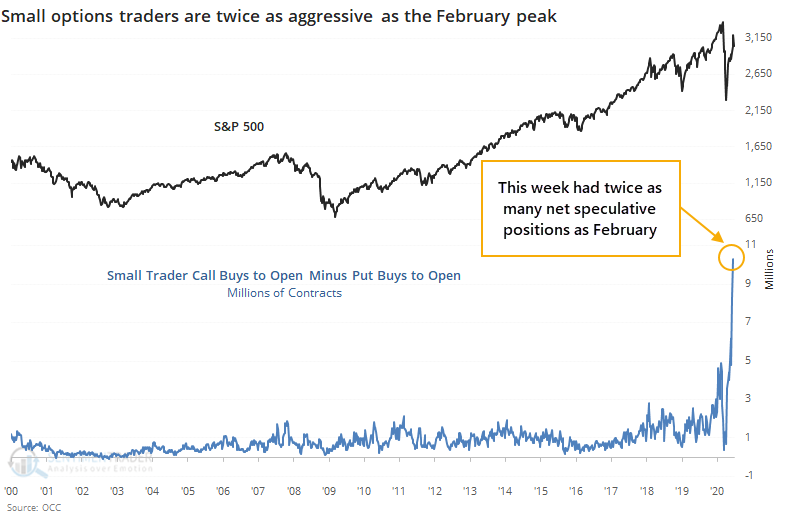
Among the very smallest of traders, those using 10 contracts or less, speculation was even more rampant. This past week, their net speculative opening transactions were twice as heavy as the peak in February.
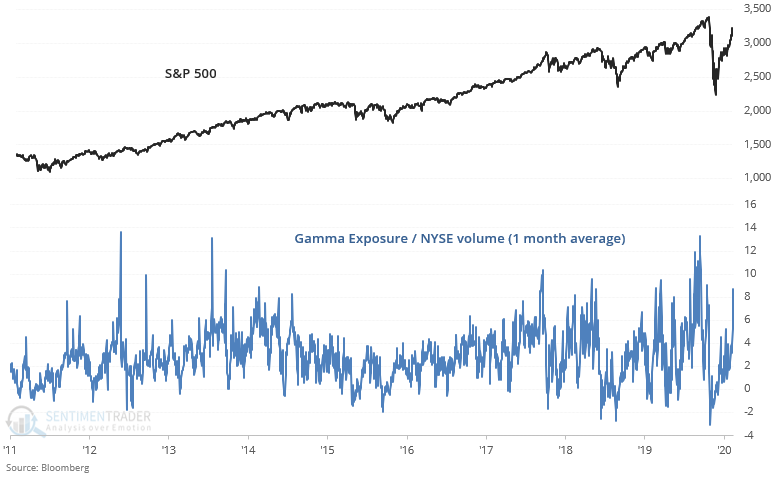
It also wasn't a good sign that Gamma Exposure was so high. Thursday took care of a lot of that, but one day usually isn't enough to take care of such extremes like we saw earlier in the week.
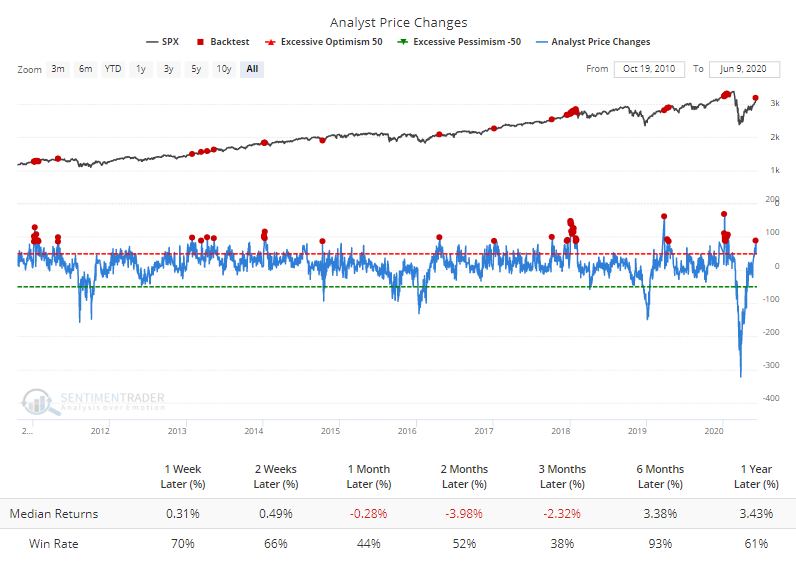
Wall Street hasn't been able (or willing) to keep up, though analysts have been suddenly rushing to upgrade their price targets. When they fall so far behind the market then try to quickly upgrade their targets, it's been a bad sign.
Even though we're now "officially" in a recession, the announcement usually comes way too late to be useful. Investors have already priced that in, and cyclical stocks just broke out to a new high relative to defensive ones.
The rebound in sentiment is remarkable given the carnage in Q1. As a percentage of total household assets, or even more notably as a percentage of GDP, equity holdings plunged, from 94.8% to 73.3%. That's the largest drop on record. Never before had equities dropped more than 20% as a percentage of the economy in only one quarter.
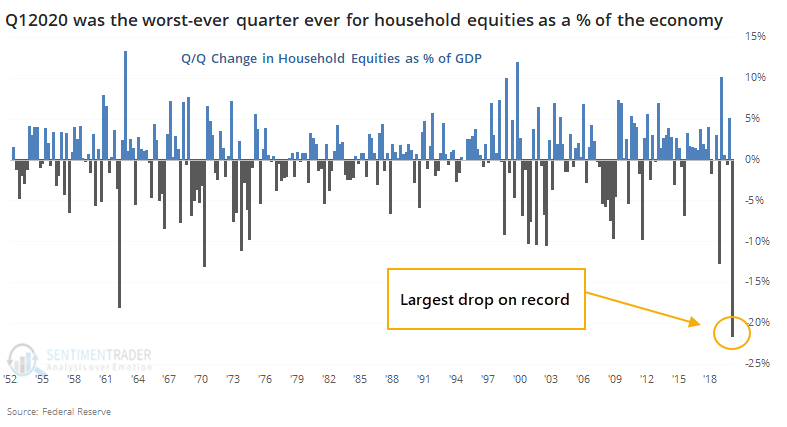
When stocks have declined as much as they did in the first quarter, relative to other assets and economic output, it has tended to precede decent long-term returns. The biggest caveat is that household equity holdings are still historically high and major bear market lows occurred when stocks were a much less prominent part of total assets. Because of that, we can't consider this a positive yet, on any time frame.
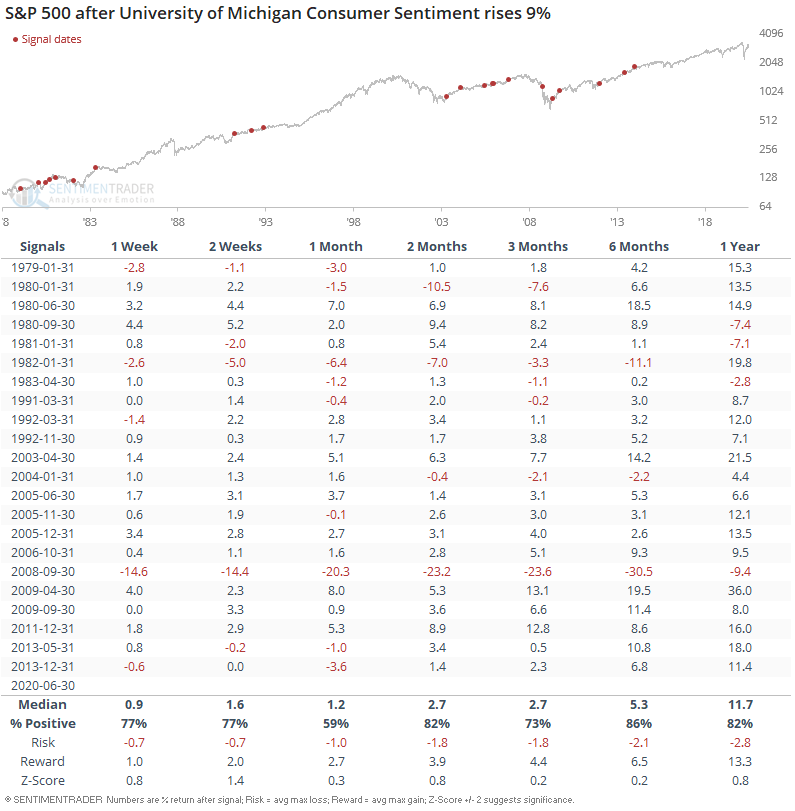
[NEW] Troy notes that the latest University of Michigan Consumer Sentiment figures jumped more than 9% as the U.S. exited lockdowns and the economy improves.
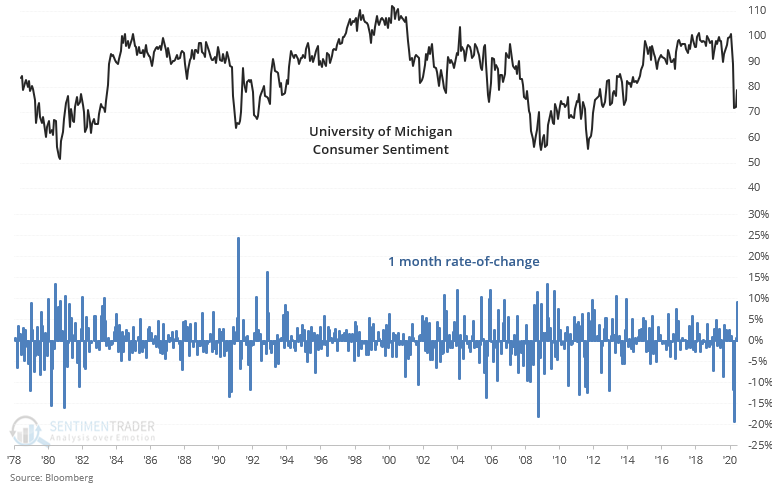
Similar reversals in consumer sentiment were mostly bullish for the S&P 500 over the next 6 months. The 2 major exceptions were in January 1982 (as the 1982-1983 bear market and recession began) and September 2008, just before the global economy fell off a cliff.
Similarly, consumers' expectations for their own financial situation and for that of the economy is improving:
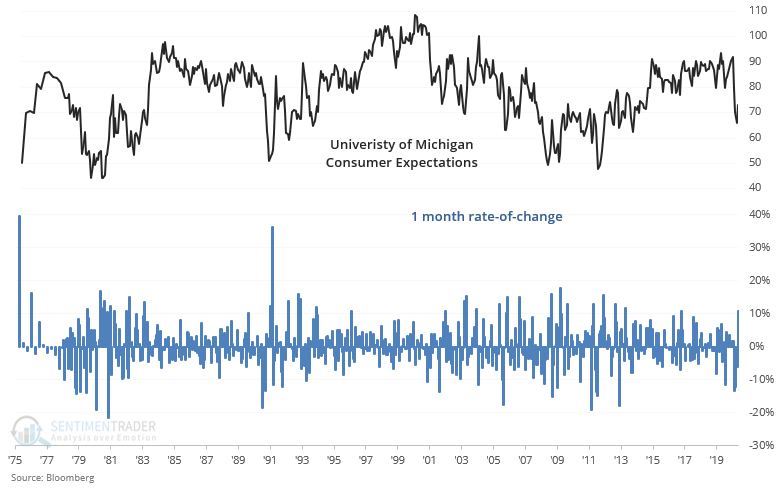
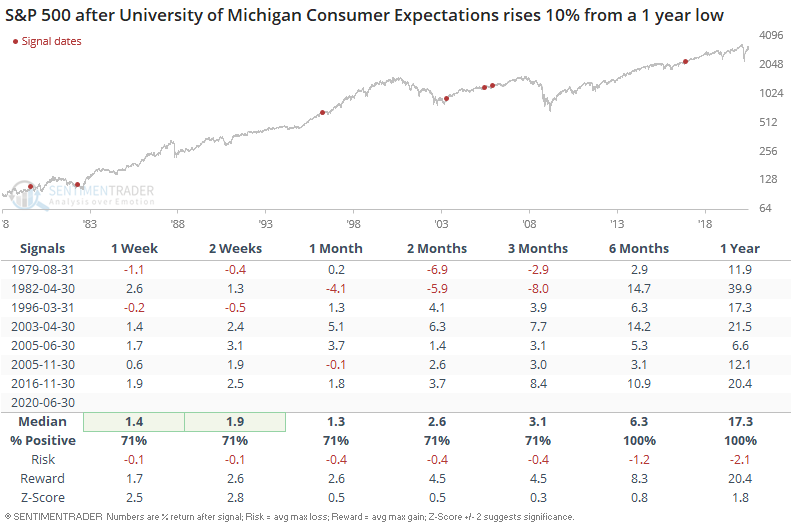
When the University of Michigan Consumer Expectations jumped 10% from a 1-year low, the S&P had a strong tendency of posting more gains over the next 6-12 months:
Breadth remains the biggest booster
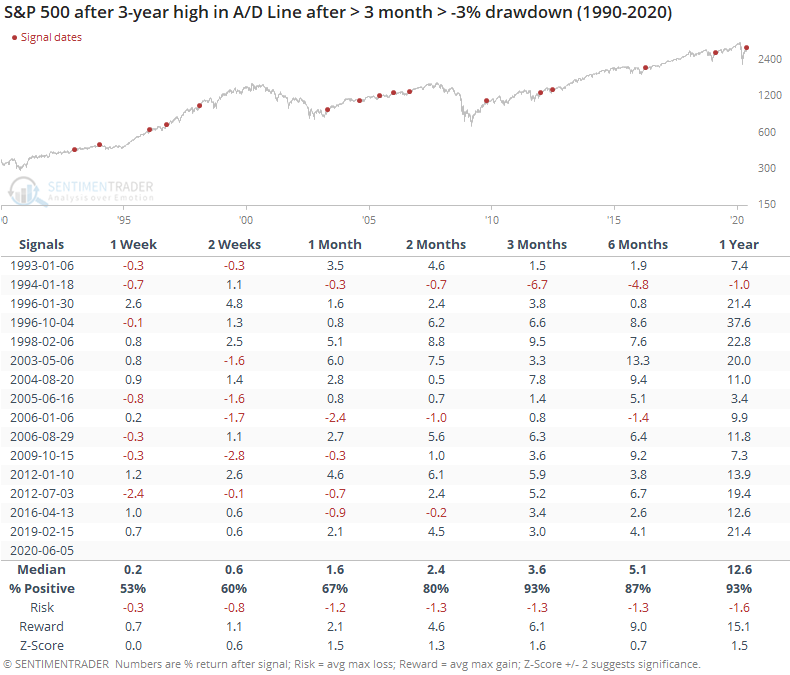
Reflecting the breadth thrusts and recoveries we've been looking at in recent weeks, enough securities on the NYSE have advanced relative to those that declined that this commonly-cited version of the health of the market has never been higher.
And this week, the Cumulative Advance/Decline Line made a new high.
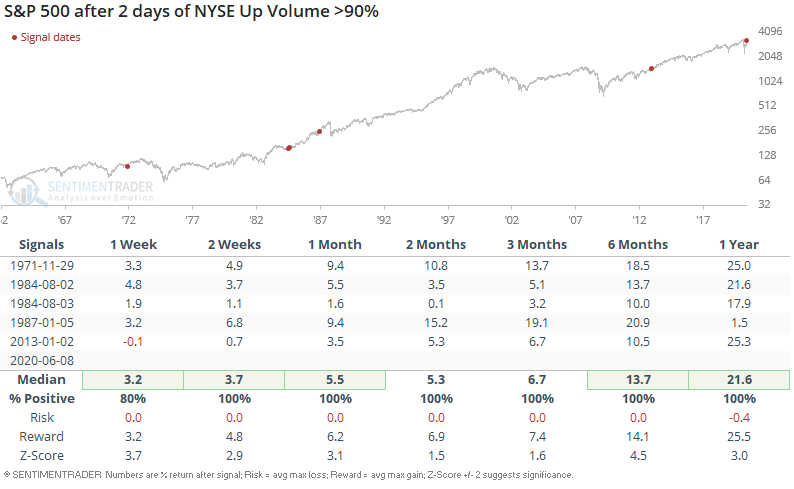
By Monday, buying pressure was intense that we saw consecutive 90% up volume days among other signs of "gobs of breadth."
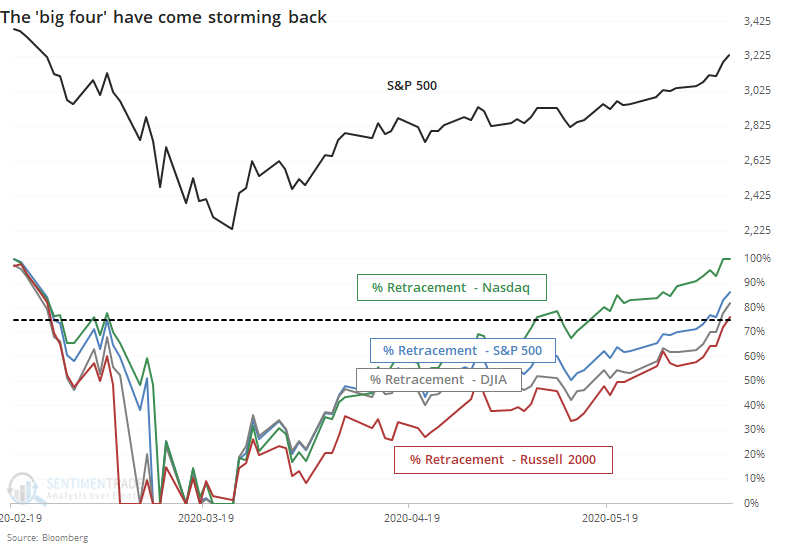
The "big four" U.S. equity indexes have all retraced at least 75% of their declines, which has never failed to precede higher returns a year later.
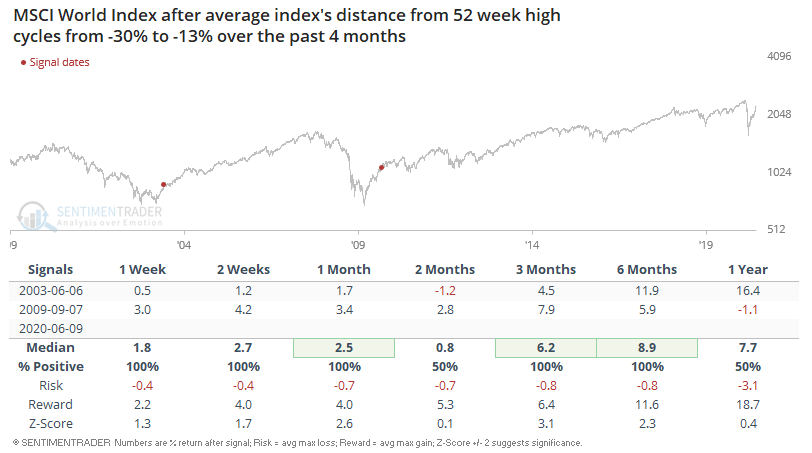
U.S. stock market indices are among the first indices around the world to approach/exceed previous all-time highs. For example, the NASDAQ 100 and NASDAQ Composite have made new all-time highs, while the S&P and Dow are climbing rapidly. While many overseas indices are not yet near all-time highs, they are rallying along with U.S. equities. This has caused the average developed market's distance from its 52-week high to rise rapidly.
While these longer-term breadth metrics have been extremely positive, the sharp selloff on Thursday pushed more than 98% of the S&P's members below their 10-day moving averages, among other signs of reversals.
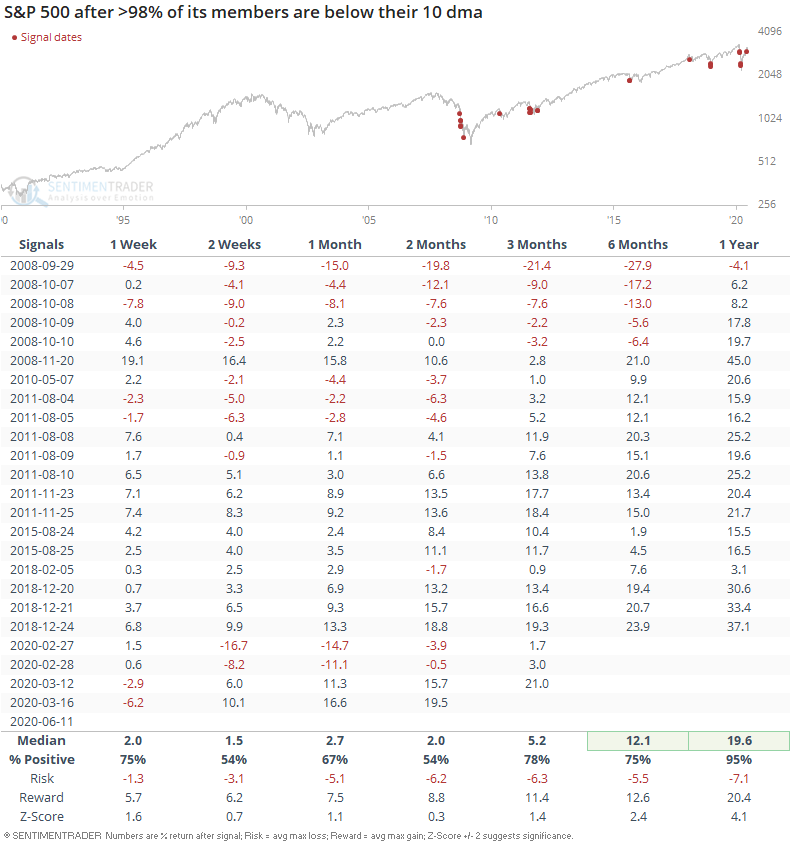
When we see behavior like this, it has led to mixed shorter-term returns, but typically positive ones longer-term.
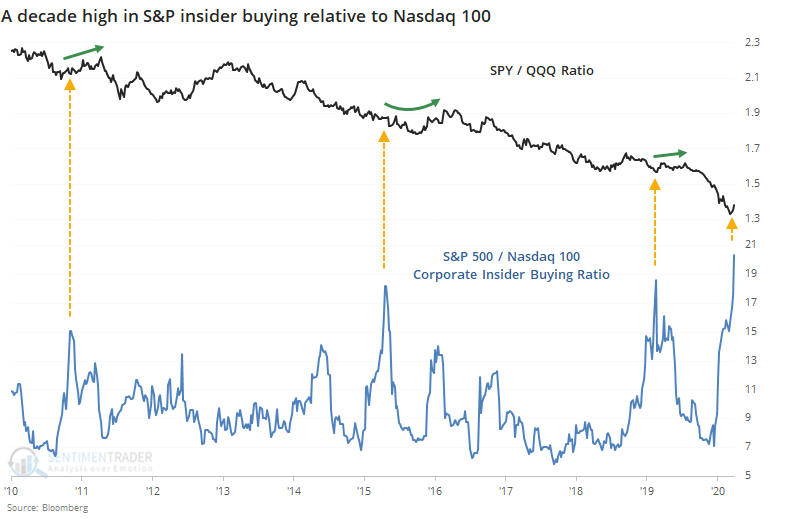
The Nasdaq had been in a historically long streak of holding above its 20-day average, even while the S&P 500 was not. That has been a bad sign for the Nasdaq relative to the S&P, and it seems like corporate insiders are betting that way, too.
[NEW] On Friday, Troy noted that more and more U.S. stocks are rolling over (generating MACD sell signals). The effectiveness of this indicator as a bearish signal is somewhat questionable, depending on how you look at it.
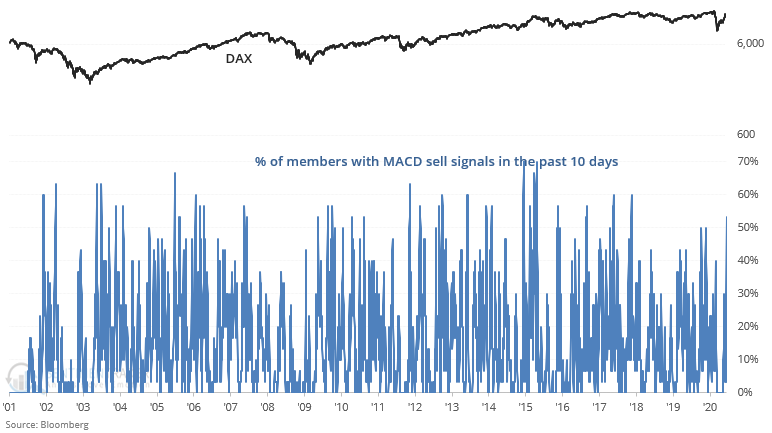
Overseas, more and more German stocks are triggering a MACD sell signal.
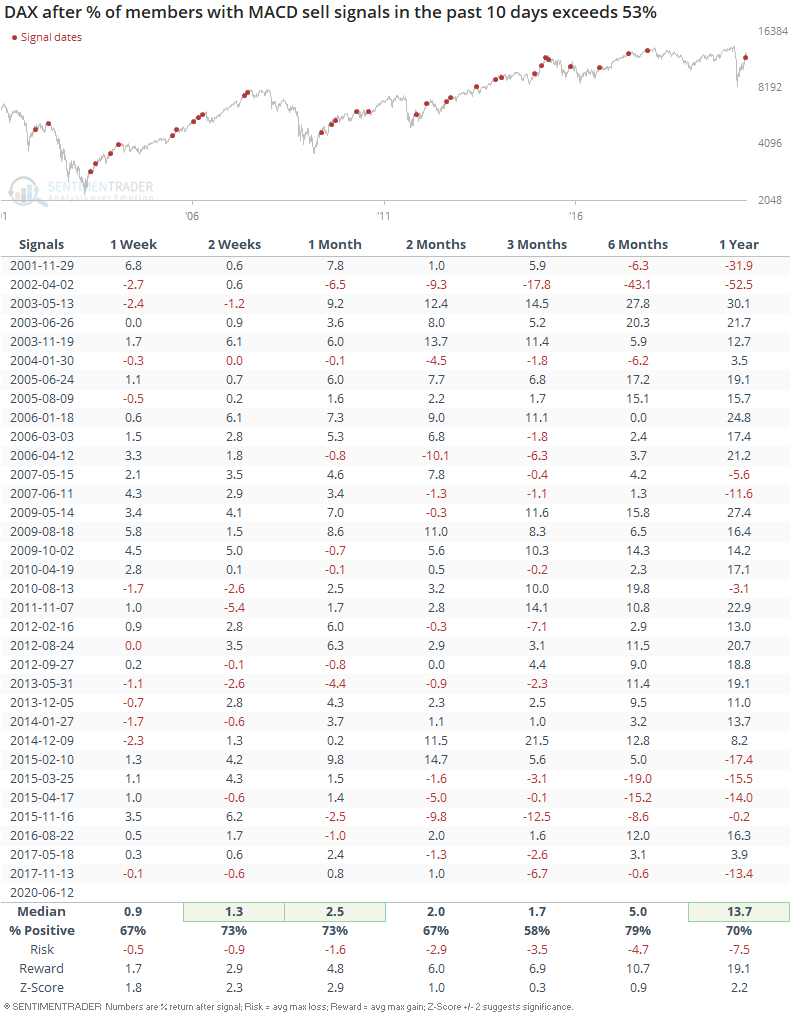
When more than 53% of German equities triggered a MACD sell signal, the DAX's forward returns did not lean bearish. On the contrary, the DAX had a much higher than average chance of rallying over the next 2-4 weeks:
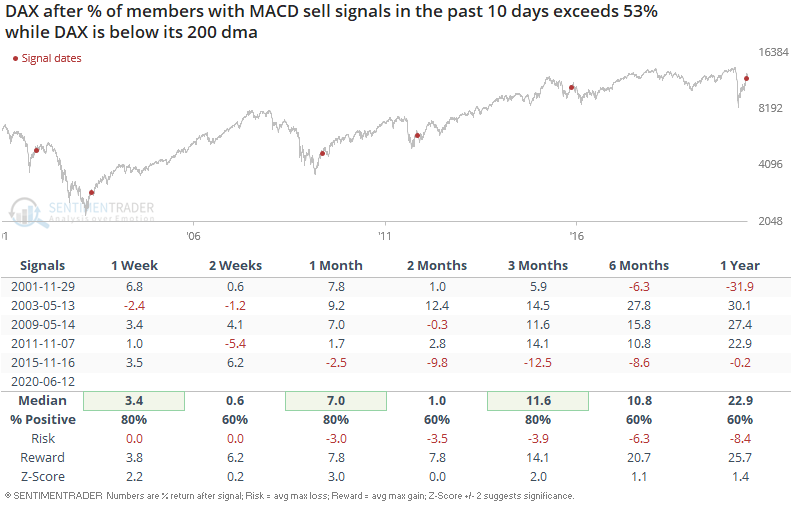
If we isolate for the historical cases when the DAX was under its 200 dma, then we get the same result. This isn't consistently bearish for the DAX on any time frame, although the last time this happened (November 2015) was indeed bearish.
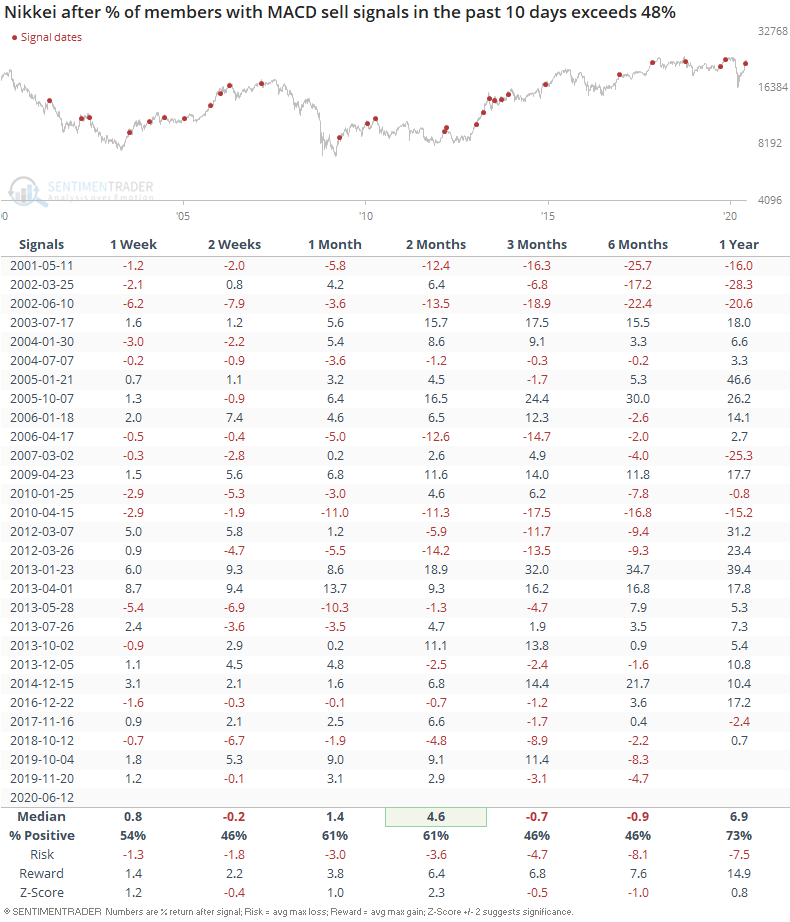
In Asia, more than 48% of Japanese equities have triggered a MACD sell signal:
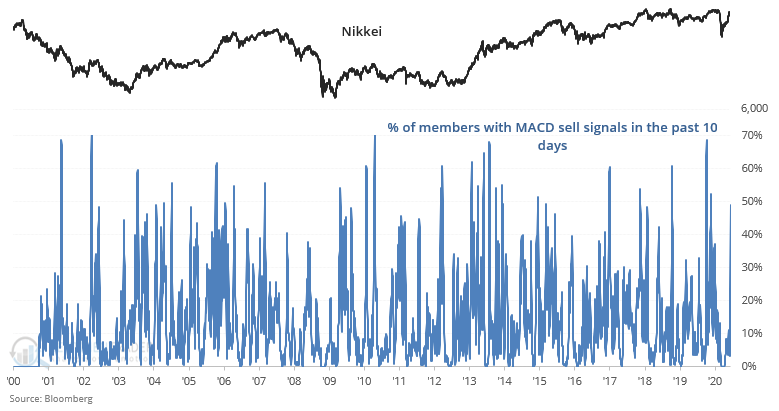
This is somewhat bearish for the Nikkei over the next 2 weeks and 6 months:
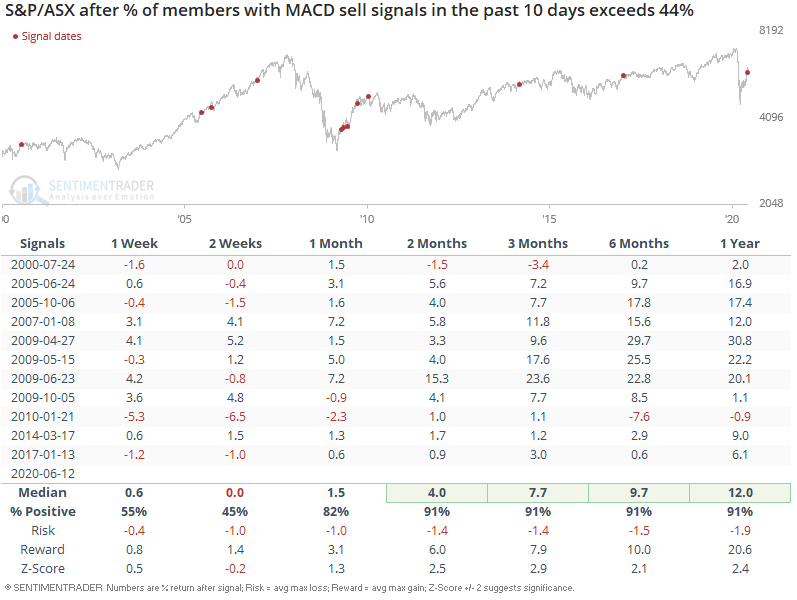
More than 44% of Australian equities have triggered a MACD sell signal.
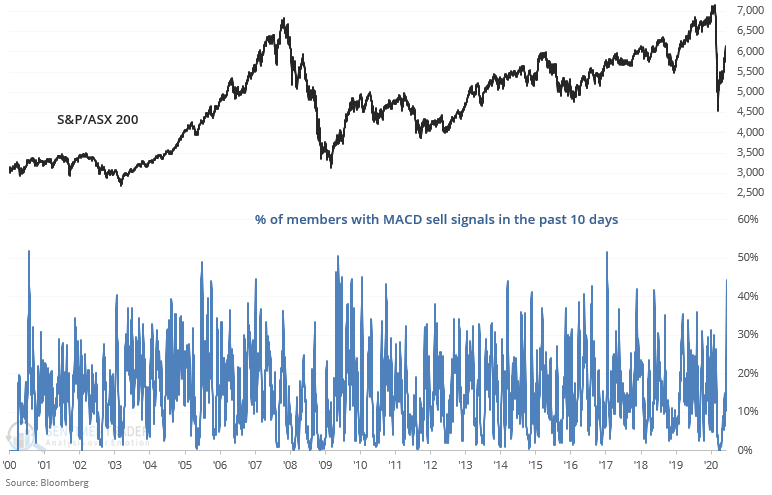
This is mostly a mixed sign for Australian equities over the next 1-2 weeks, and quite consistently bullish after that.