Data &
Technology
Research
Reports
Report Solutions
Reports Library
Actionable
Strategies
Free
Resources
Simple Backtest Calculator
Simple Seasonality Calculator
The Kelly Criterion Calculator
Sentiment Geo Map
Public Research Reports
Free Webinar
Pricing
Company
About
Meet Our Team
In the News
Testimonials
Client Success Stories
Contact
Log inLoginSign up
< BACK TO ALL REPORTS

Stock market's abrupt reversal

Troy Bombardia
2020-06-12
Thursday's fierce selloff led to an abrupt reversal in many breadth indicators.

The stock market's rally before Thursday was quite powerful, triggering extremes in various sentiment and breadth indicators. Many of these breadth indicators did a 180 when the stock market crashed on Thursday.

The selloff led more than 38% of S&P 500 stocks to trigger a MACD sell signal, which implies that a significant number of stocks are rolling over.

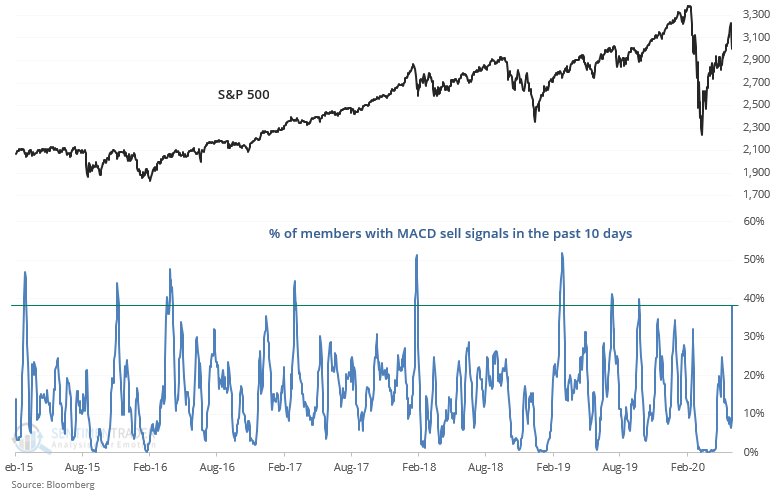
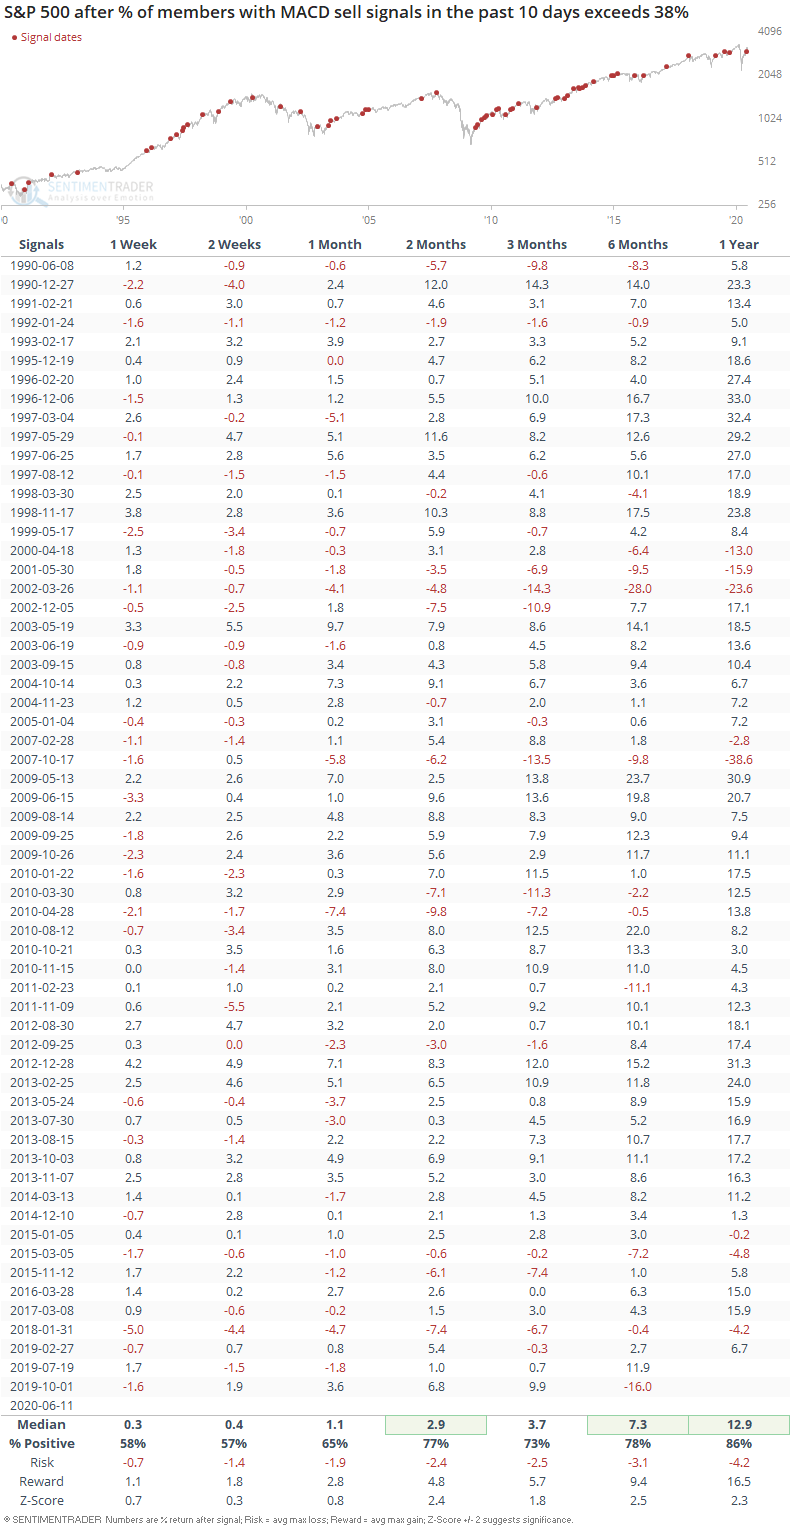
Similar large spikes led to further S&P pullbacks and more volatility, particularly in recent years.

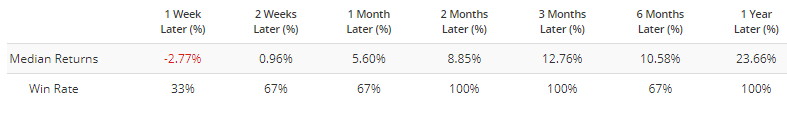
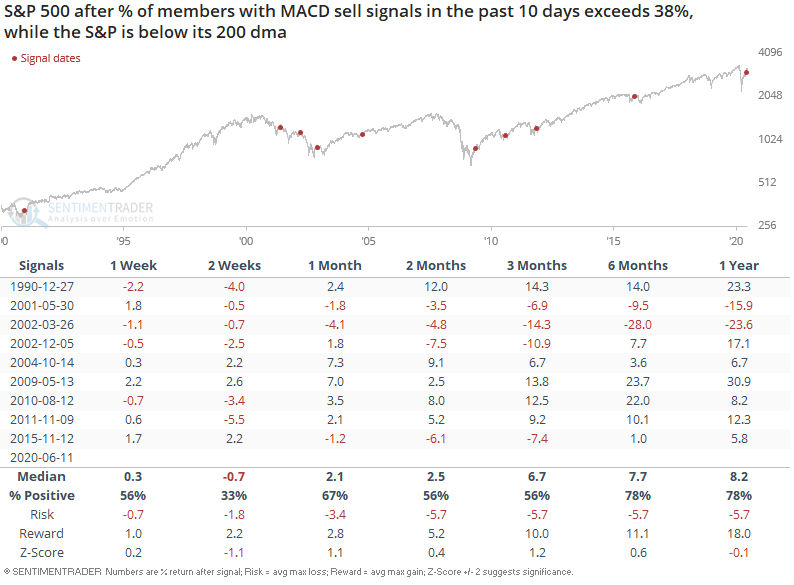
Most of the historical cases occurred while the S&P was rallying above its 200 dma and just started to roll over. For the few that occurred while the S&P was in a downtrend (below its 200 dma), this was more of a bearish factor over the next 2 weeks:

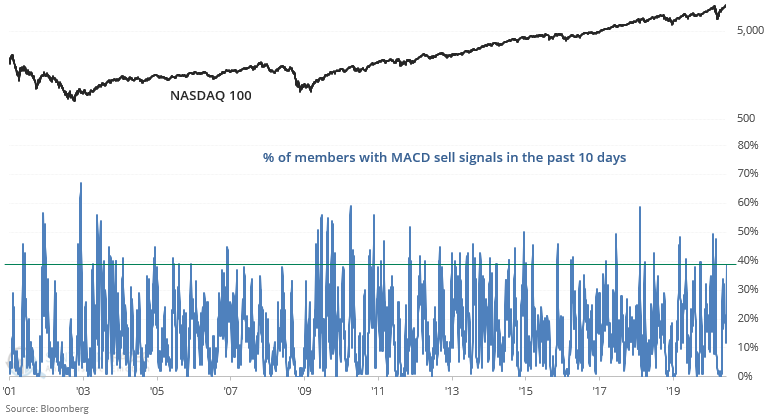
We can note the same behavior in other U.S. indices, such as the NASDAQ 100. More than 38% of NASDAQ 100 members have witnessed a MACD sell signal in the past 10 days:

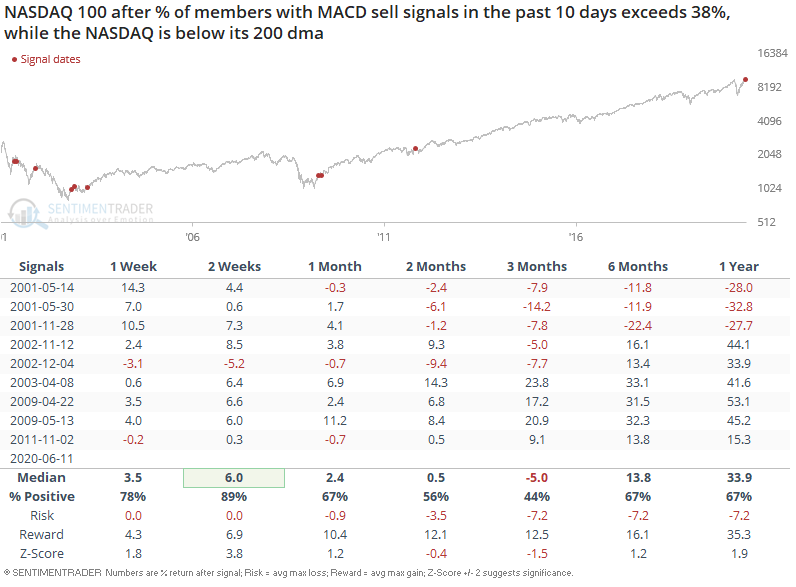
Historically, this was more bearish than random for the NASDAQ 100 over the next 3 months. This was moreso true during the 2000-2002 bear market:

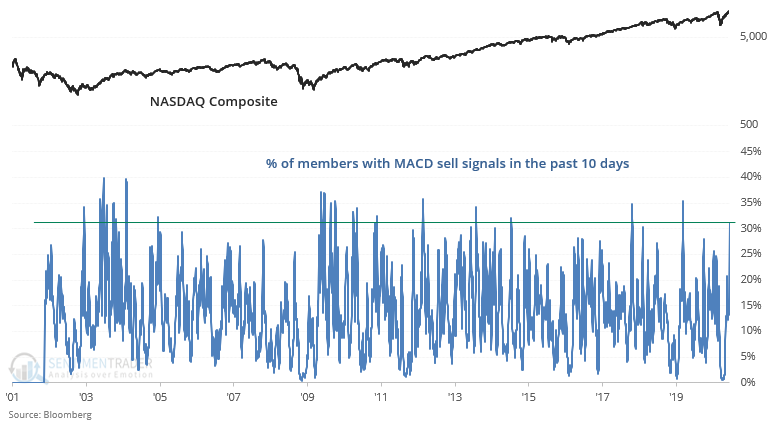
And 31% of NASDAQ Composite members have witnessed a MACD sell signal in the past 10 days:

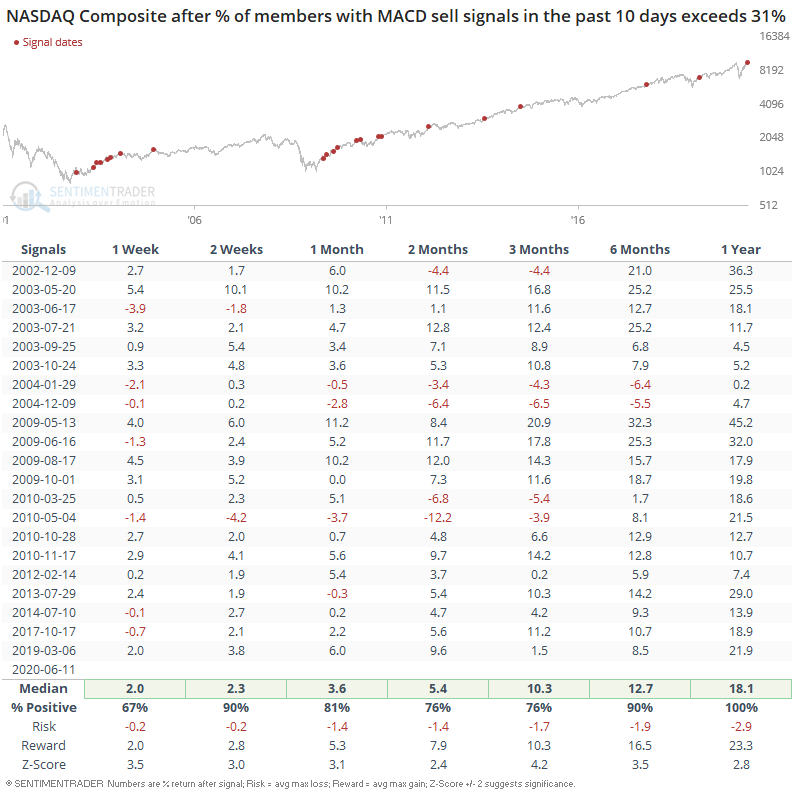
This wasn't consistently bearish for the NASDAQ Composite on any time frame:

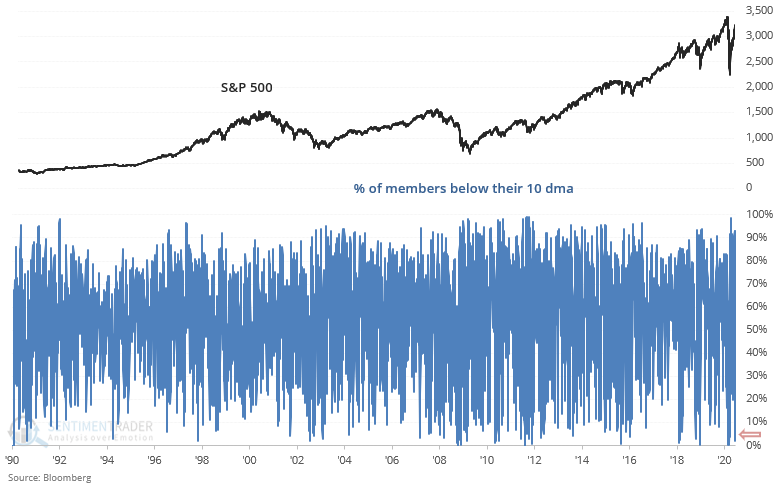
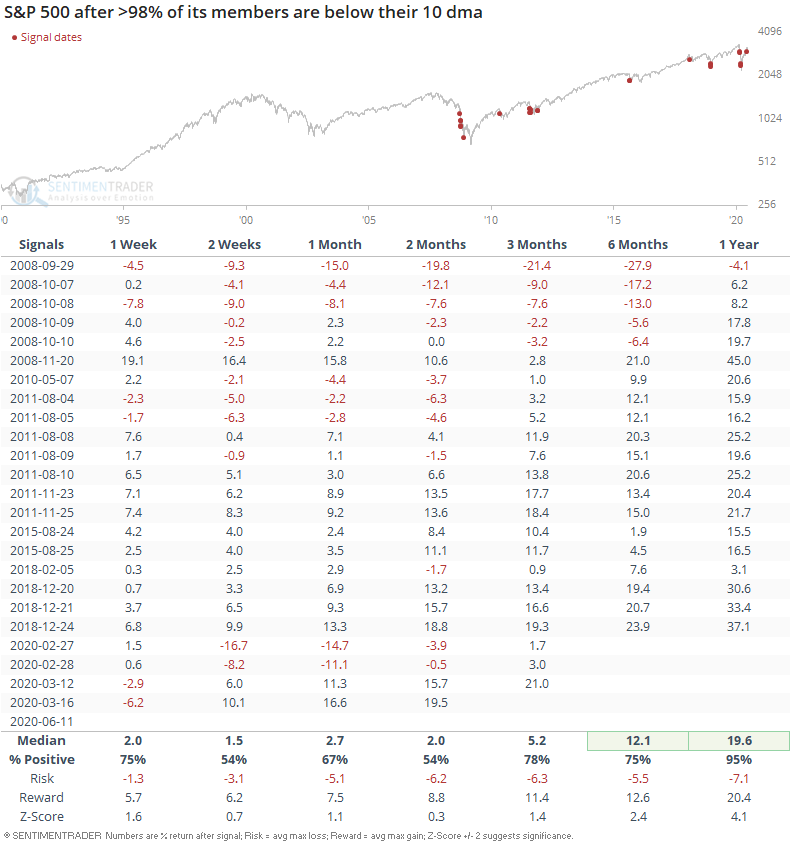
The sharp selloff has pushed more than 98% of the S&P's members below their 10 dma (short term moving average):

This was mostly bullish for stocks over the next year, although that's primarily because all of the historical cases occurred from the 2008 bear market - present. This comes to show that breadth readings are becoming more and more extreme, possibly due to the rising popularity of ETFs and the echo-chamber in many online trading rooms (e.g. Twitter, Reddit, Youtube).

From a slightly different perspective, 98% of NYSE volume flowed into issues that fell:

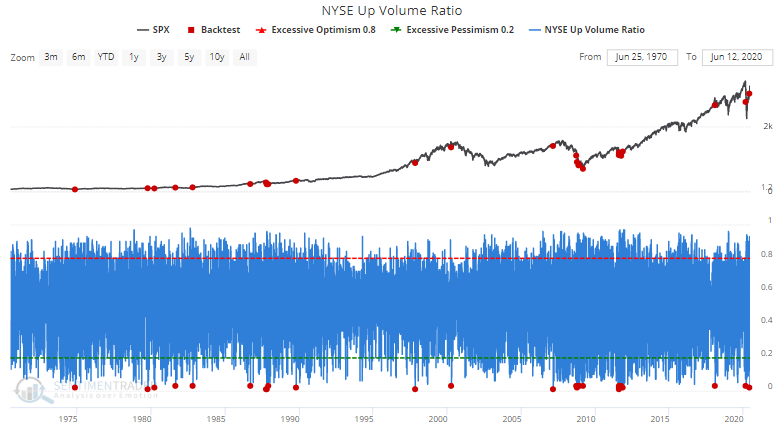
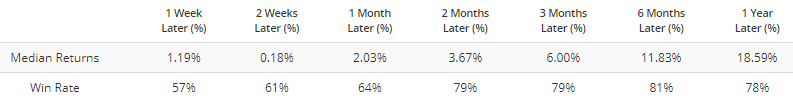
When this happened in the past, the S&P could pullback further in the short term. But this was mostly bullish for stocks over the next 2-6 months:

Similarly, 97% of NYSE issues fell:

The few other times this happened in the past all saw the S&P rally over the next 2-3 months, even if stocks did fall further in the short term:

Sorry, you don't have access to this report

Upgrade your subscription plan to get access
Go to Dasboard
DATA &
TECHnologies
IndicatorEdge
‍
BackTestEdge
‍
Other Tools
‍
DataEdge API
RESEARCH
reports
Research Solution
‍
Reports Library
‍
actionable
Strategies
Trading Strategies
‍
Smart Stock Scanner
‍
FREE
RESOUrCES
Simple Backtest
Calculator
Simple Seasonality
Calculator
The Kelly Criterion
Calculator
Sentiment Geo Map
‍
Public Research Reports
‍
Free Webinar
COMPANY
‍
About
‍
Meet our Team
‍
In the News
‍
Testimonials
‍
Client Success Stories
Pricing
Bundle pricing
‍
Announcements
‍
FAQ
© 2024 Sundial Capital Research Inc. All rights reserved.
Setsail Marketing
TermsPrivacyAffiliate Program
Risk Disclosure: Futures and forex trading contains substantial risk and is not for every investor. An investor could potentially lose all or more than the initial investment. Risk capital is money that can be lost without jeopardizing ones’ financial security or life style. Only risk capital should be used for trading and only those with sufficient risk capital should consider trading. Past performance is not necessarily indicative of future results.

Hypothetical Performance Disclosure: Hypothetical performance results have many inherent limitations, some of which are described below. No representation is being made that any account will or is likely to achieve profits or losses similar to those shown; in fact, there are frequently sharp differences between hypothetical performance results and the actual results subsequently achieved by any particular trading program. One of the limitations of hypothetical performance results is that they are generally prepared with the benefit of hindsight. In addition, hypothetical trading does not involve financial risk, and no hypothetical trading record can completely account for the impact of financial risk of actual trading. for example, the ability to withstand losses or to adhere to a particular trading program in spite of trading losses are material points which can also adversely affect actual trading results. There are numerous other factors related to the markets in general or to the implementation of any specific trading program which cannot be fully accounted for in the preparation of hypothetical performance results and all which can adversely affect trading results.

Testimonial Disclosure: Testimonials appearing on this website may not be representative of other clients or customers and is not a guarantee of future performance or success.