Wednesday Color - Russell vs Nasdaq, Sector Divvies, Bond Whipsaw, Jumps Above BBands

Here's what's piquing my interest on a quiet day.
Divergent
We've looked a couple of times at the remarkable shift in momentum between winners and losers, growth and value over the last couple of days. While it's tempting to read a broader shift into it, sharp, severe ones like this have happened before and were inconclusive about forward returns.
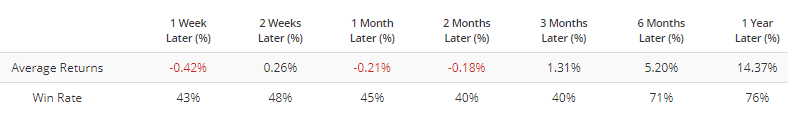
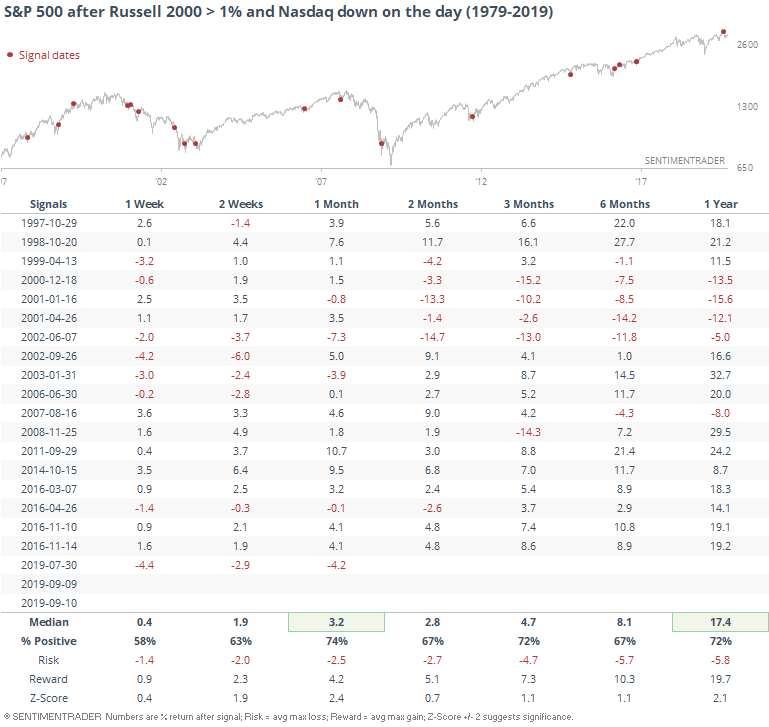
Another sign of the shift is noted by the WSJ, with the Russell 2000 rebounding more than 1% while the Nasdaq Composite fell. In terms of the broader implications, the S&P 500 tended to rise afterward.
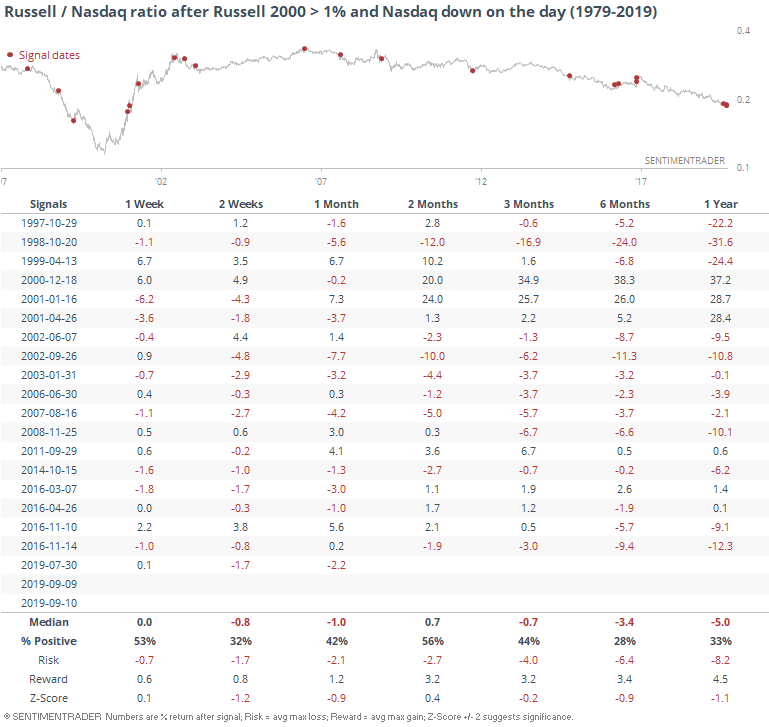
For the Russell, returns also tended to be positive, same for the Nasdaq. But the returns for the Russell trailed those for the Nasdaq, so the ratio between them tended to decline.
As Troy noted, there has also been a divergence between the Nasdaq and the Dow, with generally higher returns in the months ahead for the Dow in particular.
Good Values
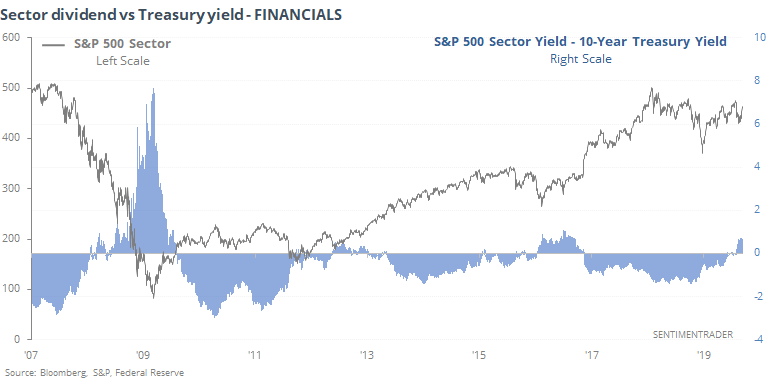
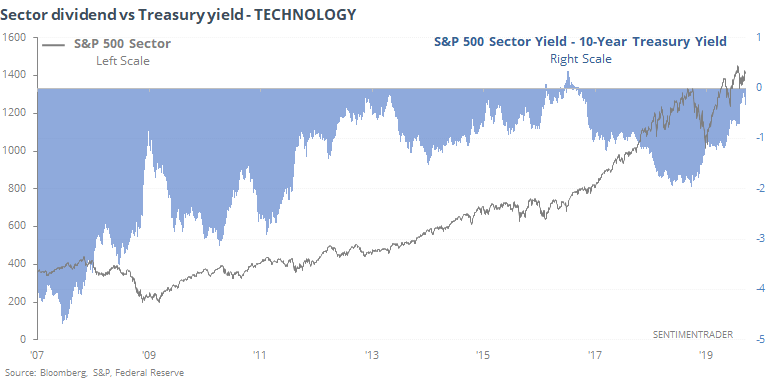
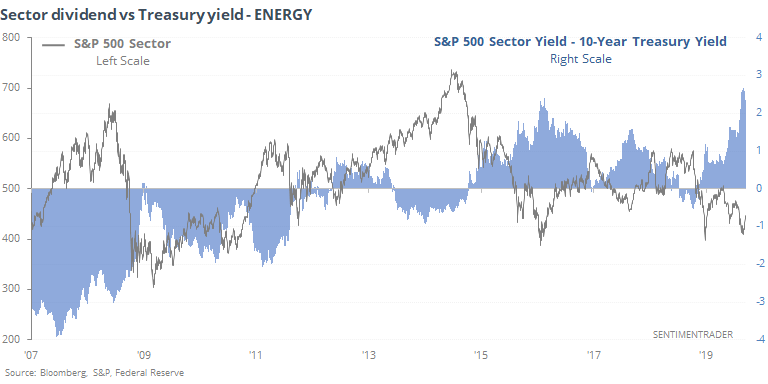
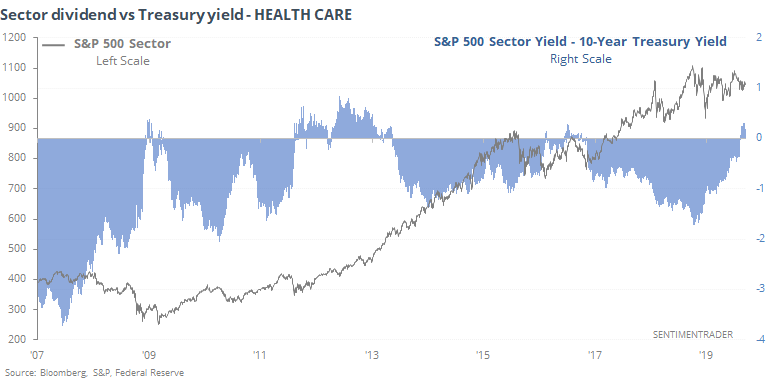
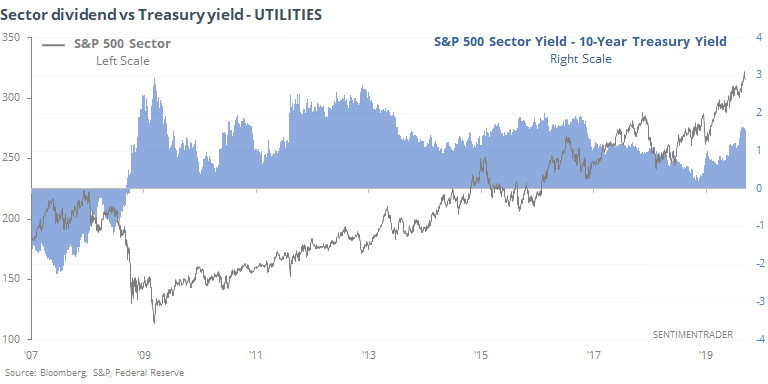
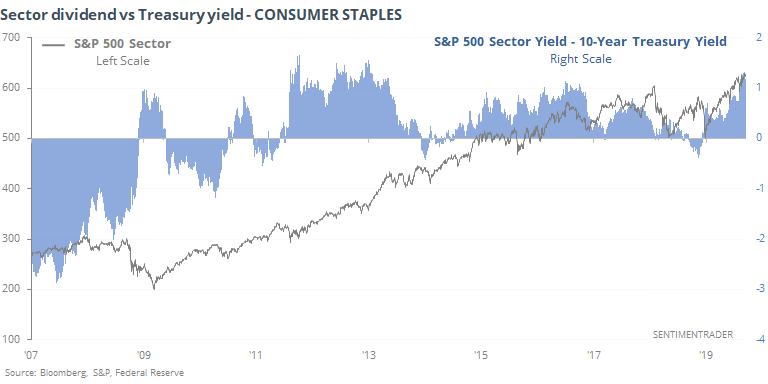
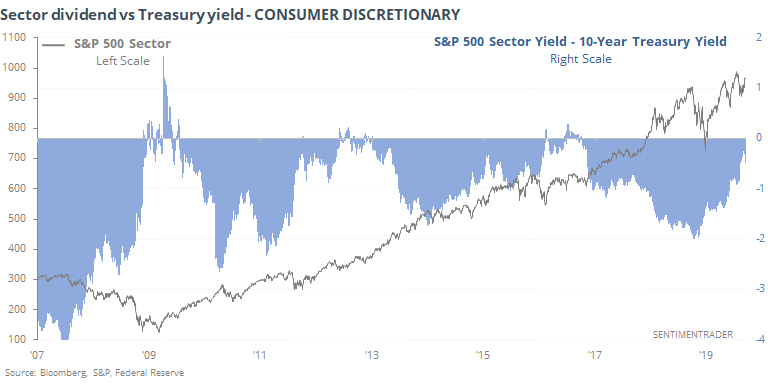
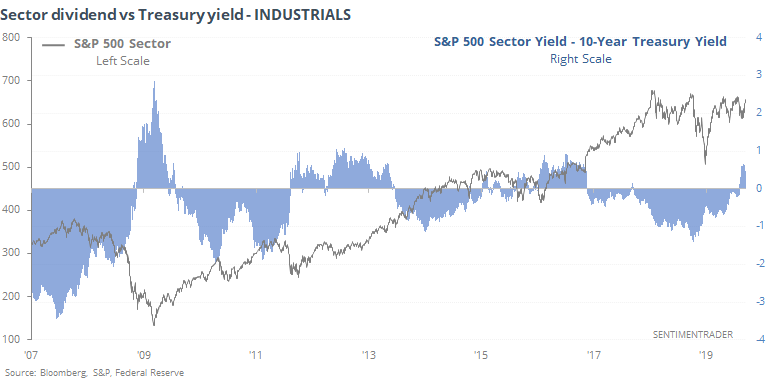
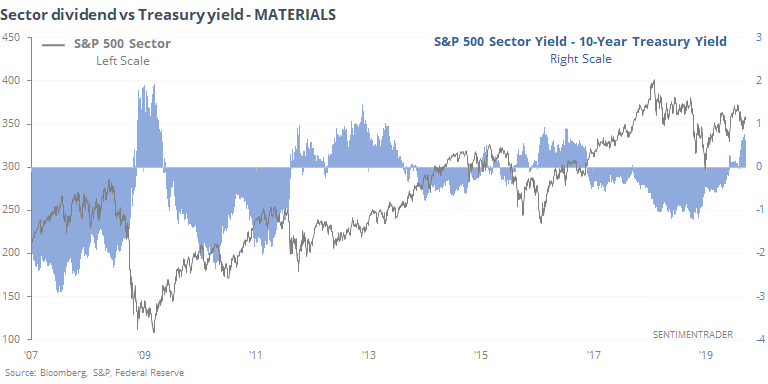
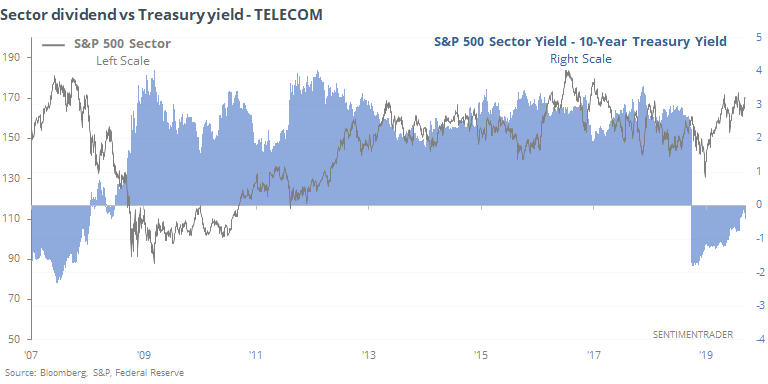
The WSJ, via Fidelity, notes that financials are yielding significantly more than 10-year Treasuries. Going back to 1990, this has not happened very often, and it has only happened since the financial crisis. Below, we can see the major S&P 500 sector dividend yields minus the Treasury yield versus the sectors' price.
The relative valuations look especially ripe in energy, financials, health care, industrials, materials, and even staples still.
Bond Whipsaw
It's getting a little harder for sectors' dividend yields to exceed that of Treasuries since bond (prices) have gotten slammed in recent days, driving yields higher. Maybe it's related to the huge momentum shift in stocks, but nobody really knows at this point. Or at least, they're not yet saying.
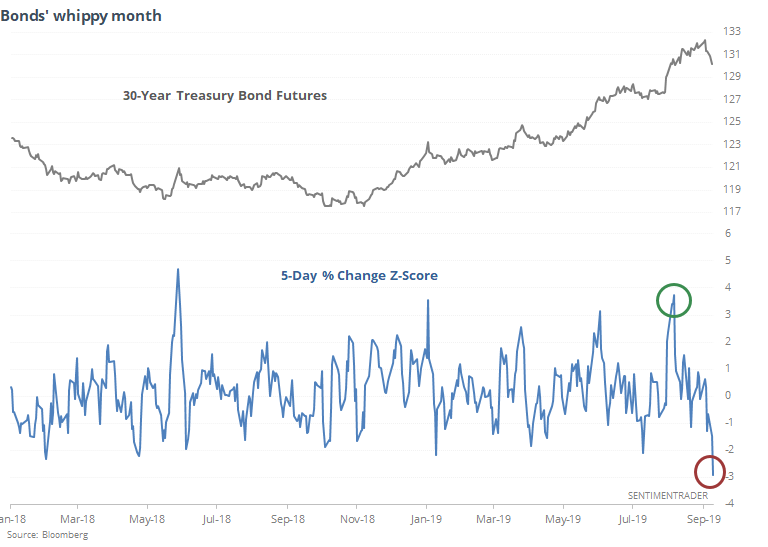
It's been especially acute on the long end, with prices on 30-year bonds swinging wildly over the past 30 days. First, they enjoyed spectacular 5-day rally, now a terrible 5-day decline. Relative to other moves over the past year, these are very large standard deviation changes.
Below, we can see every time since the inception of the futures when the 30-year bond contract when from a +2.5 standard deviation move to a -2.5 one within 30 sessions.
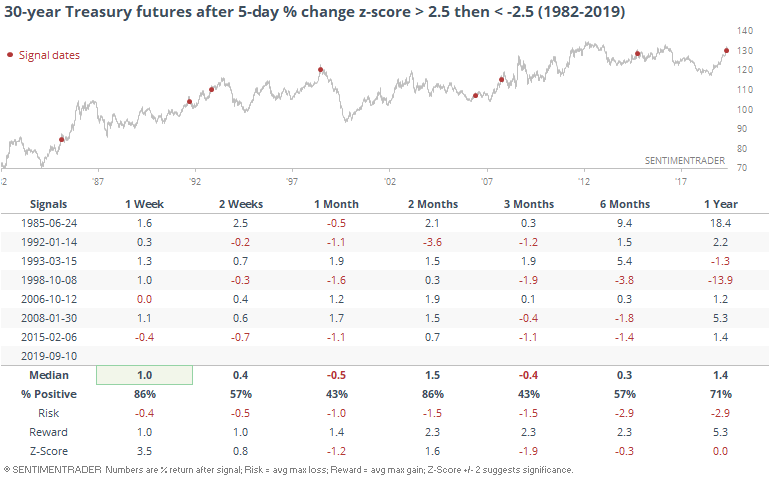
There was quite a bit of volatility, with short-term rallies, then declines, then rallies, then declines. Mostly, the risk/reward was questionable.
Jumping The Band
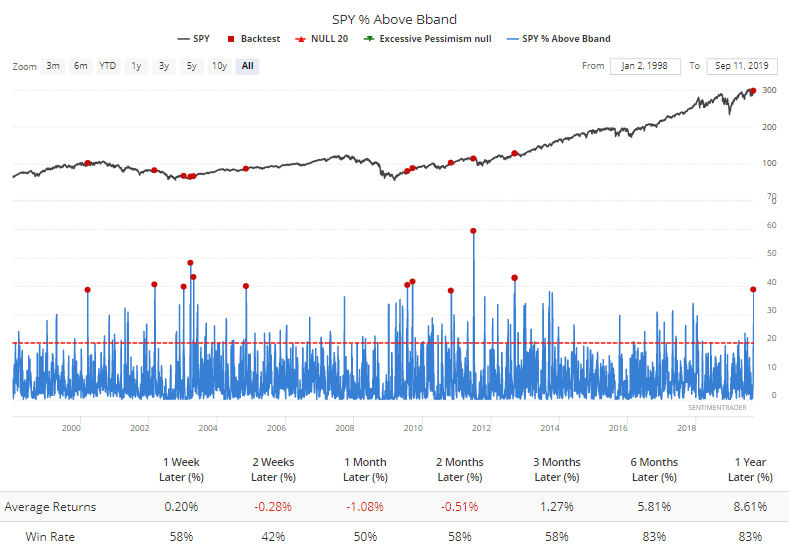
With a late bump on Tuesday afternoon, a lot of stocks popped out of their volatility bands. Every major index and sector ETF saw at least 20% of their component stocks rise above their upper Bollinger Band.
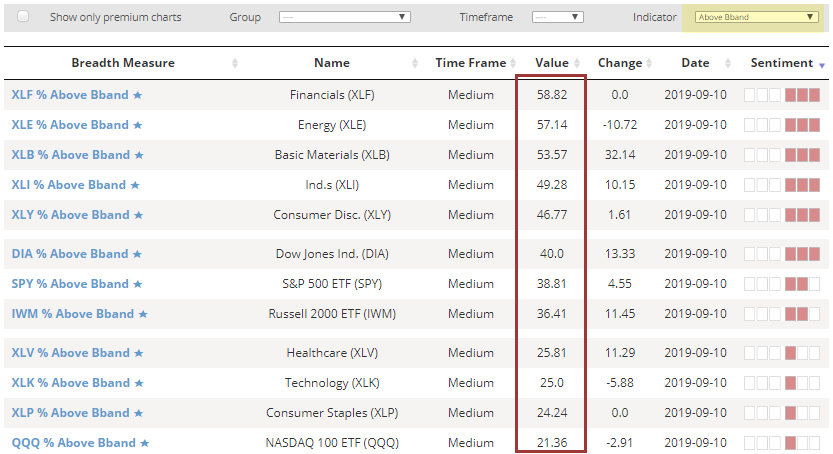
Mostly, it led to some shorter-term weakness as the buyers couldn't keep up such a frenetic pace. Here are some examples, such as for the S&P 500 fund, SPY.
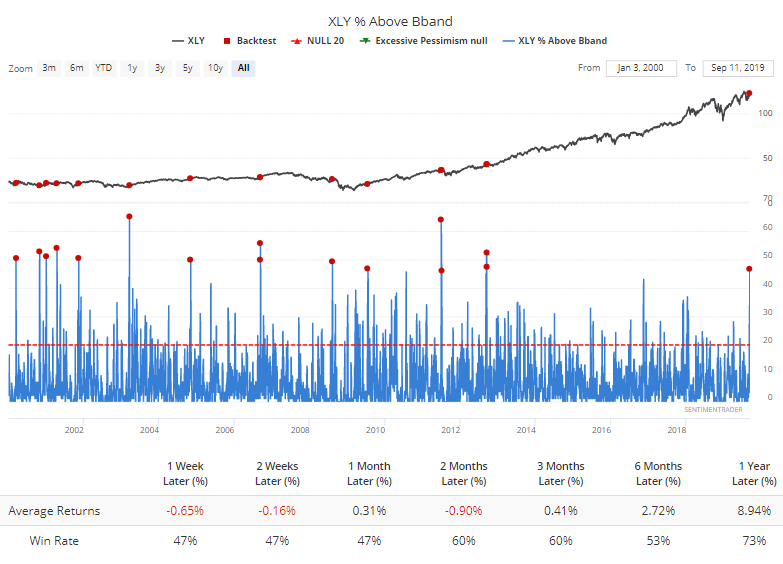
And XLY.
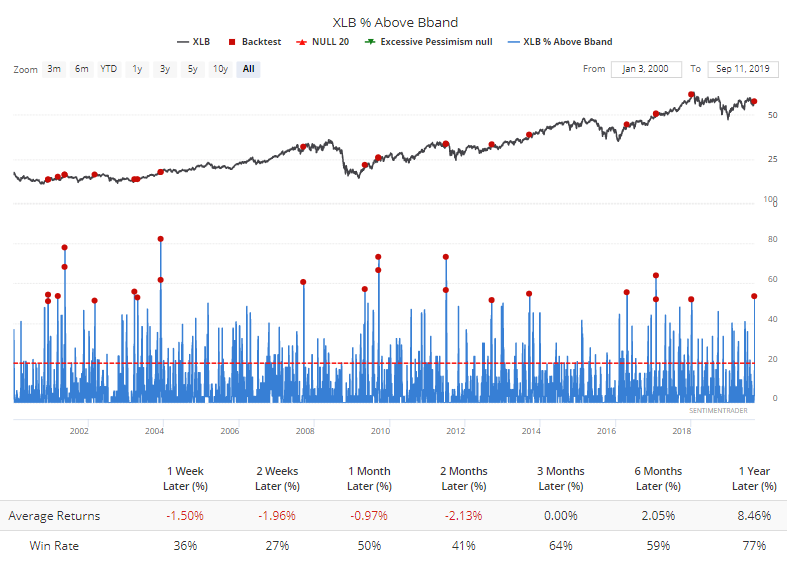
The materials fund, XLB, showed especially weak shorter-term returns.
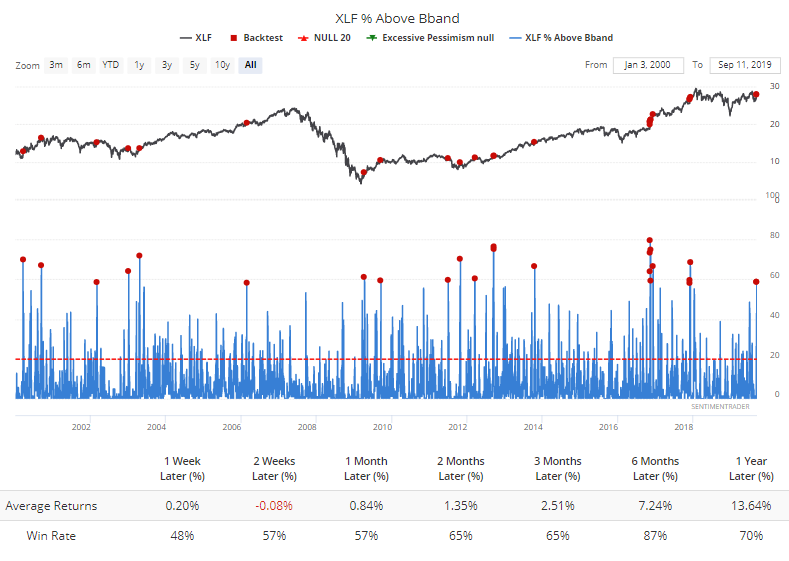
The XLF financials fund didn't fare too poorly, and it was a good longer-term sign for the sector.
The surge into down-and-out stocks, many in the energy sector, triggered nearly 70% of them to exceed their upper Bands. The few other times that's happened when XLE was still below its 200-day average, energy showed a negative return every time between 1-6 months later. The sample size is awfully small, though.
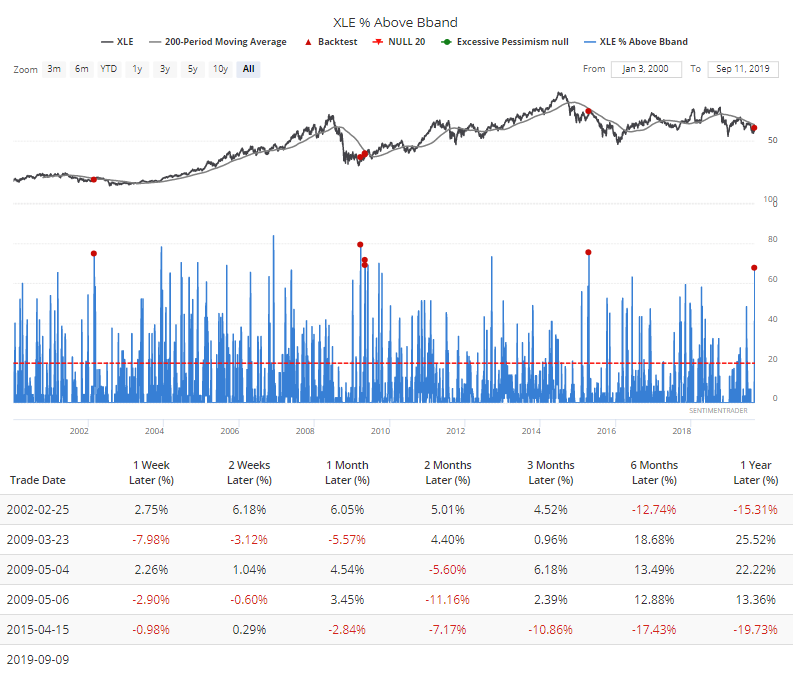
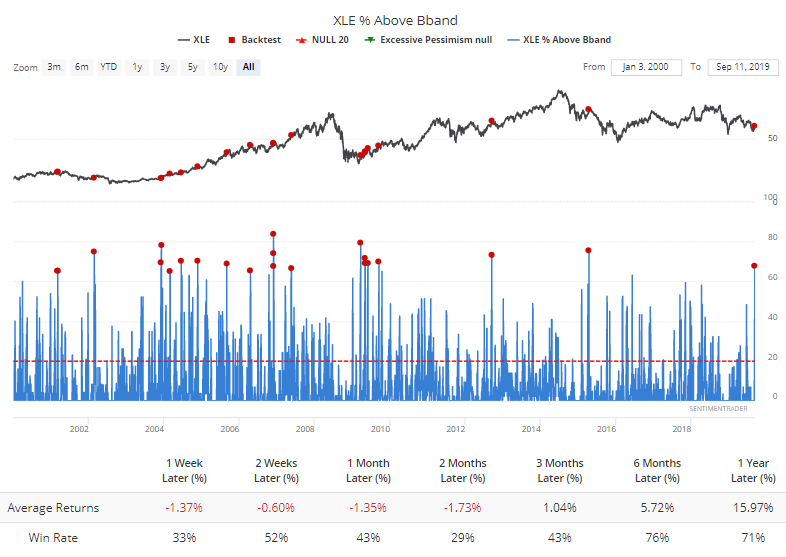
If we forget about the trend and just look at every time this many energy stocks exceeded their Bands, returns were still weak.
There was also a big jump in the percentage of energy stocks breakout out to a 1-month high. Again, during longer-term downtrends, the sector has had a lot of trouble holding this kind of momentum shorter-term.
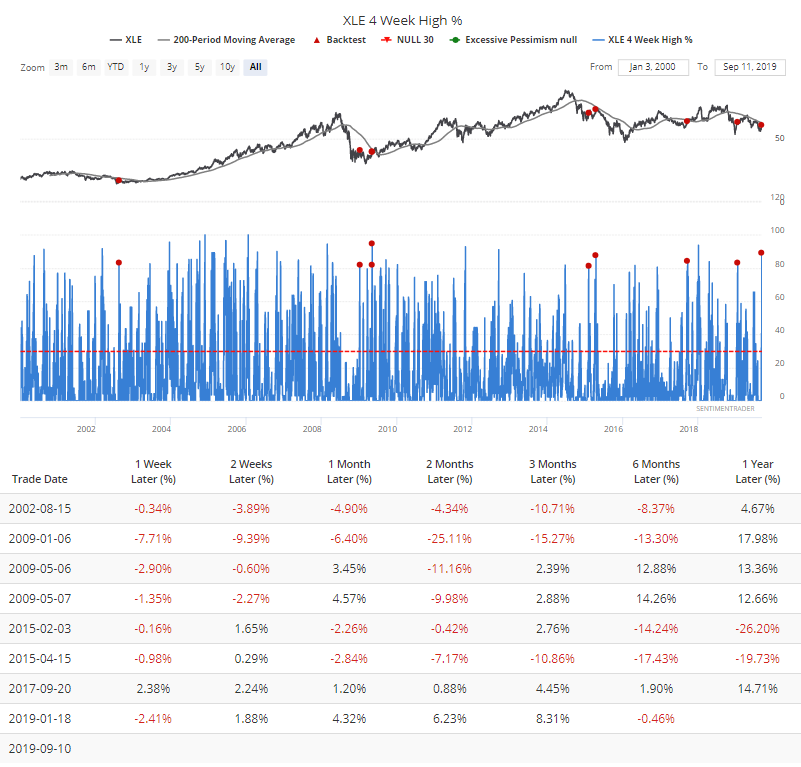
If we only look at times when XLE was above its 200-day average, returns were still pretty weak.