
What I'm looking at - NASDAQ McClellan, Rotation, Greed & Fear, Small Business Hiring, world economy
Here's what I'm looking at:
NASDAQ McClellan
The ratio-adjusted NASDAQ McClellan Oscillator, which looks at the momentum of the NASDAQ's breadth, has now exceeded 50.
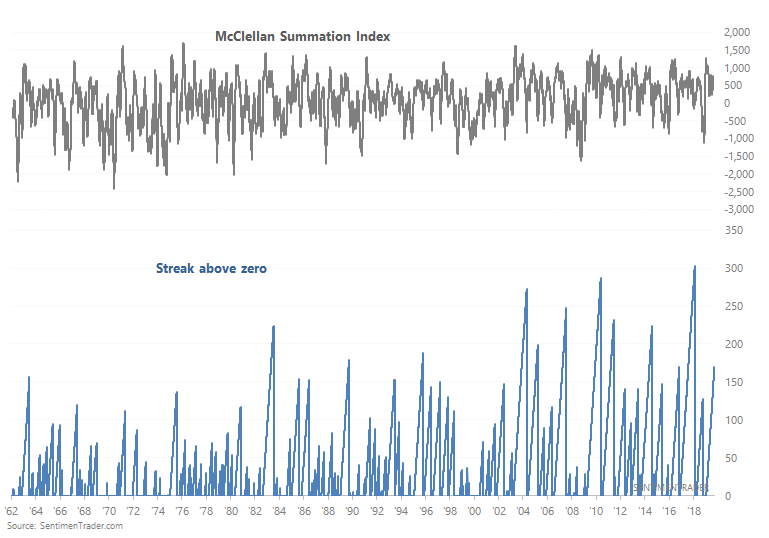
This figure isn't extremely high. But when the McClellan Oscillator crossed above 50 for the first time in more than 6 months, the NASDAQ Composite often did poorly over the next 2 months and 6 months.
Most of our recent stats have been bullish for stocks over the next few months. This is one of the few that's bearish, which demonstrates that never will you have a situation in which 100% of the factors are bullish or 100% of the factors are bearish. The world is not black and white.
Rotation
Much e-ink has been spilled recently about sector rotation. As usual, market watchers often see the same thing but interpret it in 2 different ones using easy-to-understand analogies:
- Bullish interpretation: sector rotation is normal and healthy for a bull market. Like passing the baton from one runner to another in a relay.
- Bearish interpretation: when the leaders stop leading, the bull market is dead.
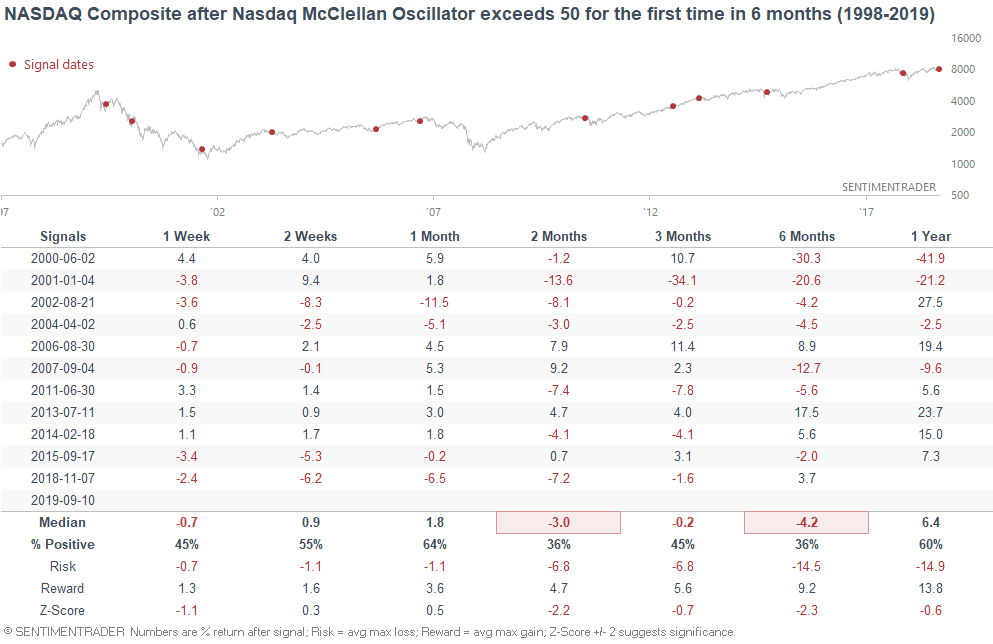
The Dow has rallied 5 days in a row, while the NASDAQ has fallen on 3 of the past 5 days. (Or as almost everyone has noticed, value is outperforming growth). This happened 19 other times from 1970-present.
Here's what happened next to the Dow:
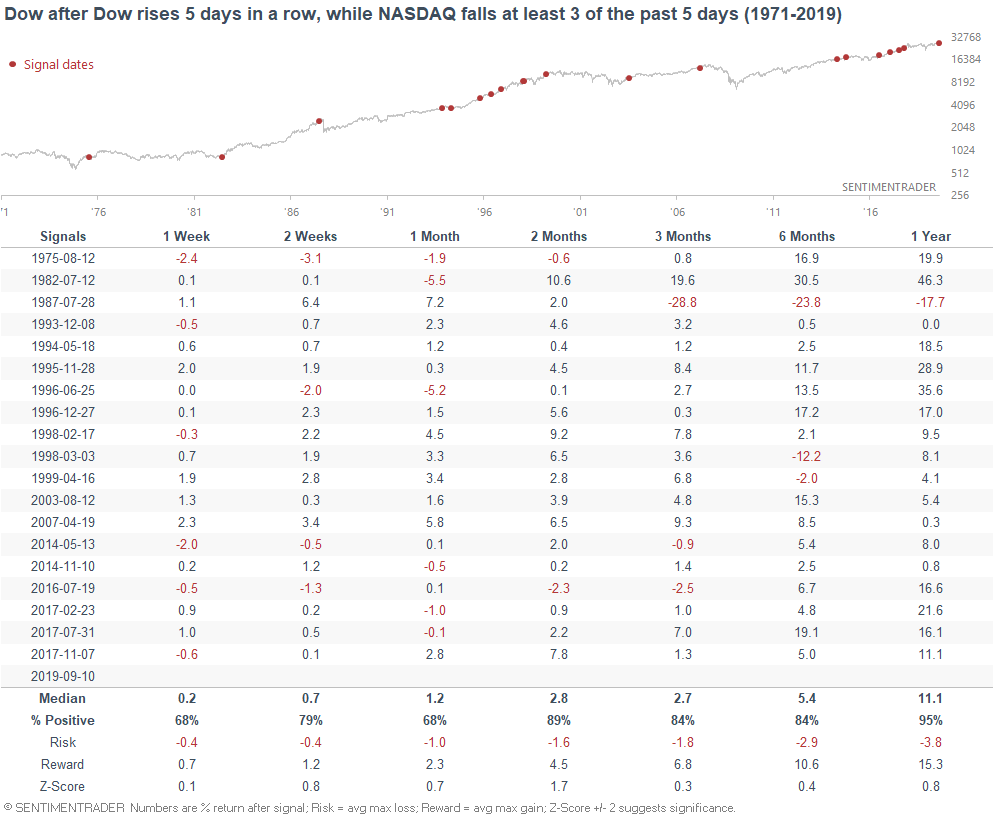
Here's what happened next to the NASDAQ:
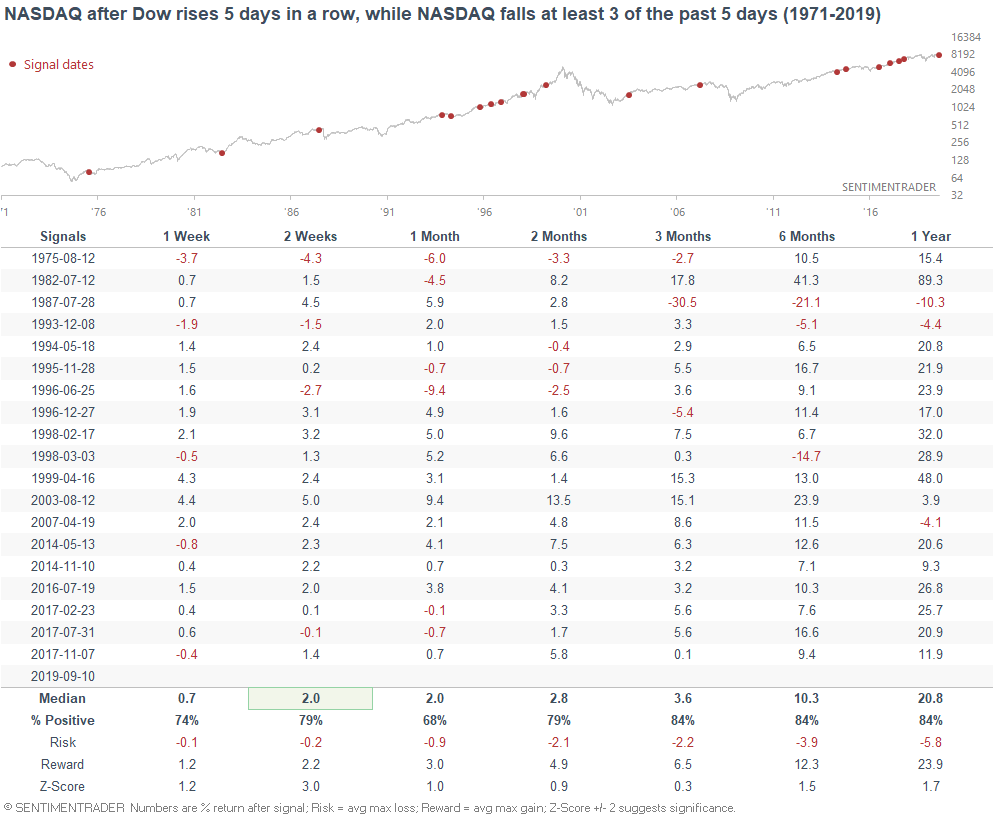
As you can see, this did happen before the 1987 crash and the 2007 bull market top. But overall, it was not consistently bearish for stocks on anytime frame. Something for everyone (bulls and bears), but this overall favors the bulls.
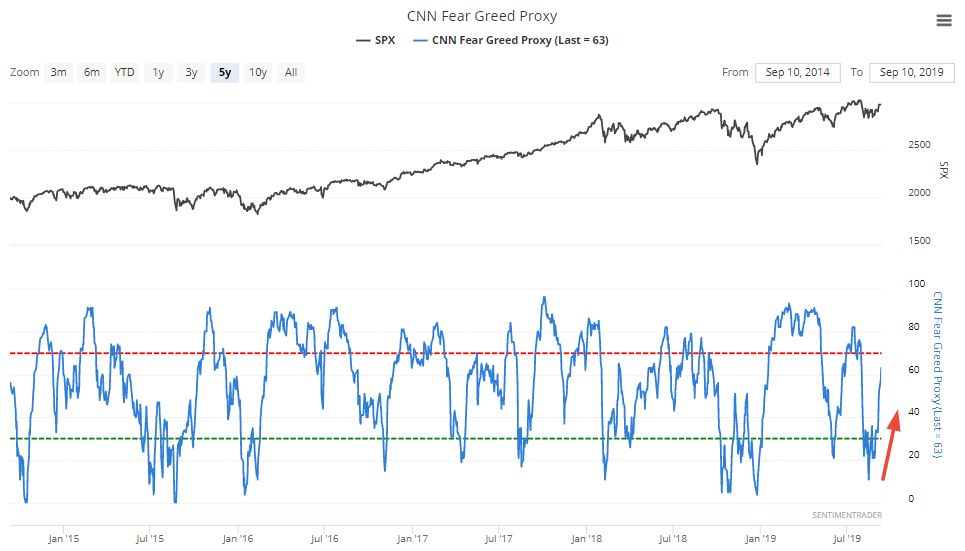
Fear: Quick trip and back
The popular CNN Fear Greed Index has made a quick trip to excessive pessimism and back. It is now at 63, whereas less than 1 month ago it was at 11.
When this happened in the past, the S&P 500 was often choppy over the next month.
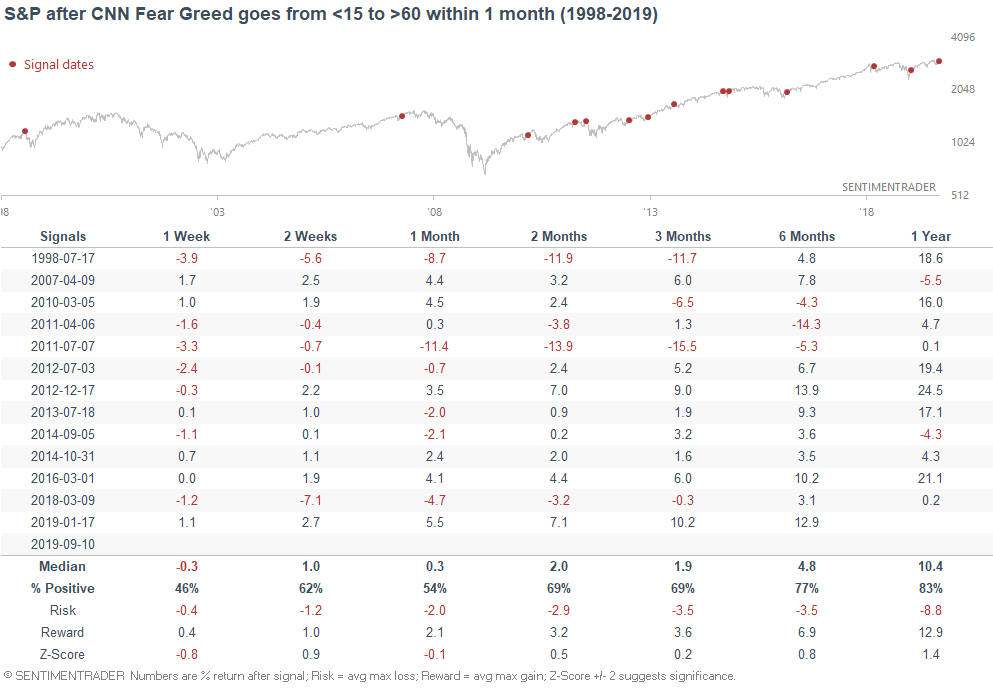
On an interesting sidenote, most of the signals have occurred in the current bull market. Some market observers have noted that the market nowadays is more one-directional than it was in the past. Either everything goes up, or everything goes down. This is why extremes can happen much more quickly nowadays than it did in the past.
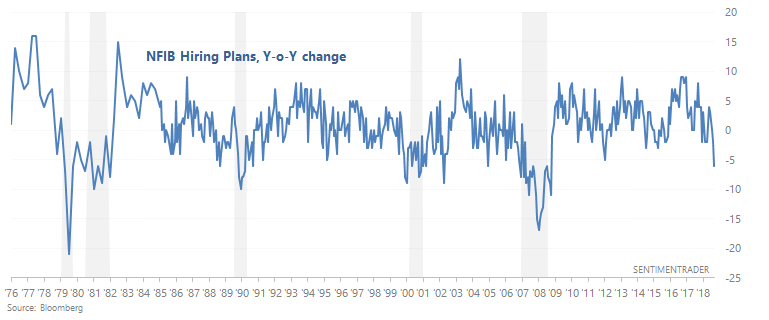
Small Businesses
Small businesses have cut back on hiring plans, causing NFIB Hiring Plans to fall -6 year-over-year. Part of the reason is due to tight labor markets, which is typical of late-cycle economic expansions. Sooner or later tight labor markets turn into deteriorating labor markets.
Similar historical cases almost exclusively occurred within the context of a recession. As you can see, the S&P's 6-12 month forward returns are worse than random.
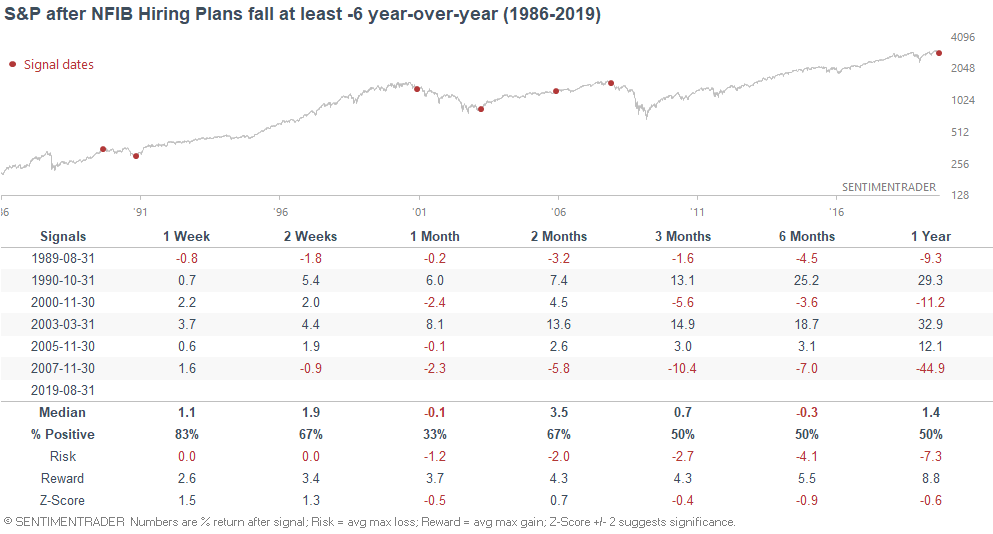
I wouldn't consider this to be an outright bearish factor for the stock market, but it does highlight the stock market's main long term risk. The economy is either at or extremely close to "as good as it gets", which you can see by the extremely low unemployment rate. Since the stock market and economy move in the same direction in the long run, an economy that's "as good as it gets" means that the stock market's long term downside risk is significant.
Labor market indicators are extremely useful for timing the market. They have not shown significant deterioration yet, so the labor market is still a positive factor for the stock market. But since the labor market is extremely tight, labor conditions may start to deteriorate at any moment. Stay vigilant in case conditions change.
World economy
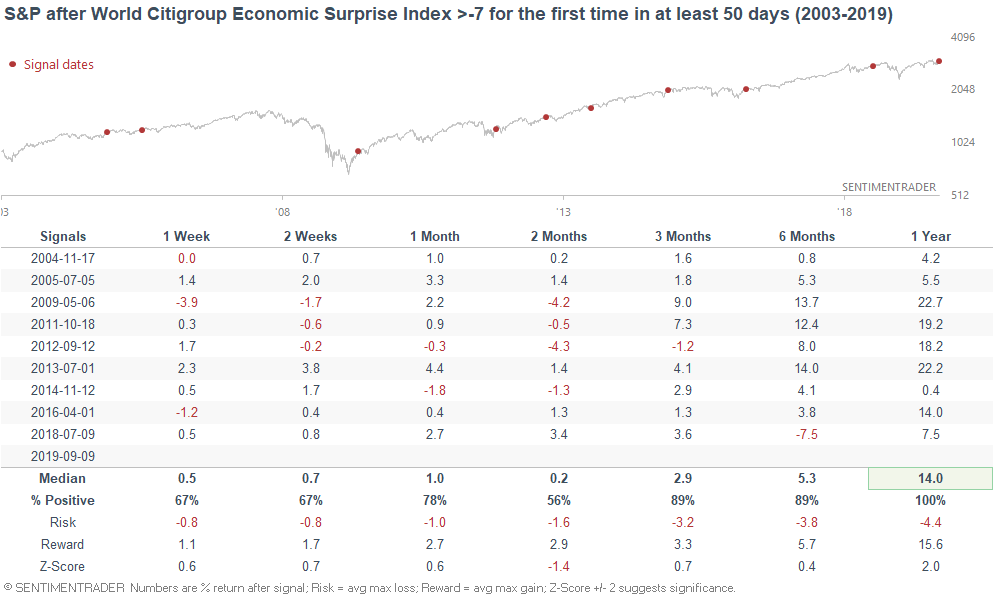
And lastly, the World Citigroup Economic Surprise Index is finally starting to go up, after the longest streak since this data series began in 2003. It seems that global economic data is finally not *sucking* vs. analysts' expectations.
*It's important to remember that a "global recession" IS NOT the same thing as a U.S. recession. However, the recent streak of weak world economic data has also coincided with semi-weak U.S. data. This was not always the case historically.
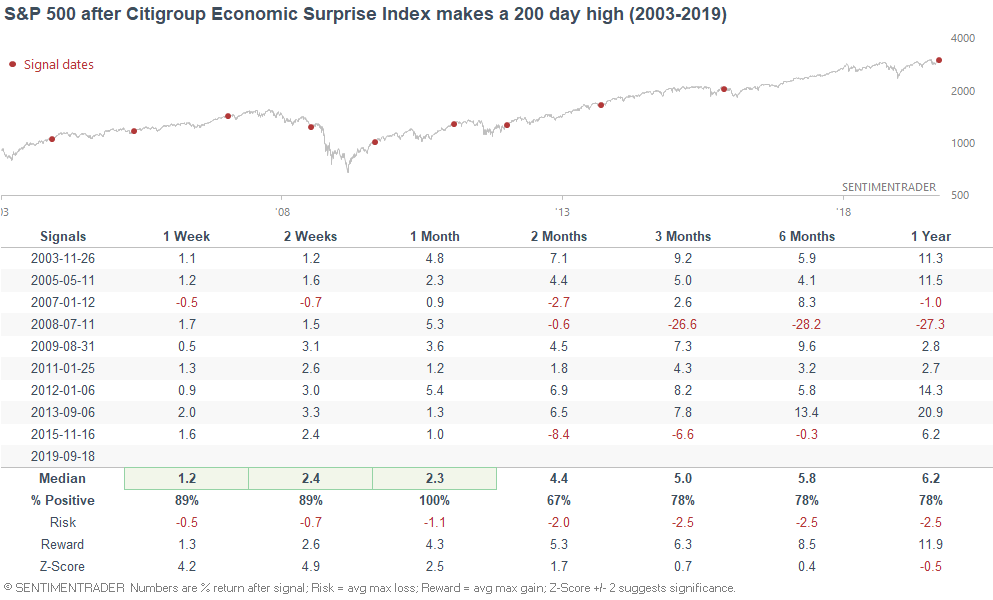
When such streaks ended in the past, the U.S. stock market (which accounts for 40-50% of the global stock market) usually did well.
Here's what happened next to the MSCI World (ex-U.S.) Index:
Ex-U.S. stocks have not been as consistently positive as U.S. stocks, and that's mainly because ex-U.S. stocks have generally underperformed U.S. stocks over the past 10 years.