Two Factors Still Weighing on Gold Stocks and One Potential Positive
As I wrote about here and here, I am more than willing to consider becoming bullish on gold - if only gold would show that it wants to be bullish. But, alas, Murphy's Law being what it is, gold plummeted almost immediately after I published the most recent "hopeful" article. So this seems like a good opportunity to invoke:
Jay's Trading Maxim #8: Murphy's Law states that "whatever can go wrong will go wrong." But traders need to pay more attention to Murphy's Corollary, which states: "Murphy hates you. Plan accordingly."
The outlook for gold stocks remains somewhat murky as well, with at least two significant headwinds to overcome.
SEASONALITY
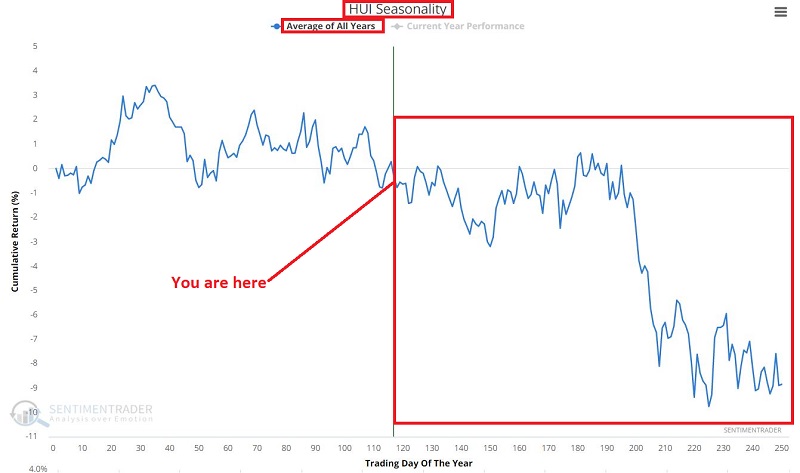
The chart below displays the Annual Seasonal trend for ticker HUI (Gold Bugs Index of mining stocks), for which I have data going back to 1957.

The chart below displays the Annual Seasonal trend for ticker GDX (VanEck Vectors Gold Miners ETF), for which I have data going back to 2006.
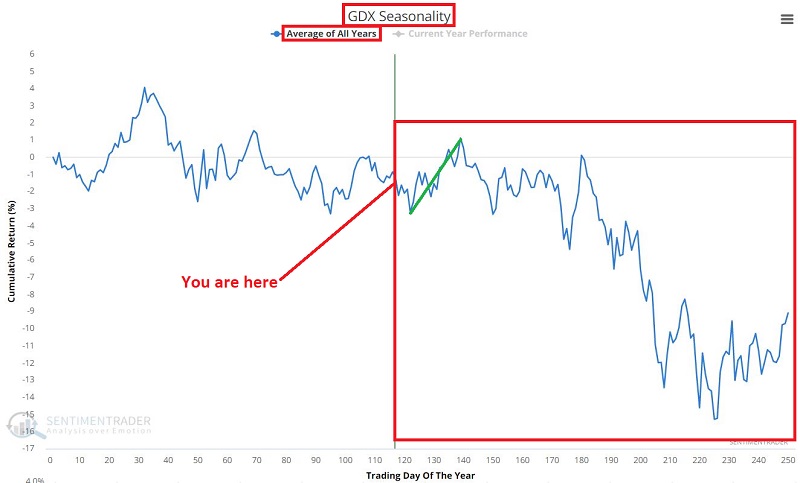
At a glance, neither inspires a great deal of bullish confidence for the months ahead.
SENTIMENT
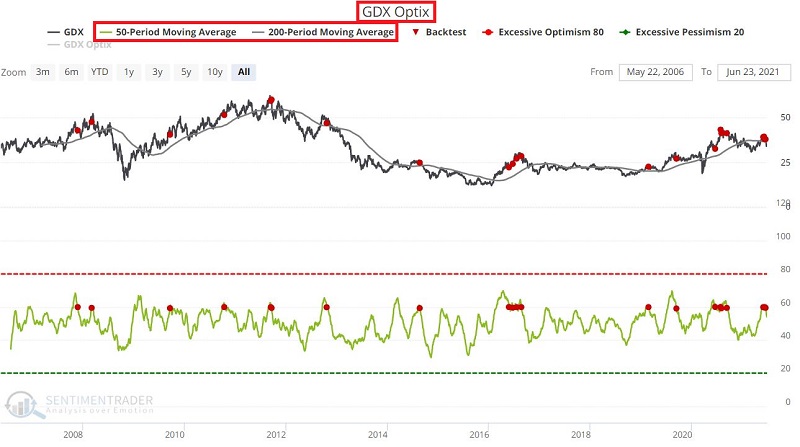
Now let's look at GDX Optix. Specifically, we will look at those times when:
- GDX is above its 200-day moving average
- The 50-day average for GDX Optix crosses below 60
Clicking this link and then "Run Backtest" will allow you to run this test. In a nutshell, this identifies a waning level of bullishness within a price uptrend.
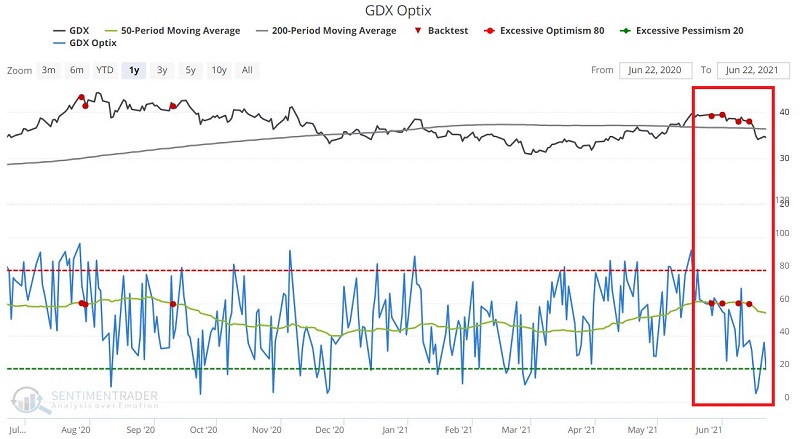
The chart below highlights the signals generated by the parameters above.
The table below displays the summary of GDX performance following such signals.

A decline in GDX following this signal is by no means a "sure thing." But the important thing to recognize is that it does tend to act as a strong headwind.
As you can see in the chart below, there was a flurry of signals between 5/27/2021 and 6/14/2021.
Do the so-so seasonality and apparently negative sentiment reading preclude gold stocks from rallying in the near term? Not necessarily. …..
ONE POTENTIALLY BULLISH FACTOR
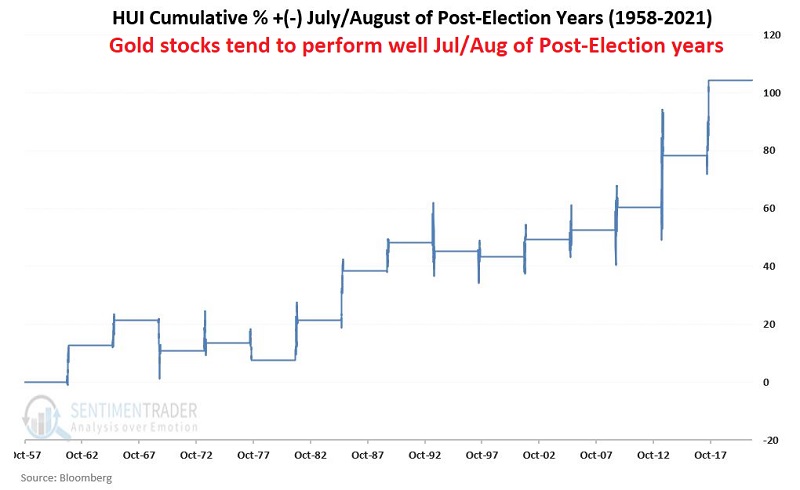
For gold stocks, the months of July and August have been much more favorable during the Post-Election Year than during Mid-Term, Pre-Election, and Election Years. The chart below displays the cumulative % gain for HUI ONLY during July and August of the Post-Election years since 1957.
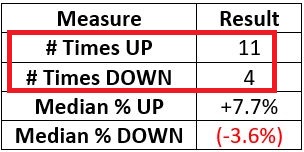
For the record, the table below displays a summary of July/August performance for HUI ONLY during post-election years.
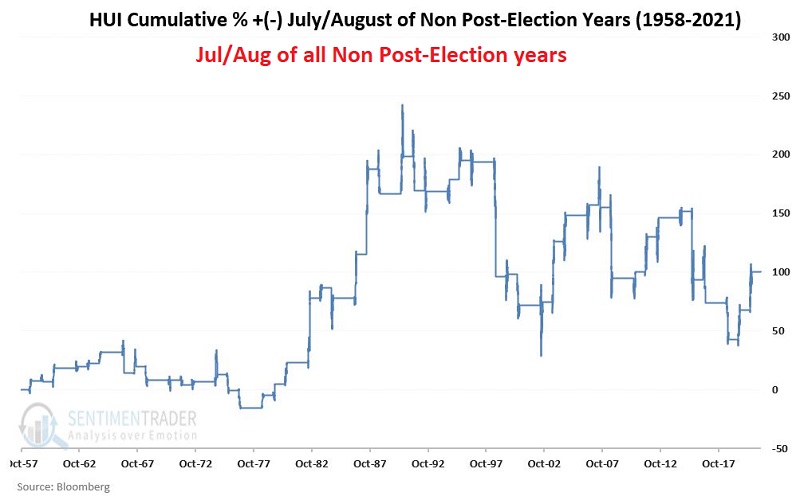
The table below displays the cumulative % +(-) for HUI ONLY during July and August of all other years within the 4-year election cycle.
As you can see in the chart above, after the post-election year, July and August HUI performance was much for volatile and a great deal less consistent.
SUMMARY
IF inflation remains an issue and/or IF the U.S. Dollar exhibits significant weakness (one reason it might, one reason it might not), both gold and gold stocks could stage significant rallies. But for now, both gold and gold stocks have some proving to do.


