
An Update on a Simple but Effective Gold Indicator

This is an update to an article I originally posted in April 2021.
There is a lot of chatter these days about the "impending huge rally in gold (and other related stocks and precious metals)." Of course, with the expansion of U.S. government spending and the national debt in the last 12 months, the talk of "inevitable hyperinflation" flows pretty freely. And maybe it will, in fact, all play out that way - with gold, silver, and mining stocks all experiencing explosive rallies.
But gold still has some proving to do first.
When you strip away all of the seemingly endless rhetoric, the reality is that - as with every other tradable - there is a time to own gold and a time not to own gold. What follows is one attempt at discerning when the time is right - or not right - to own gold.
GOLD VERSUS THE S&P 500
The chart below is from www.Stockcharts.com. The chart shows the price of gold divided by the price of the S&P 500 Index (designated by entering "$GOLD:$SPX" as the Symbol) along with a 200-week exponential moving average of this ratio.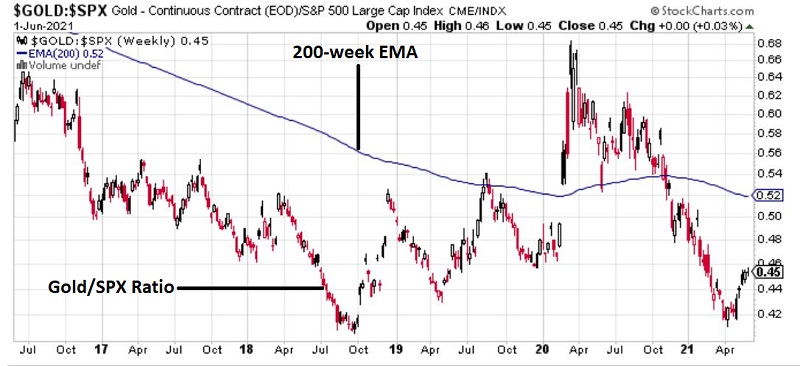
This chart can be reviewed once a week. In a nutshell:
- It is considered BULLISH for gold when this ratio is ABOVE the 200-week moving average
- It is considered BEARISH for gold when this ratio is BELOW the 200-week moving average
At present:
- The ratio is BELOW the moving average, so the indicator is still considered to be bearish for gold
- A rise back above the 200-week moving average would suggest a bullish new upleg for the price of gold
USING THE RATIO FOR TIMING
I am about to discuss the method I learned from Mark Ungewitter, Senior Vice President and Senior Investment Officer of Charter Trust Company in Concord, NH. Although we have never met, I have developed a great respect for his work. The indicator we will use is calculated as follows:
A = Weekly closing price for gold bullion
B = Weekly closing price for S&P 500 Index
C = (A / B)
D = 200-week exponential moving average of C
E = (C - D)
In essence, E is simply the latest Gold/SPX ratio compared to its own 200-week exponential average.
Interpretation is fairly simple:
- If E > 0, then favorable for gold
- If E < 0, then unfavorable for gold
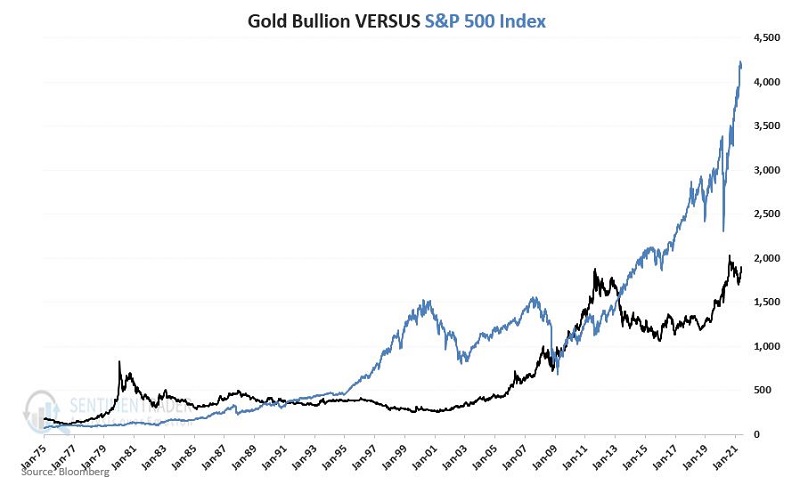
The chart below displays the price of gold (black line) and the price of SPX (blue line) since 1975. Note that they frequently appear to move in different directions.
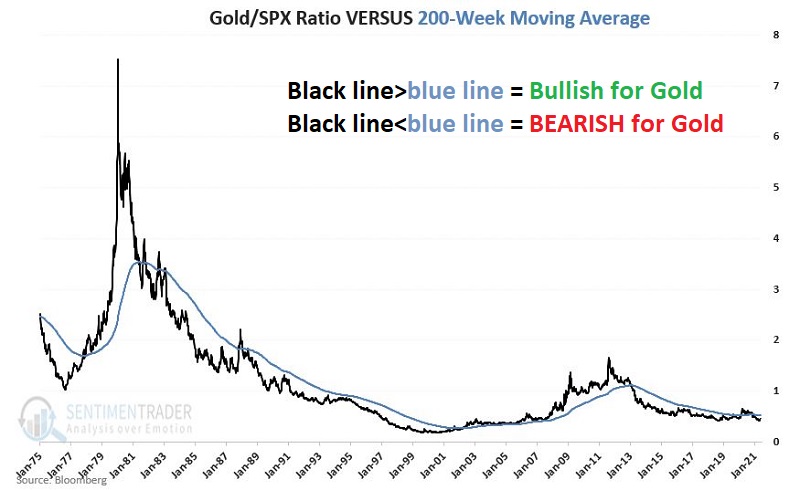
In the chart below:
- The black line in the chart below displays Variable C (the Gold/SPX ratio)
- The blue line displays variable D (the 200-week exponential moving average of C) since 1975
Our theory is that it is bullish for gold when the black line is above the blue line and vice versa.
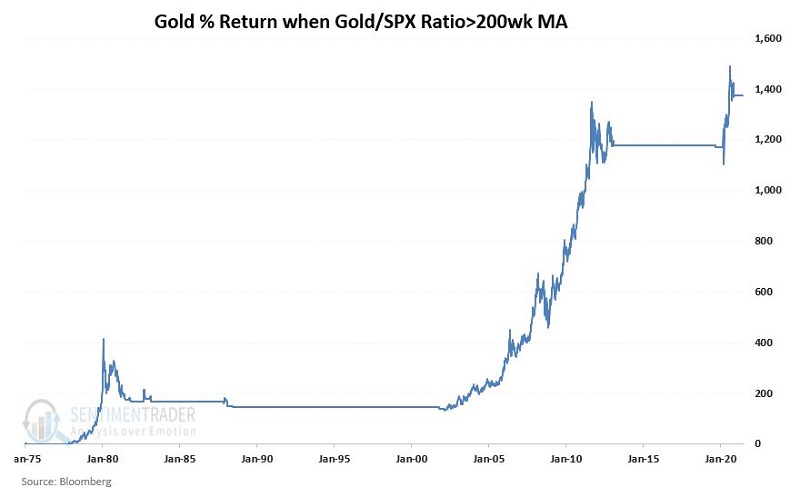
Does this form of analysis actually offer investors any useful information? First, let's look at the actual performance of gold during the two different scenarios and see.
The chart below displays the cumulative growth in the price of gold ONLY when the Gold/SPX ratio is ABOVE its 200-week EMA.
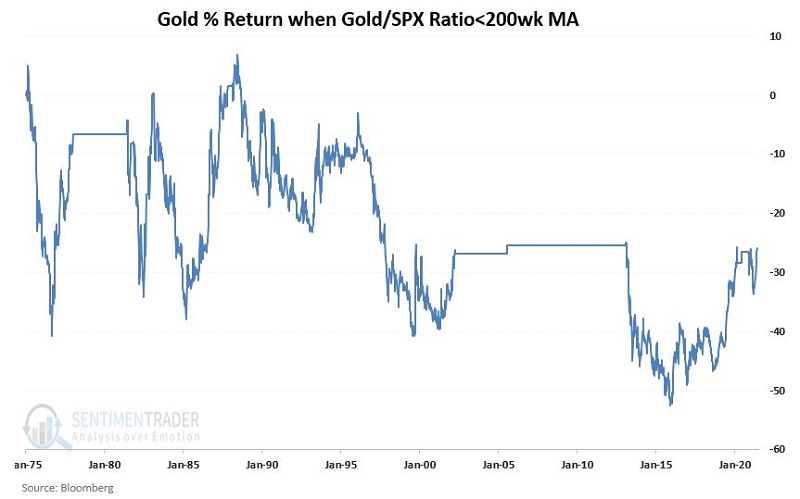
The chart below displays the cumulative growth in the price of gold ONLY when the Gold/SPX ratio is BELOW its 200-week EMA.
The table below displays the cumulative performance for gold-based solely on the method described above from January 1975 through May 2021.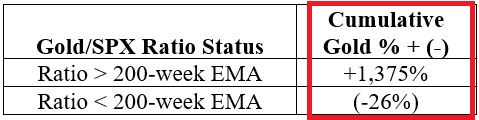
At present, the Gold/SPX ratio remains below its 200-week EMA.
Does this mean that gold cannot and/or will not rally anytime soon? Not at all. It simply means that some improvement in the relationship between the performance of gold and the performance of the S&P 500 Index must occur BEFORE this particular indicator once again favors gold. This reversal of fortune could happen quickly if gold were to pop and/or if stocks were to swoon.