
TradingEdge for Apr 15 - Defensive sector breadth surge, economic headwinds, bond bears

Key points:
- Utility stocks have surged, recording the most persistent push of new highs in 70 years
- Other defensive sectors are also showing impressive breadth relative to cyclical sectors
- Within Health Care, there are some relative strength buy signals
- Economic headwinds have picked up, including a drop in the Heavy Truck Index
- Credit spreads have become more correlated with stock prices, another headwind
- German stocks have triggered a sentiment sell signal
- Technology, on the other hand, has a (brief) seasonal tailwind
- Bond sentiment is about as bad as it has been in at least 30 years
About that surge in Utility stocks
A funny thing has been happening in stocks since late February. Stocks usually relegated to widows and orphans have behaved like supercharged tech stars. The Dow Jones Utility Average enjoyed its 2nd-largest 30-day rate of change in 20 years.
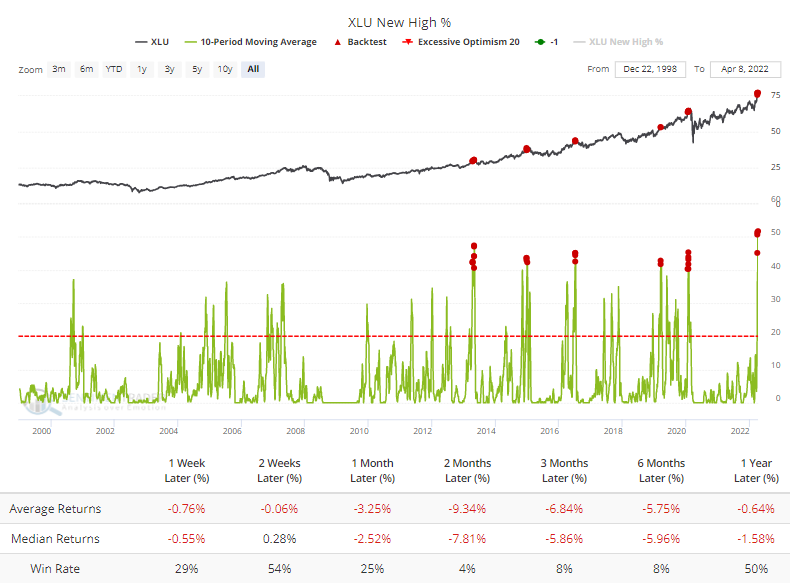
The surge has been so great that more than 60% of them became overbought on an average day over the past 2 weeks. The jump in overbought stocks pushed more than half of them to 52-week highs on an average day over the past 10 sessions, a 23-year record. The Backtest Engine shows that future returns are horrid when the 10-day average reaches even 40%. Of 24 days, only 1 barely eked out a positive return 2 months later.
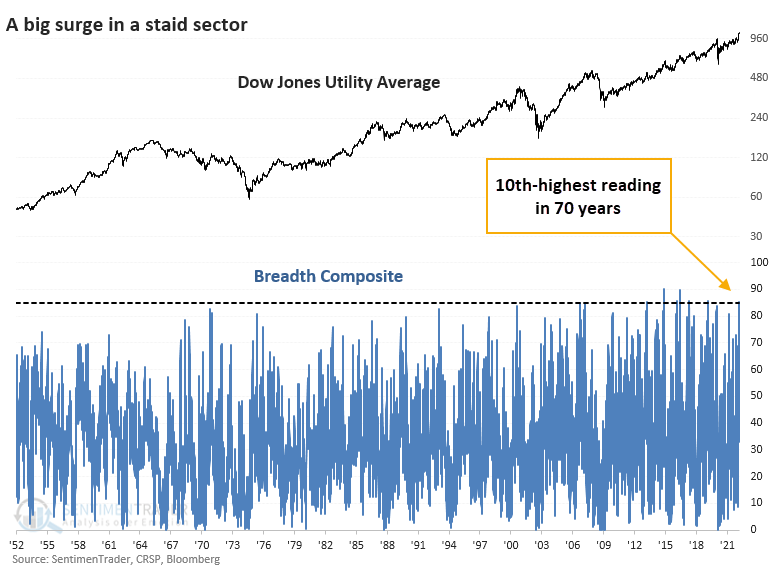
Even more astounding, a 10-day period when more than half of Utility stocks hit a 52-week high is a record dating back 70 years. In other words, at no other time since 1952 have so many of these stocks hit new highs at the same time for such a long stretch.
If we put together a composite breadth indicator that incorporates 7 different breadth metrics, it just hit the 10th-highest reading since 1952.
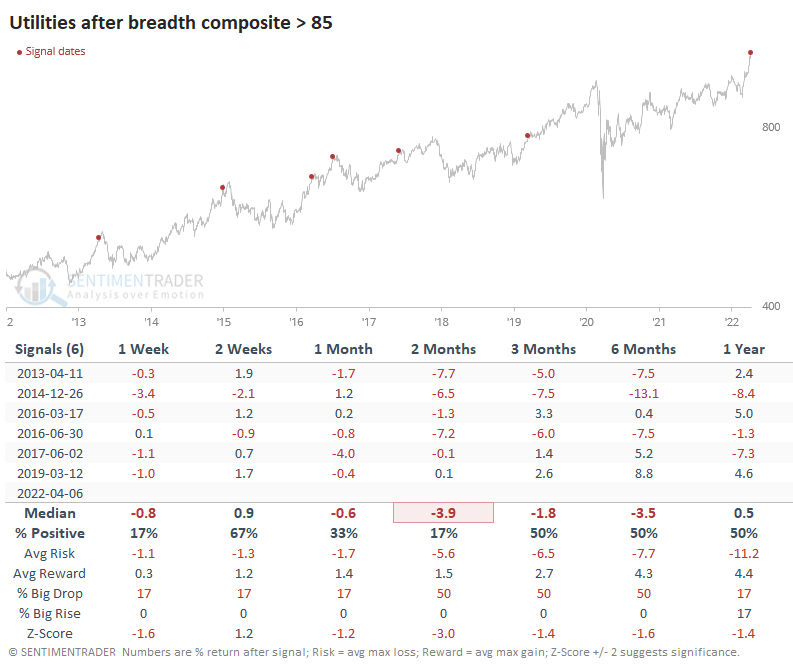
All of the highest readings have come in the past decade. All of them also preceded losses for Utility stocks during the next 1-2 months, though the 2019 signal was mild, didn't last long, and ultimately preceded excellent gains.
The overall theme remains the same if we relax the overbought threshold to generate a larger sample size. Out of the 16 signals, only 2007 and 2016 witnessed gains in these stocks during the usual soft spot from 1-6 months following the signal.
Other defensive stocks have done well, too
Utilities are not alone, as Health Care and Consumer Staples have done exceptionally well, too. Overall breadth within the three most defensive sectors has been excellent.
Using a similar composite of breadth that we used for Utilities and applied to Staples and Health Care, all three are showing extreme and broa-based participation across indicators.
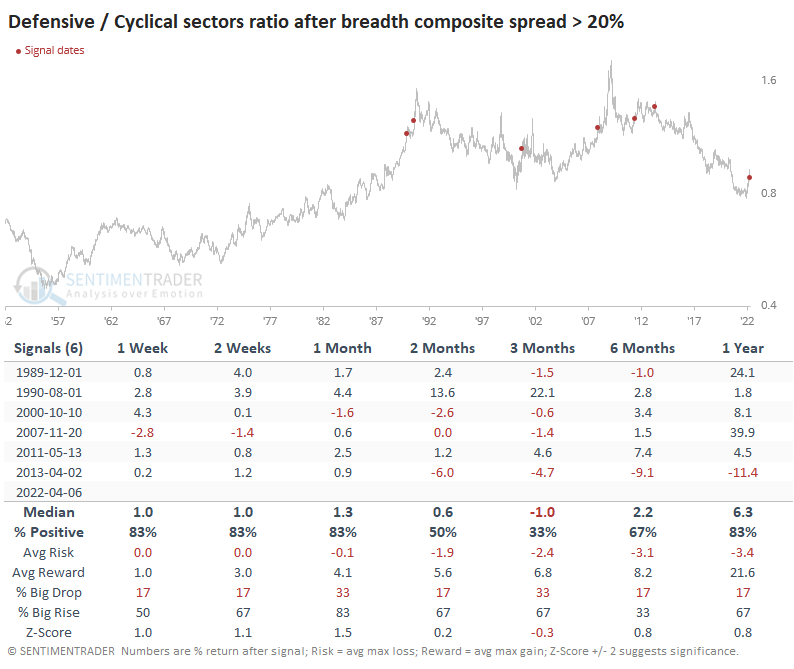
At the opposite end of the defensive sectors are cyclicals like Financials, Technology, and Consumer Discretionary. Internal participation in those three sectors has been poor. While it's off the worst levels from March, the last few days have seen the maximum breadth composite among those three sectors fall again.
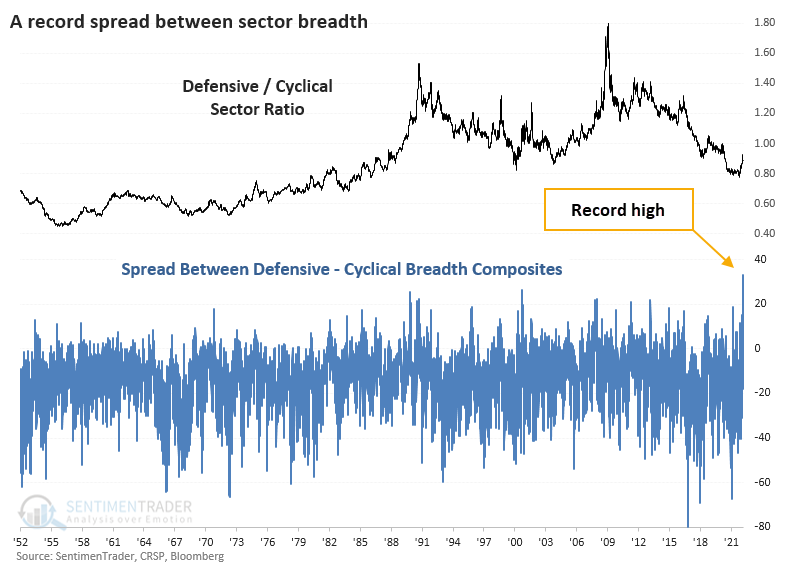
The minimum composite among the three defensive sectors is nearing 60%, but the maximum composite among the three cyclical sectors is plunging toward 20%. That has led to a record divergence between them.
After other high readings, defensive stocks continued to outperform in the short-term but gave back most or all of those gains in the months ahead. A year later, though, defensive stocks had outperformed after all but one signal.
Within Health Care, some potential opportunity
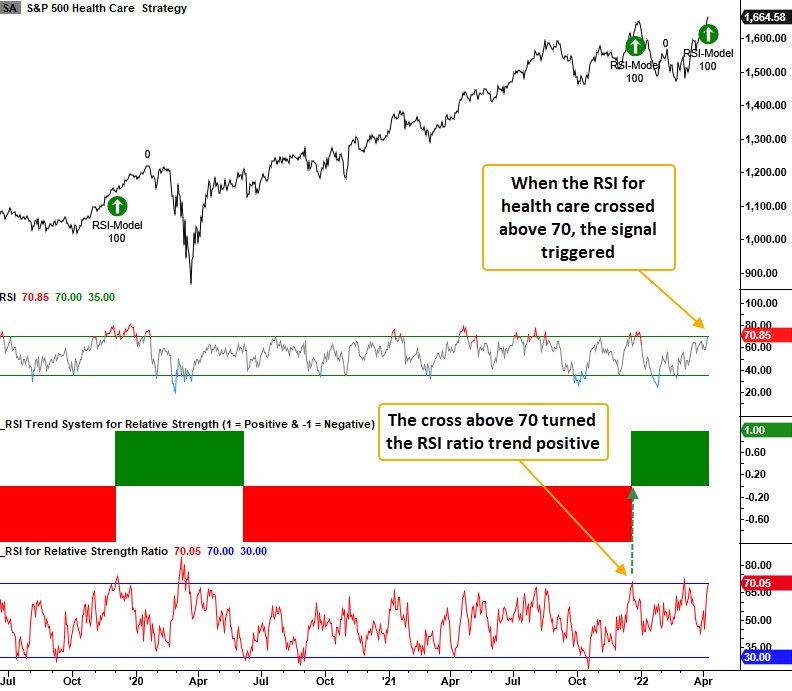
The relative strength index (RSI) measures price momentum for stocks, indexes, or other assets. Dean likes to use the RSI indicator on the ratio between two securities to identify relative strength trends. When the RSI ratio exceeds 70, the relative momentum trend is positive.
His RSI trading model is simple. When the RSI ratio trend is positive, the model generates a new buy signal when the RSI indicator for the underlying stock or ETF crosses above 70. At the same time, the 5-day rate of change must be positive.
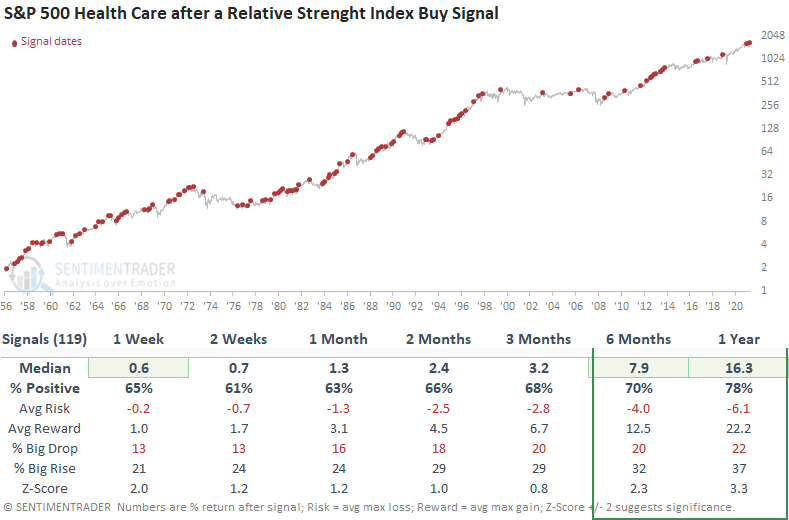
This model generated a signal 119 other times over the past 65 years. After the others, health care future returns, win rates, and risk/reward profiles were solid across all time frames, especially the 6 & 12-month windows.
Drilling down to the sub-industry level within health care, the following groups look the best.
- Biotech
- Health Care Distributors
- Managed Health Care
- Pharmaceutical
Those defensive sectors have surged thanks to increasing economic worries
Stock market performance is essentially a function of economic growth. When the economy is growing, stocks typically advance but when the stock market gets a whiff of recession, stocks decline. Jay showed that the Heavy Truck Index is a surprisingly helpful indicator for both stocks and the economy.
The Heavy Truck Index is a data series that tracks the number of newly registered heavy trucks with government agencies in the United States. What is most important is the trend of the data. The chart below displays the difference between the monthly HTI reading and its 18-month EMA. We will detail shortly that this indicator is "favorable" for stocks and the overall economy when it is above 0 and "unfavorable" below 0.
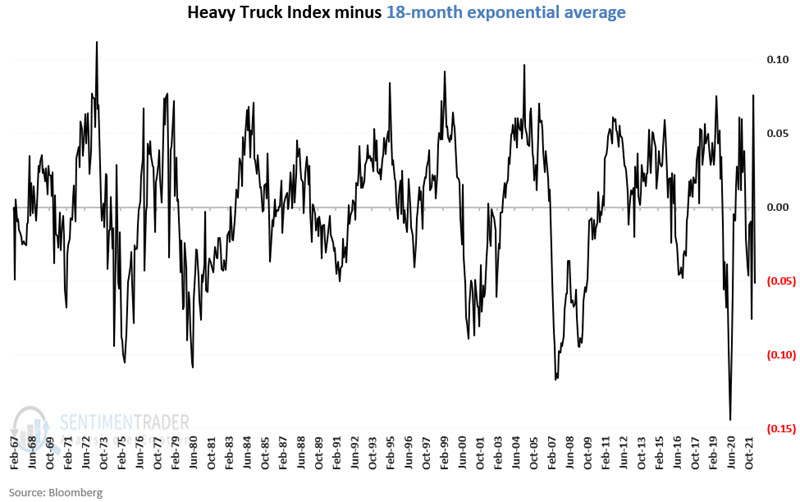
The Heavy Truck Index has dropped below its 18-month EMA following the latest update of data on 4/5/2022.
Does this impending "unfavorable" status portend doom for the economy and stocks? Not necessarily. But it does remove a very important piece of evidence from the positive side of the ledger. The chart below displays the growth of $1 invested in the S&P 500 Index when HTI > 18-month average (black line) and HTI < 18-month average (blue line).
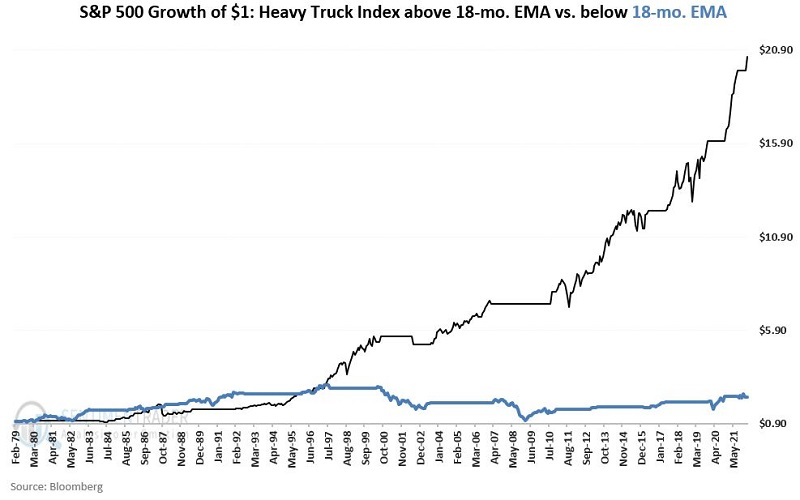
When HTI was favorable, the S&P 500 returned a cumulative +1957% versus +130% when it was unfavorable.
When the Heavy Truck Index is below its 18-month average, there is no guarantee that a recession will develop. However, the odds of a recession increase significantly. As of the end of April 2022, the status of this indicator will flip from "favorable" to "unfavorable."
Another worry - credit spreads
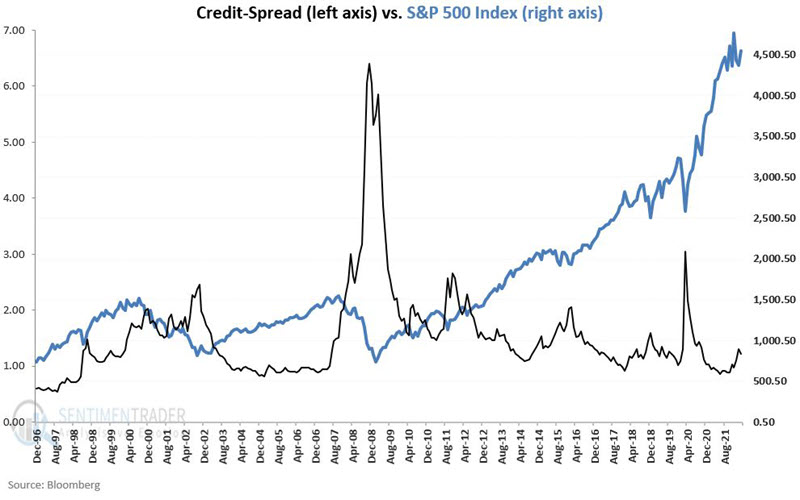
Credit spreads can offer warnings when they behave abnormally. Typically, relatively smooth sideways action indicates a favorable environment for stocks and the overall economy. However, Jay noted that over time there can be wide swings in the level of correlation between credit spreads and stocks and recognizing extremes can alert investors to favorable and unfavorable environments for stocks.
The chart below shows the credit spread axis on the left and the S&P 500 Index axis on the right.
In our analysis, the indicator we will use is the correlation between credit spreads and the S&P 500 Index over the latest ten months. There is a strong tendency for these two series to be non-correlated, however, the level of correlation can swing widely over time. We will use these swings to designate the indicator as "favorable" or "unfavorable" for stocks.
To highlight the relationship between the indicator and the S&P 500 Index, both are plotted below, with the correlation value axis on the left and the S&P 500 Index axis on the right.
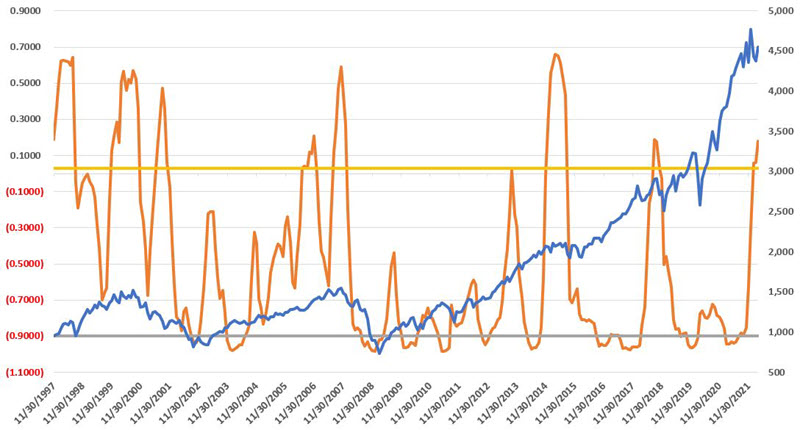
If the correlation between stocks and credit spreads exceeds 0.027, we will consider the environment to be unfavorable for stocks. If it falls below -0.90 and then rises above that threshold, the environment will be favorable.
Since this correlation is now unfavorable, the chart below displays the growth of $1 in the S&P 500 Index held only during periods.
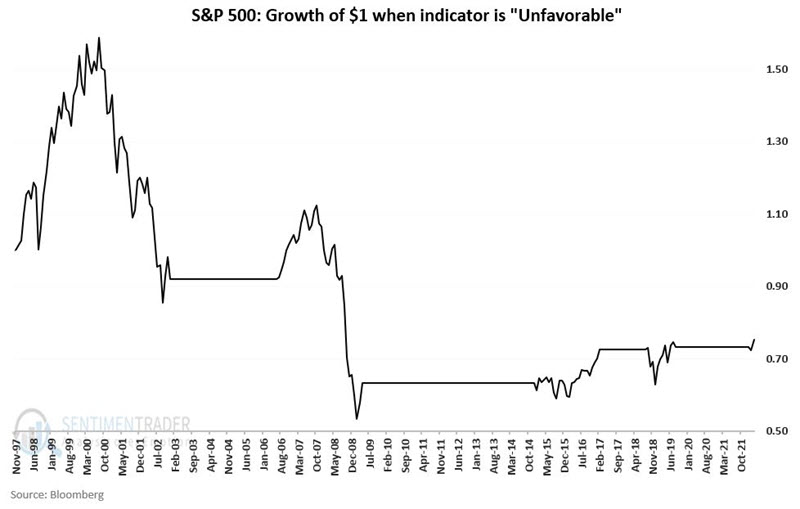
Since 1997, the S&P 500 gained +533% during favorable periods and lost -25% during unfavorable ones.
Stable credit spreads indicate "normal" economic circumstances. When credit spreads begin to act abnormally and become volatile, it offers a potential warning sign that something is amiss. The recent high correlation between credit spreads and stocks is not an automatic sell signal, but as a "weight of the evidence" tool, it can offer valuable clues regarding the current relative state of the stock market and the overall economy.
A sentiment sell signal for Germany
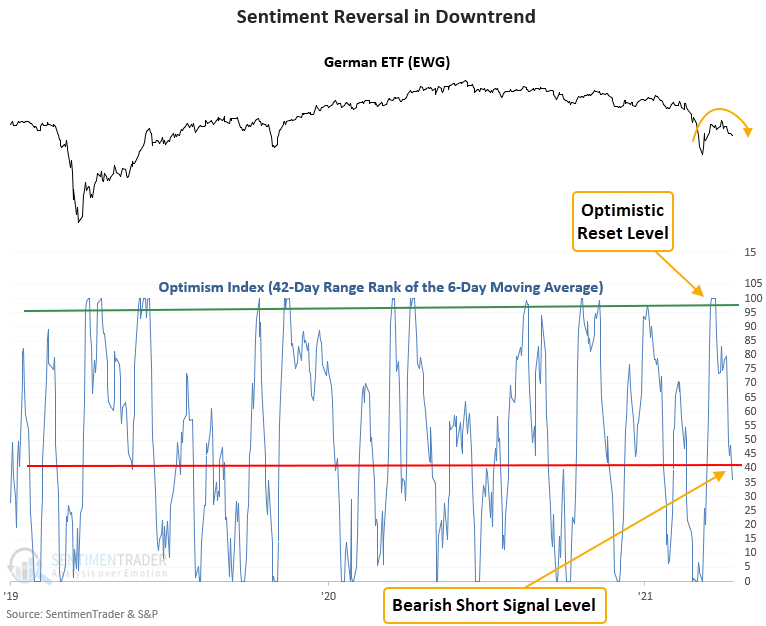
The optimism index for the Germany ETF (EWG) reversed lower relative to its recent range and the long-term trend for the ETF shows a declining 200-day moving average.
A trading model from Dean that uses the Optix Index to identify when sentiment reverses from a period of optimism issued a short signal for the Germany ETF (EWG) at the close of trading on 4/11/22.
The model applies a 42-day range rank to the 6-day moving average of the Optimism Index for the German ETF (EWG) and looks for times when sentiment reverses from high optimism. The underlying ETF also has to show poor momentum.
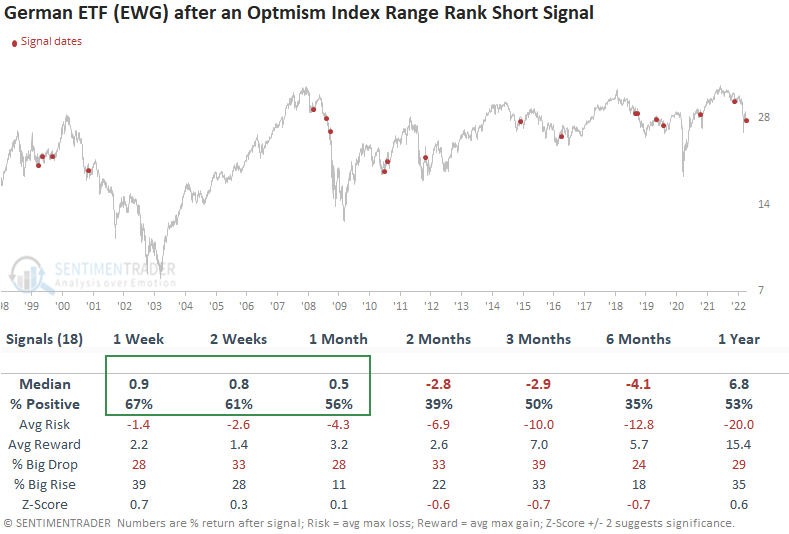
This model generated a short signal 18 times over the past 23 years. After the others, the German ETF's future returns and win rates suggest one could profit from a short in the near term. The signal shows positive returns at some point in the first month in 14 out of 18 instances. The March low resides almost 9% lower than current prices. The table shows performance for a short signal. So, positive values reflect a winning trade.
When the optimism index reverses from its recent range and the 200-day moving average declines, it signals that traders have become more pessimistic about the future direction of stocks. Using the Optix index to measure that change in sentiment, similar setups to what we're seeing now have preceded falling prices for the EWG ETF in the near term.
Technology stocks, however, have a brief sweet spot
Jay highlighted the tendency for the stock market to move cyclically and that certain months within the four-year presidential election cycle tended to witness better performance than others.
Digging further, he looked at sector performance during favorable months of the election cycle.
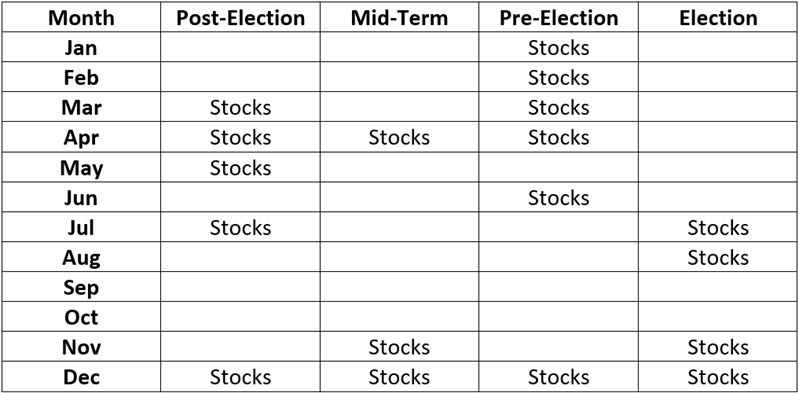
The table below displays the cumulative % +(-) achieved by each sector if held only during the months listed "Stocks" in the original table, during each 4-year election cycle since June 1926.
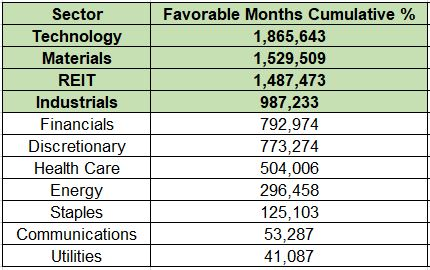
Technology, Materials, REITs, and Industrials showed the largest cumulative gains. One might be tempted to stop there. However, the most underappreciated factor in investing is consistency.
The chart below displays the growth of $1 invested in Technology during favorable months versus the growth of $1 split among all eleven sectors only during favorable months from 1926 through 1999.
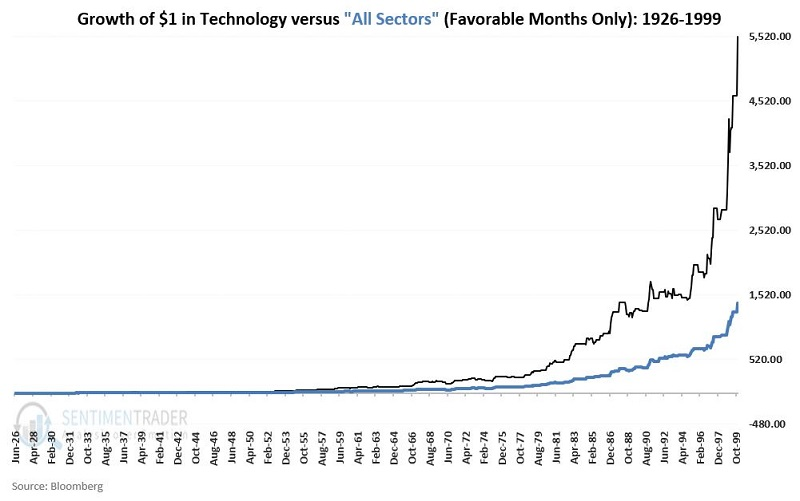
Clearly, technology enjoyed huge outperformance over many decades. In addition, from roughly 2017 into late 2021, Technology was once again a huge outperformer.
The key thing to note is this: Despite the huge run and outperformance of the Technology sector in recent years, the massive 2000-2002 decline for this sector has caused it to underperform significantly (again, we are talking ONLY about favorable months) versus all sectors. Would an investor keep buying into Technology after nine years of a big net decline from 2000 to 2009? This is probably the key question to ponder.
Bond selling leads to extreme pessimism
When a market doesn't do what it's supposed to do, it usually pays to pay attention. Some were surprised by this week's move in bonds, given the red-hot CPI release showing little slowdown in inflation. The yield on 10-year Treasuries backed up by more than five basis points, relaxing from what had been a 52-week high.
Since the inception of 10-year Treasury futures in 1982, those prices typically rebounded in the weeks following similar reactions to a CPI report, but it wasn't a strong edge.
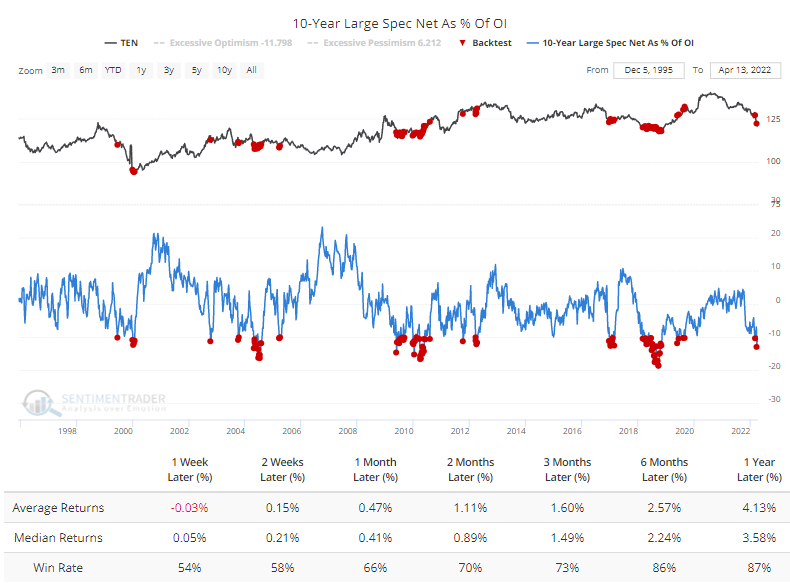
Sentiment toward bonds has been atrocious. Over the past 20 days, the Bond Optimism Index has averaged less than 22%, one of the lowest readings in 30 years. One of the inputs to the Optimism Index is positioning in the futures market. Speculators in 10-year Treasury futures hold more than 10% of open interest net short, after which the Backtest Engine shows excellent returns in 10-year notes.
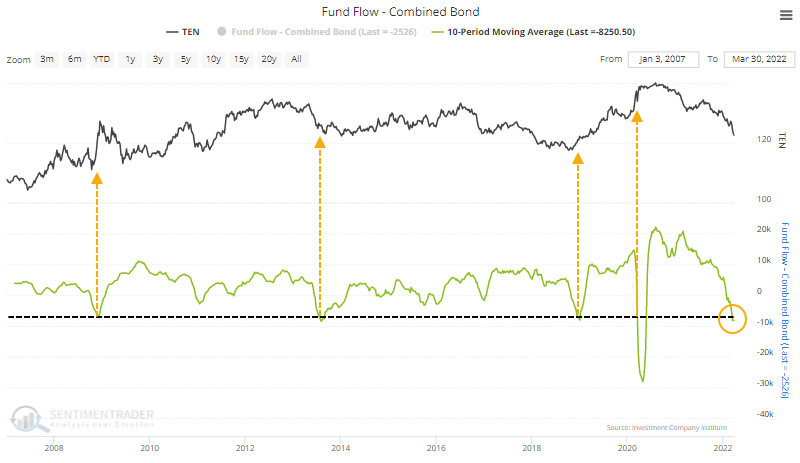
Flows in bond ETFs and mutual funds have been pathetic, with an average outflow of more than $8 billion per week over the past ten weeks. Fund flows during the height of the pandemic fears were weird, but other than that, massive outflows led to significant gains in bonds.
It's not just Treasuries that have suffered. In recent weeks, we've noted several times the pressure being faced in corporate bonds, as well, especially high-yield. According to Bloomberg calculations, the average bond in the U.S. is now trading at a near-record discount to par value. It just barely exceeded this in May 2000.
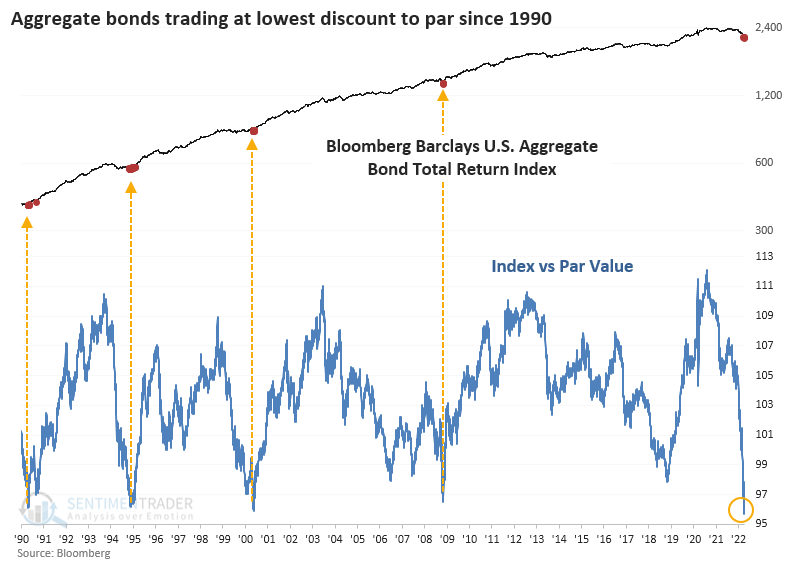
Every time it dropped below $97, the aggregate index total return averaged at least 13% during the following year.
Over the past several months, there has been no shortage of extremes in the bond market. The price action that the market has suffered has many hallmarks of forced selling.
More and more factors are lining up for at least a medium-term rebound in bond prices. Any historical comparison to the past 30 years suggests now is a reasonable risk/reward opportunity to add exposure to that market. The most challenging aspect of this is limited history - during the 1970s, similar setups would have likely led to more losses.
About TradingEdge Weekly...
The goal of TradingEdge Weekly is to summarize the research published to SentimenTrader over the past week. Sometimes there is a lot to digest and this summary is meant to highlight the highest conviction or most compelling ideas we discussed. This is NOT the full research that's published, rather it pulls out some of the most relevant parts. It includes links to the published research for convenience; if you don't subscribe to those products it will present the options for access.