
Election Cycle Months

Key Points
- Under cover of volatility and seeming randomness, the stock market has tended to move in a cyclical fashion
- One of the primary cycles that seem to influence performance is the four-year (48-month) presidential election cycle
- Certain months within the 48-month cycle have seen more consistently profitable results
- This piece details my own way of analyzing the election cycle, using a pattern that I refer to as JK Election Cycle Months
Introducing JK Election Cycle Months
OK, it's "True Confession" time. Generally, I'm not too fond of it when someone tries to attach their name to a given indicator. And yet here I have attached at least my initials to what I am about to show you. A contradiction? Probably. But the fact of the matter is that my own analysis divined the pattern you will see in a moment, and I have not seen this particular iteration anywhere else. So, for better or worse, it's JK Election Cycle Months.
For openers, I view the Election Cycle as 12 months per year for four separate years - Post-Election, Mid-Term, Pre-Election, and Election. The theory is that the stock market performs better (defined as higher returns and more consistently profitable) during certain months within this 48-month cycle than during other months. The full cycle appears in the table below.
The 18 months containing the word "Stocks" implies that we want to be in the stock market during these months. I generally refer to these as "favorable" months. I am essentially agnostic on the stock market during months that do not contain the word "Stocks." They should not be considered outright bearish (although long-term results during these months have been quite unfavorable, as we will detail momentarily). However, I typically refer to these as "unfavorable" months to differentiate them.
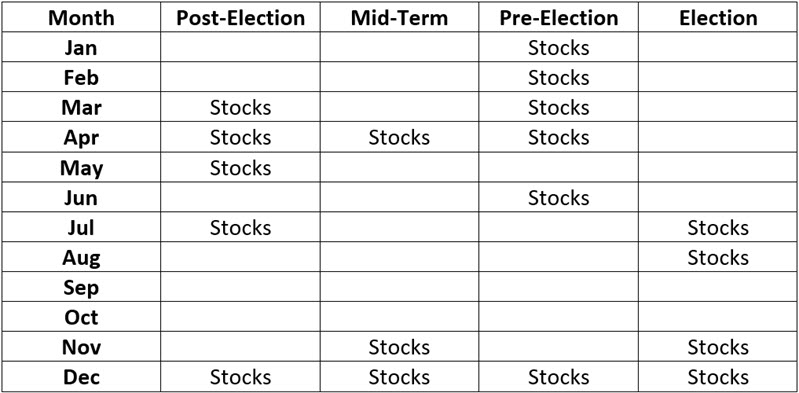
Note that April of 2022 is listed as a "favorable" month. Does this mean that stocks are guaranteed to trade higher this month? Not at all. For a better idea of what it does mean, read on.
Data used
For testing purposes, I use the monthly closing price for the Dow Jones Industrial Average from 12/31/1899 through 3/31/2022. I then accumulate returns for those months marked "Stocks" separately from returns for all other months (i.e., those not marked "Stocks").
Performance Results: Favorable Months
The chart below displays the cumulative growth of $1 invested in the Dow since 1900 only during the months labeled "Stocks" in the table above.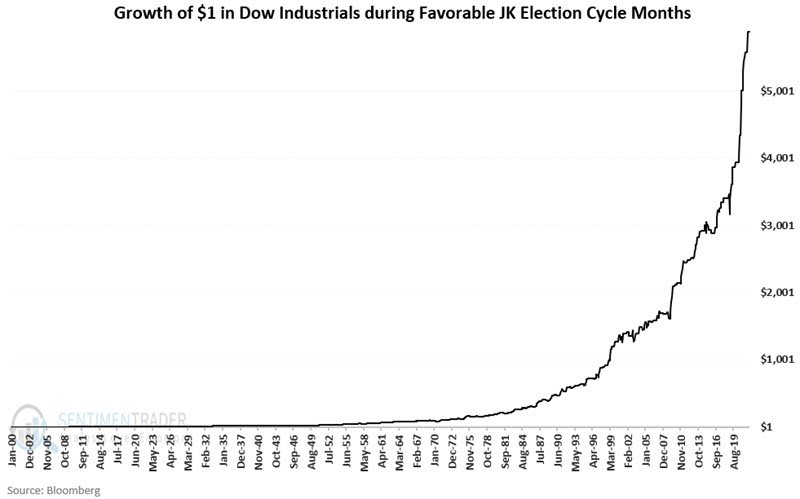
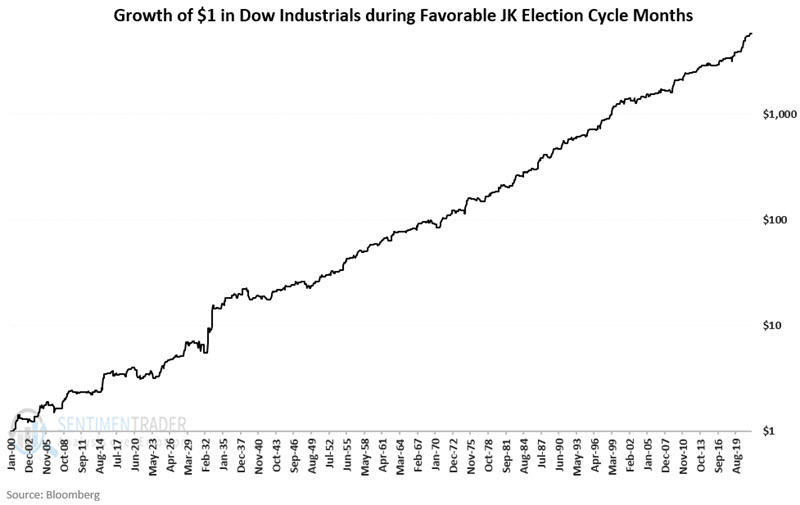
The chart below displays the same results above but on a logarithmic scale to highlight the consistency of returns during favorable months.
Performance Results: Unfavorable Months
The chart below displays the cumulative growth of $1 invested in the Dow since 1900 only during the months NOT labeled "Stocks" in the table above.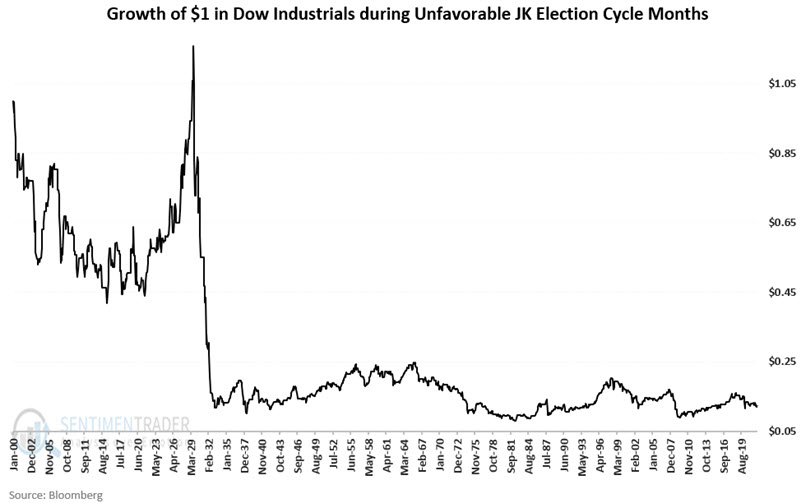
The chart below displays the same results above but on a logarithmic scale to highlight the inconsistent nature of returns during these months.
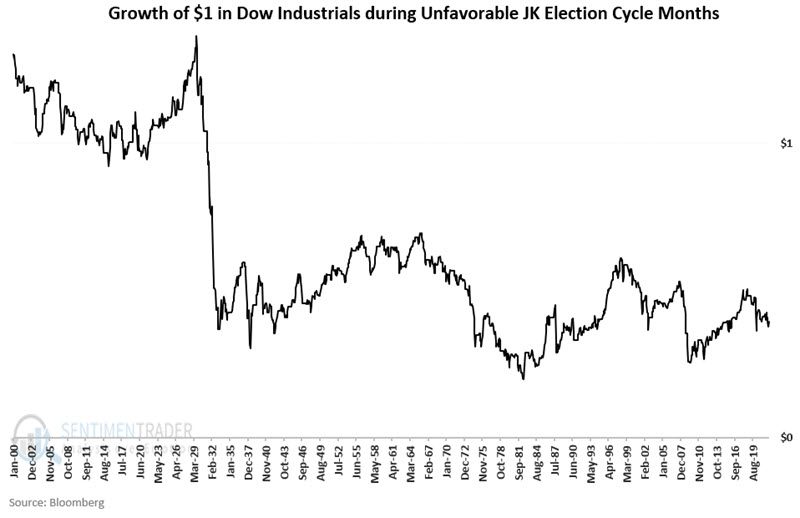
For the record, from 12/31/1899 through 3/31/2022, the Dow Jones Industrial Average:
- Gained +587,733% during "favorable" months,
- Lost -84.8% during "unfavorable" months
While the results for "unfavorable" months are exceedingly negative overall, it is important to note that there have been many times when the stock market has rallied - at times substantially - during these supposedly "unfavorable" months.
Favorable months vs. Unfavorable months
Now let's look at results on a month-by-month basis for favorable months versus unfavorable months. The table below displays a summary of monthly results.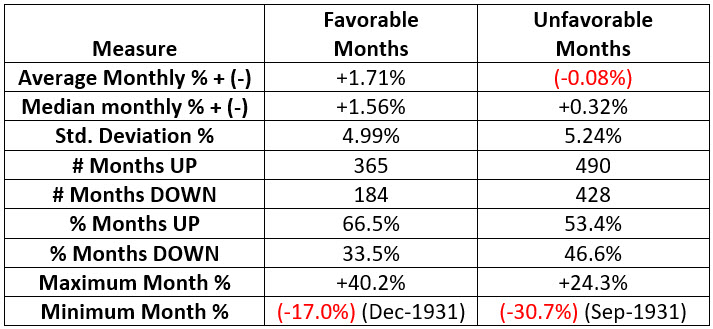
Probably the key things to note are:
- Favorable months showed a gain 66.5% of the time versus 53.4% for unfavorable months
- Favorable months showed an average monthly gain of +1.71% versus -0.08% for unfavorable months
Favorable versus Unfavorable months across each 4-year cycle
Now let's examine results across full 4-year cycles. For purposes of the test, we start on 12/31/1900, and 1901 is our first post-election year. We examine results from 1901 through 1904, then from 1905 through 1908, and so on, finishing with 2017 through 2020. All told, there have been 29 completed 4-year cycles.
The table below displays a summary of the results. The results listed under "Favorable Months" assume we hold long the Dow Jones Industrial Average ONLY during the 18 months labeled "Stocks" in the initial calendar table above across each full 4-year cycle. Likewise, the results listed under "Unfavorable Months" assume we hold long the Dow Jones Industrial Average ONLY during the 30 months NOT labeled "Stocks" in the initial calendar table above across each full 4-year cycle.
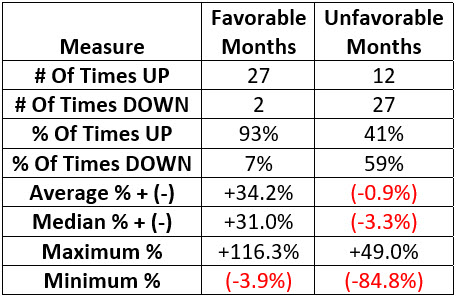
Key things to note:
- The favorable months showed a 4-year gain 93% of the time (27 out of 29 cycles), while the unfavorable months showed a 4-year gain only 41% of the time
- Unfavorable months showed an average 4-year loss of -0.9%
- The worst 4-year performance if the Dow was held only during favorable months was -3.9% (1937-1940)
- The worst 4-year performance if the Dow was held only during unfavorable months was -84.8 (1937-1940)
What the research tells us…
JK Election Cycle Months is not intended as a standalone trading model. Note that unfavorable months can and will routinely show gains during prolonged and sustained bull markets. As a result, buying and holding only during favorable months can underperform a simple buy-and-hold strategy for several years and by a significant amount.
The real purpose of JK Election Cycle Months is to help give investors an "edge" by highlighting months that may have a higher probability of showing a gain. Consistent returns are a key ingredient in keeping investors disciplined and following their investment strategy long enough to achieve their long-term investment goals.