
Thursday Color - Breakaway Gaps, Japan Jumps, Small-Caps Pop, Dollar

Here's what's piquing my interest so far today.
Breakaway
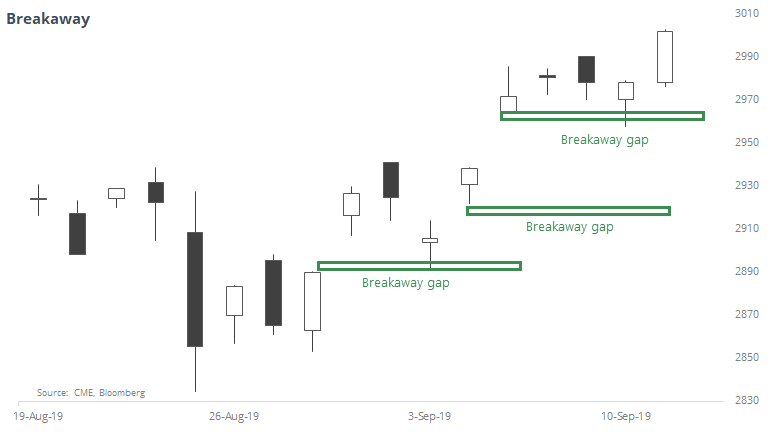
One of the signs that this recovery is a bit different from some of the other attempts is that there have been three times now when the S&P 500 futures gapped up with a large gain at the open, and sellers were not interested enough to close the gap at any point over the next 5 days.
There have been 3 times the futures gapped up at least 0.85% from the prior day's close, and at no point did the futures trade low enough to close the gap during the next week. That hasn't happened since February 2016, and remarkably it's only triggered a handful of times since the inception of the futures in 1982.

In 2000, it marked a last gasp as the bubble was bursting, and in 2011 it triggered after a long and steady rally. The others, like now, triggered after a selloff, so there is a minor case to be made that this should be a good sign, but with a tiny sample size it's hard to put a lot of weight on it.
Japanese Stocks Are Jumping
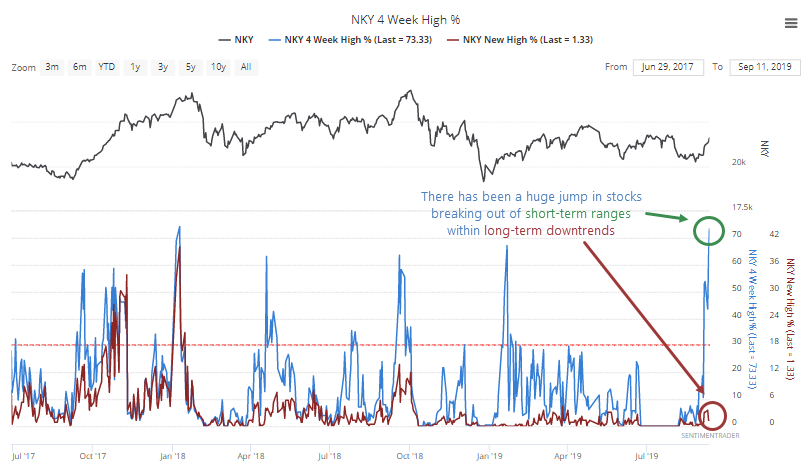
One of the most notable moves across equity markets is happening in Japan. For the first time in a looooong time, it is showing signs of life. Shorter-term breadth metrics have skyrocketed while longer-term ones continue to reflect what has been a market mired in apathy for almost 2 years.
One of the starkest ways to look at that is to compare the percentage of stocks on the Nikkei 225 that have hit a fresh 1-month high to those that have reached a 1-year high. More than 70% hit a short-term high yesterday, while fewer than 1.5% are at a 52-week high.
The hope for bulls is that this means that buyers are suddenly interested, and remain so going forward. Investors around the world behave differently to shifts like this - most of them take this as a positive sign and try to jump in, but in markets like China, it often doesn't work as well.
In Japan, it has been a pretty reliable sign that the sudden burst of buying interest brings along renewed interest from other investors, at least for a while.
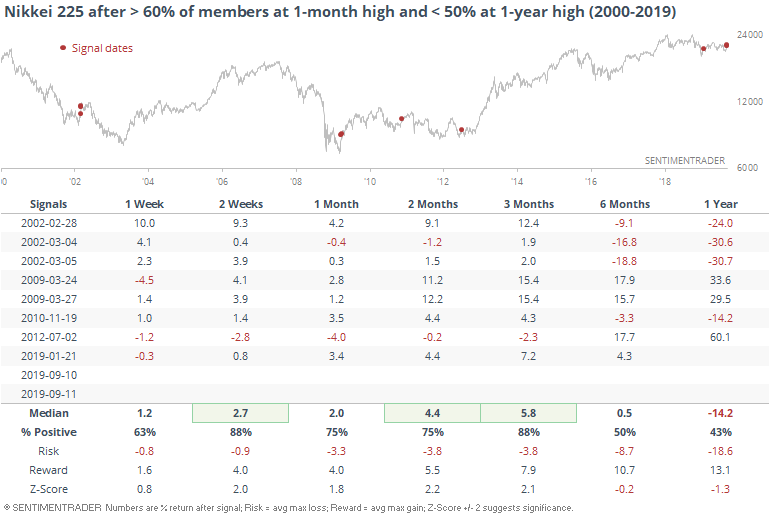
The most compelling time frame was over the next three months. Most of the risk occurred in the short-term, with the short-term jump triggering overbought conditions and some settling back in the weeks ahead. But that was typically only temporary, and the index showed strong and consistent gains over the next few months.
Those gains proved to be a false start in 2002 and 2010, but even those showed gains over the next few months.
The Relative Strength Index (RSI) for the Nikkei has hit an overbought reading above 70 for the first time in a year, something that has not boded well for late buyers lately.
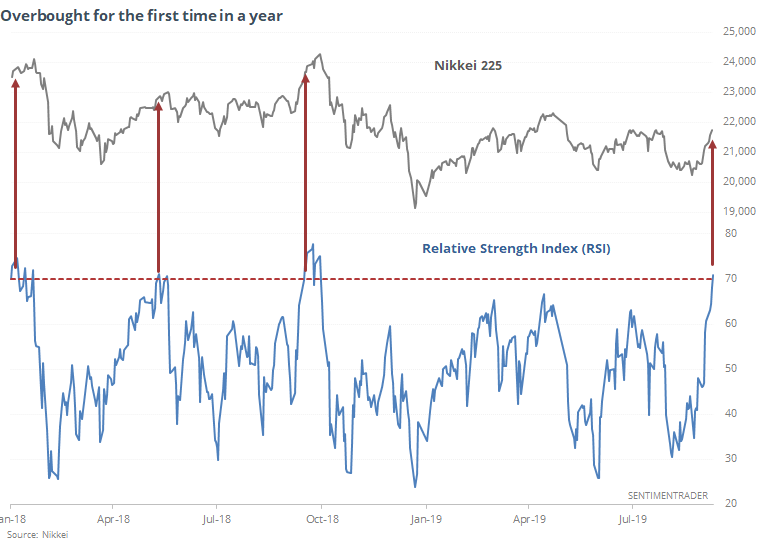
But context matters, and the index is emerging from a protracted downtrend that had no upside momentum. When the RSI exceeded 70 for the first time in at least 6 months, after the Nikkei had sunk to at least a 6-month low over the past 30 sessions, then it fared better.
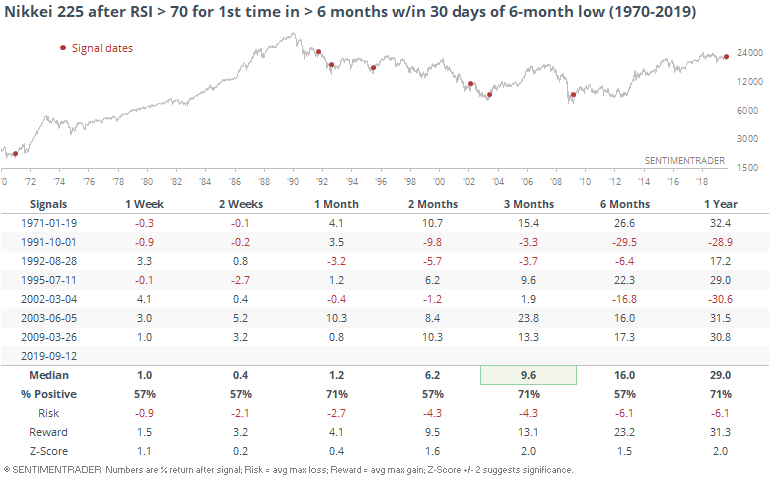
There is always the risk that this is another false start like we saw in 2002. But generally when the market enjoys this kind of surge within a protracted downtrend, even the failures have led to some medium-term gains.
Small Is Beautiful
We saw in yesterday's report that the Russell 2000 has rallied strongly for 3 straight days, usually a good sign going forward. It would be better if other indexes weren't trailing quite so much. As Troy notes, when the Russell strongly outperforms the S&P 500 on a weekly basis, it has tended to end badly for both indexes (shorter-term, anyway).
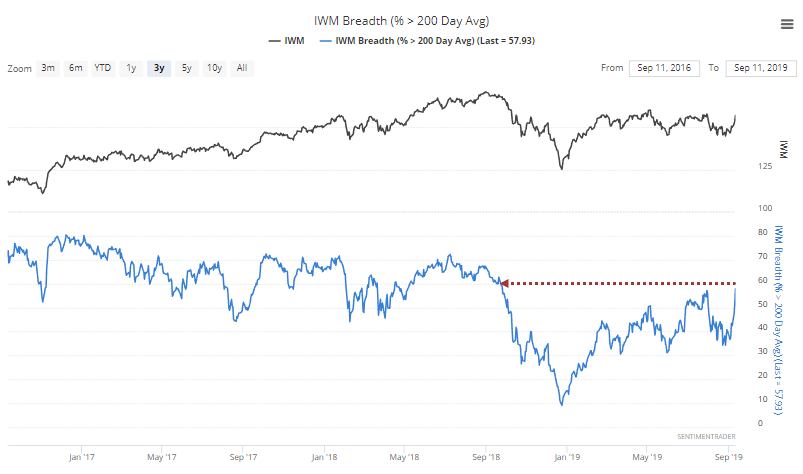
Its gains have been broad-based, too, and now nearly 60% of the index's members are trading above their 200-day averages, the most in a year.
This has been a mixed blessing over the past ~25 years.
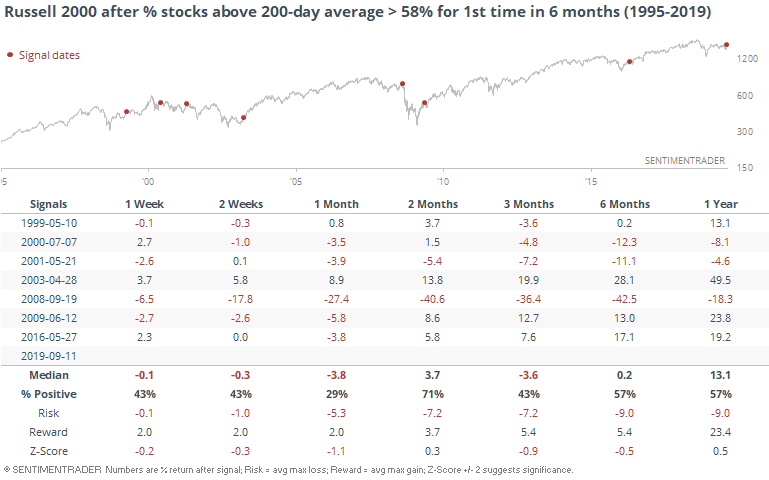
It tended to signal either the end of a long decline, or the end of a rally within an ongoing bear market. There wasn't really any middle ground.
A rough guideline is that if the Russell lost more than -1% at any point over the next couple of weeks, then it was more likely to lead to a failure. All 3 of the signals that led to large losses over the next 6-12 months saw a short-term pullback of more than -1%. Only 1 of the 4 that saw 6-12 month gains saw the Russell drop more than -1% at some point over the next 2 weeks (the one in 2009).
It's pretty much the same story with the percentage of small-cap stocks rising above their 50-day averages. It had been more than 6 months since more than 70% were above their averages.
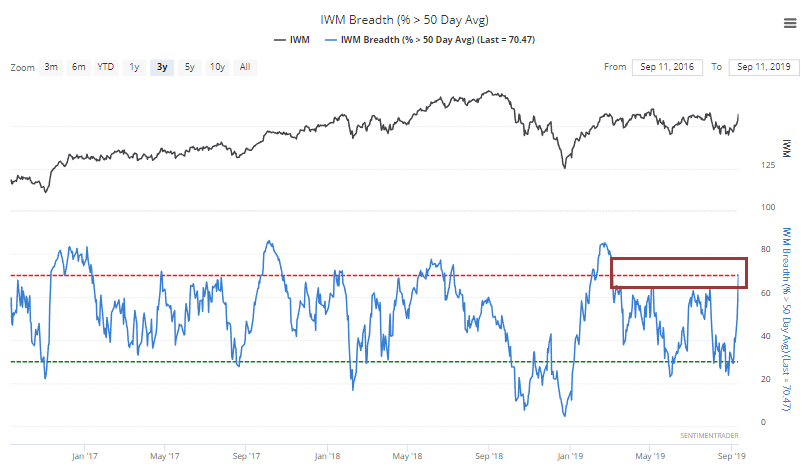
When this first hit 70% after at least 6 months, the Russell consistently struggled.
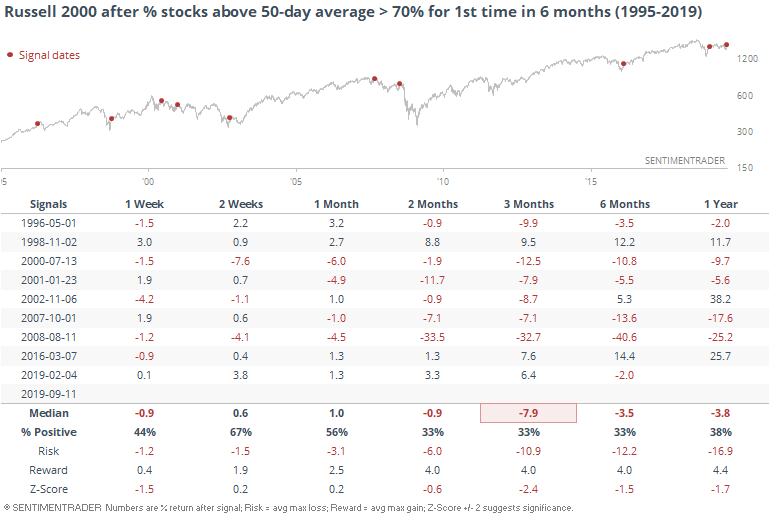
There wasn't much of a break for bulls here, but again if buyers persisted over the next couple of weeks, the index had a better shot embarking on a new bull market rather than rolling over into a continuation of the downtrend.
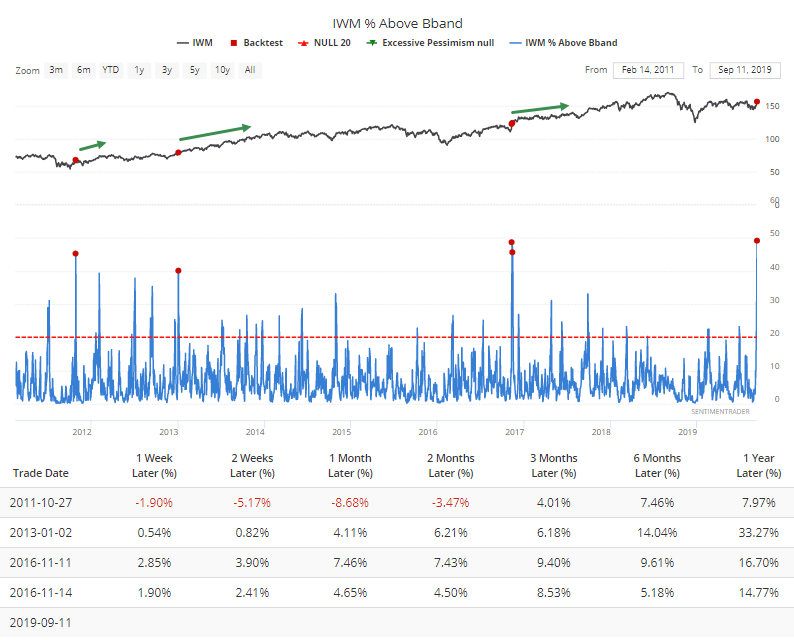
One hint that this time is different than the other negative ones? The big surge in stocks trading above their upper Bollinger Bands, showing intense, broad-based, and sudden buying interest. Going back to 1995, this has been the biggest-ever push. Part of that has to do with the tight range many of the stocks had coiled into, and part of it is due to intense buying interest.
The only other times more than 40% of small-cap stocks popped out of their Bands, the Russell rallied hard in the months ahead.
The Buck Stops...Here?
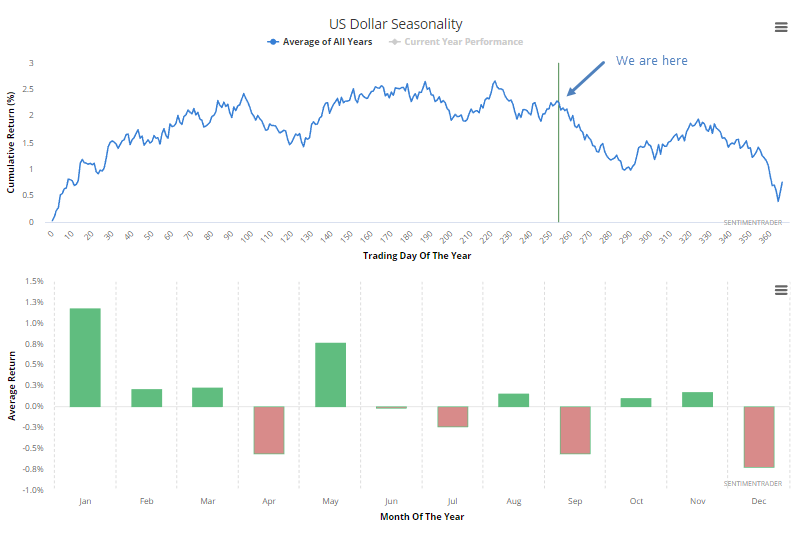
Seasonality is always an iffy thing, especially outside of commodity contracts that are heavily influenced by weather, planting seasons, etc. When it comes to stocks and currencies, the argument for why there would be a consistent seasonal influence breaks down.
So take this with a large grain of salt, but for the U.S. dollar, it just hit the point where it has tended to suffer some of the most consistent declines.
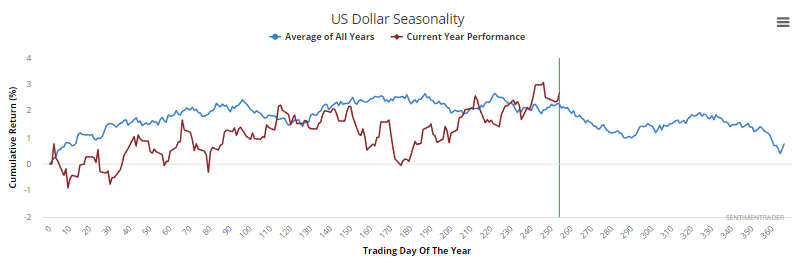
Its behavior so far this year has been mixed at best relative to the usual path.
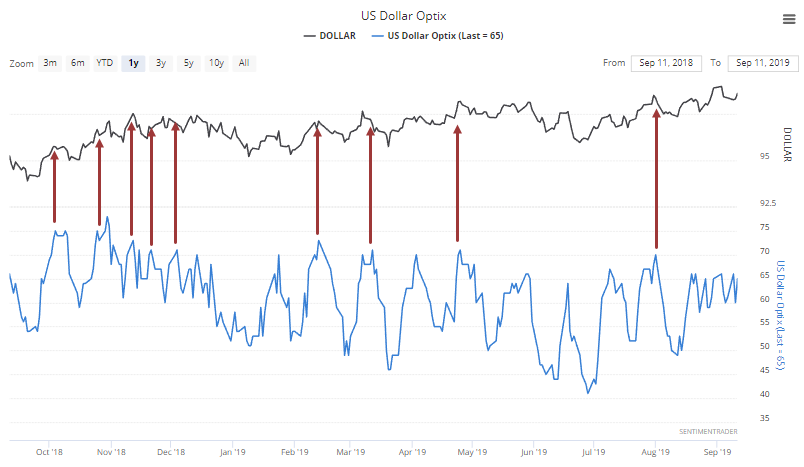
There isn't a lot among the indicators we follow to suggest that optimism on the buck has hit extreme levels. The Optimism Index hasn't hit 70 for weeks, which would be a sign that at least temporarily, the dollar would be at risk for a decline.
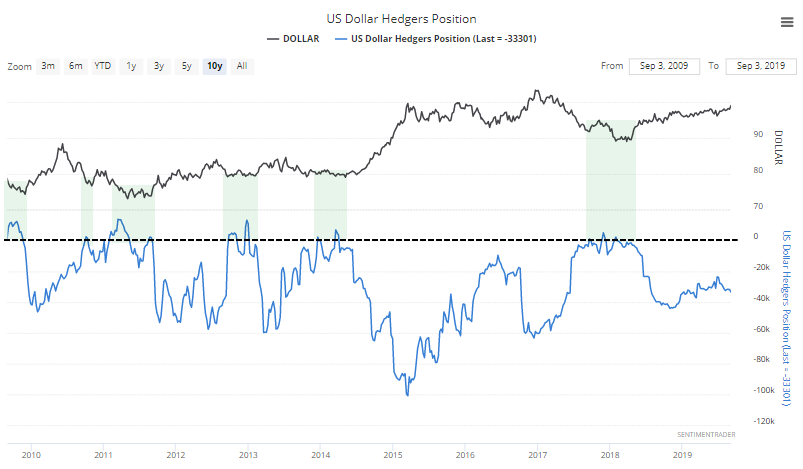
"Smart money" hedger activity has been strangely muted this year. They've established no particular extreme in their positioning since becoming net long as the dollar was bottoming in 2018.
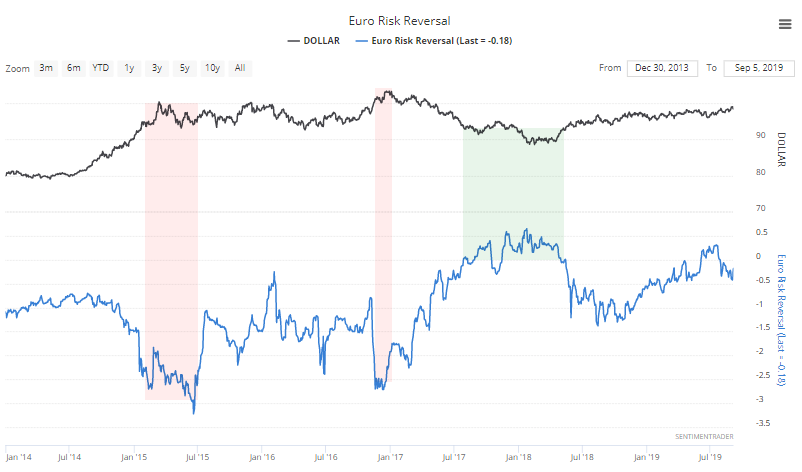
In the options market, traders are still a tad pessimistic on the dollar. The Risk Reversal against the euro isn't showing any particular bets against the euro (or for the dollar).
So, other than the questionable argument about seasonality, it's hard to make a strong case for a declining dollar according to the measures we watch most carefully.