
What I'm looking at - OECD, small caps, various breadth indicators
With the stock market near an all-time high, here's what I'm looking at:
OECD Composite Leading Indicator
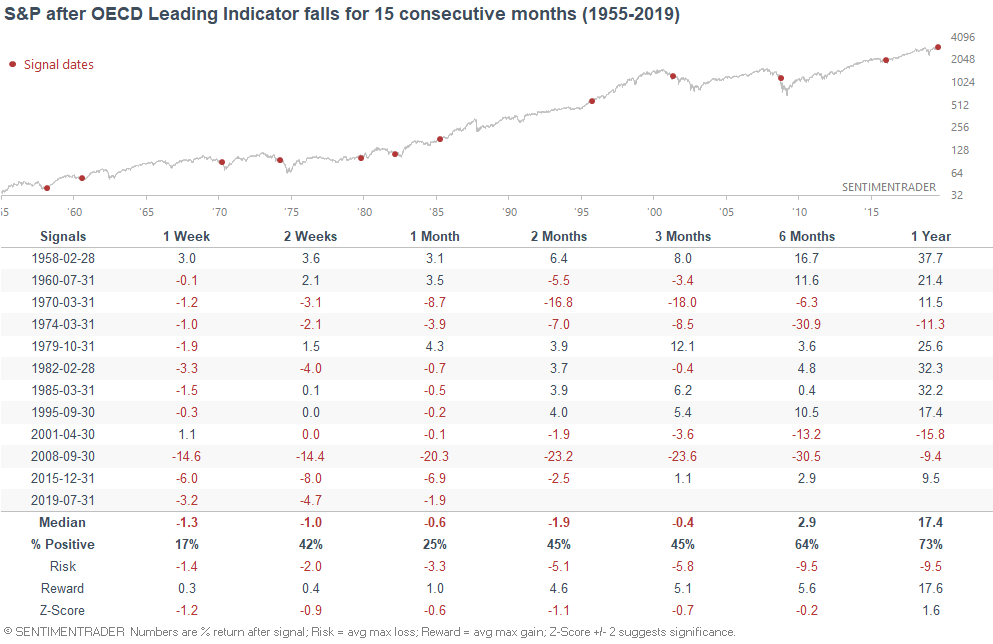
As popular bear David Rosenberg pointed out, the OECD's Leading Indicator (USA) has fallen for the 15th consecutive month.
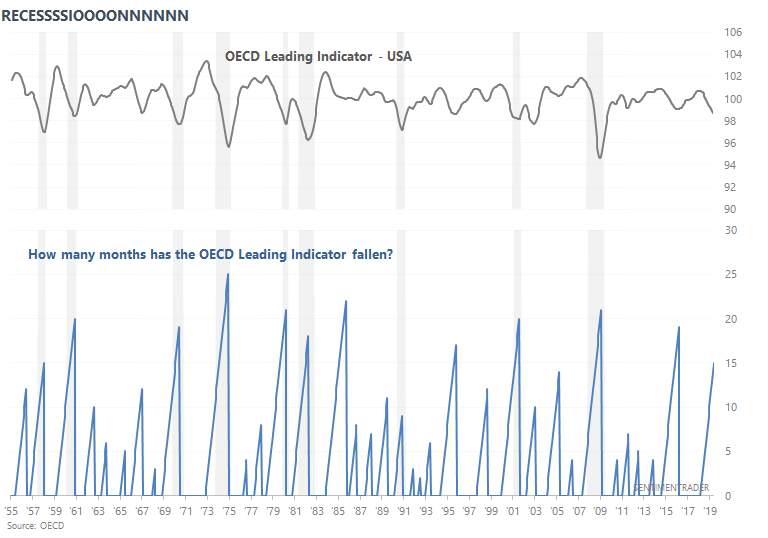
This often occurred in the middle of a recession, which is why the S&P's returns over the next few months were usually more bearish than random. However, it tended to occur towards the final 1/3 or 1/4 of a recession, which is why 1 year forward returns weren't particularly bearish either.
Personally, I'm not a big fan of this fundamental indicator. This indicator is created by combining several obscure indicators that often aren’t “leading” at all. But more importantly, in my opinion this composite indicator doesn't have enough components. A good composite indicator should have at least 10 components that cover various aspects of the economy.
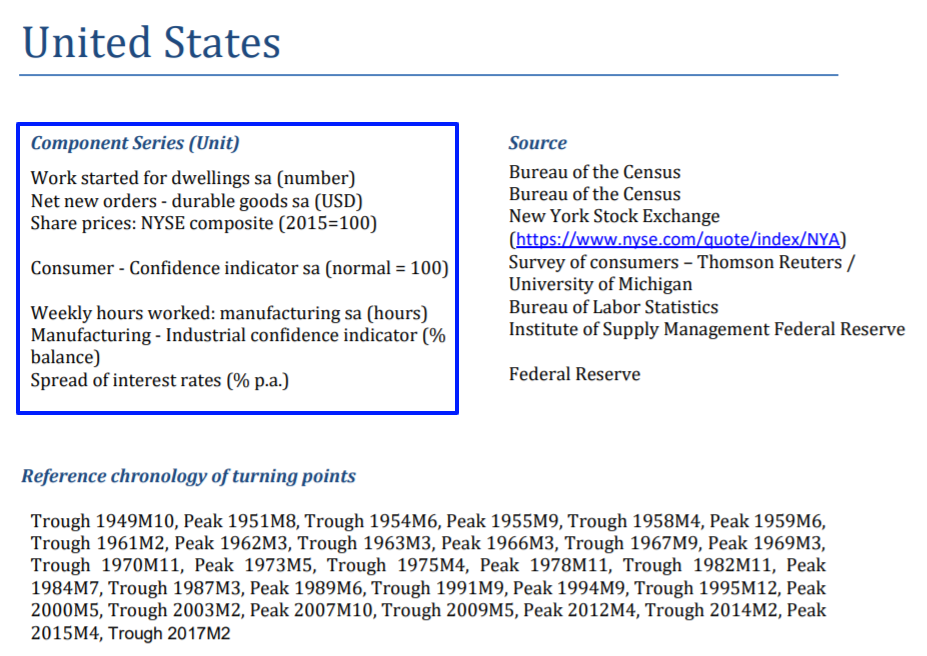
In general, it's better to use simple, popular fundamental indicators than to use obscure and less popular indicators. I've seen far too many "leading indicators" (made from obscure components) that worked great with 20/20 backtests, but flopped in real-time.
Small caps comeback?
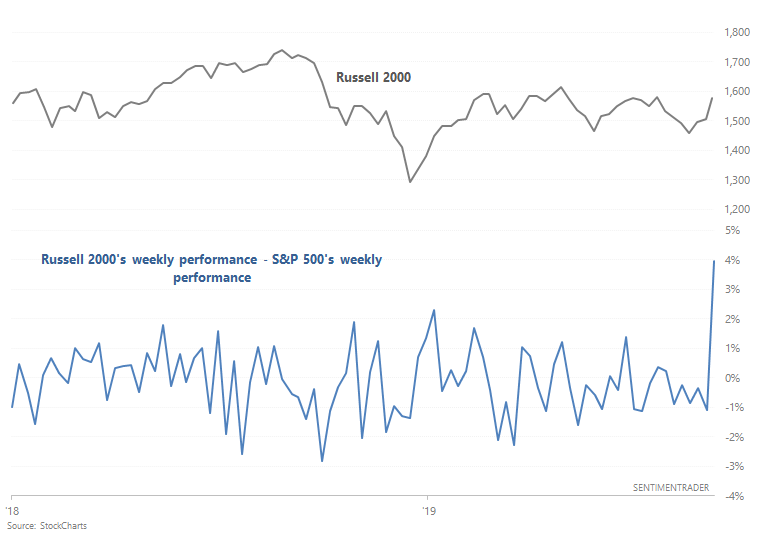
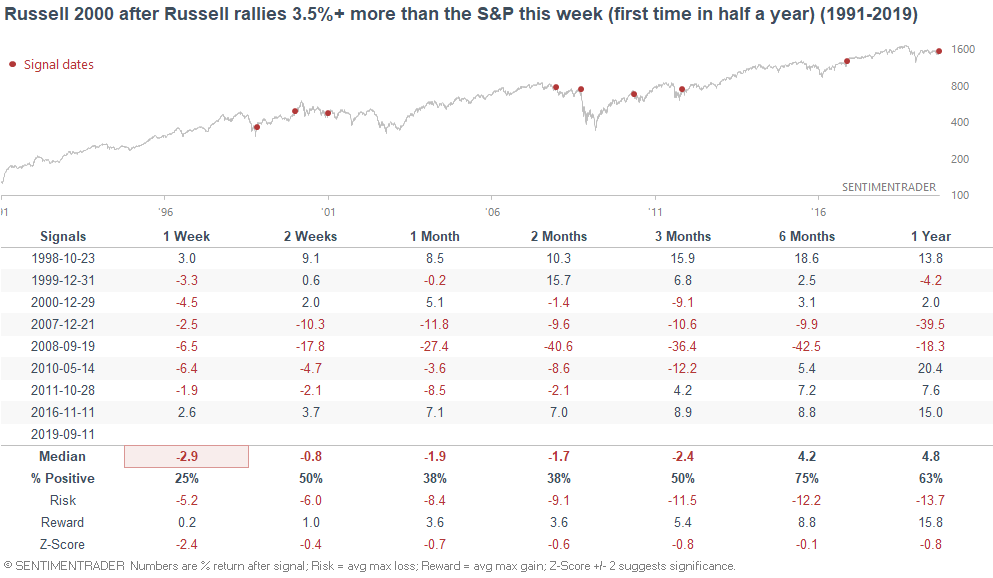
As Mark Decambre noted on Market Watch, small caps have outperformed large caps significantly this week, which is a nice change. Small caps have mostly lagged large caps since last October 2018.
The Russell 2000 has outperformed the S&P 500 so far this week by more than 3%.
When this happened in the past, the Russell 2000 often did poorly over the next week.
The S&P 500 didn't too well over the next week either.
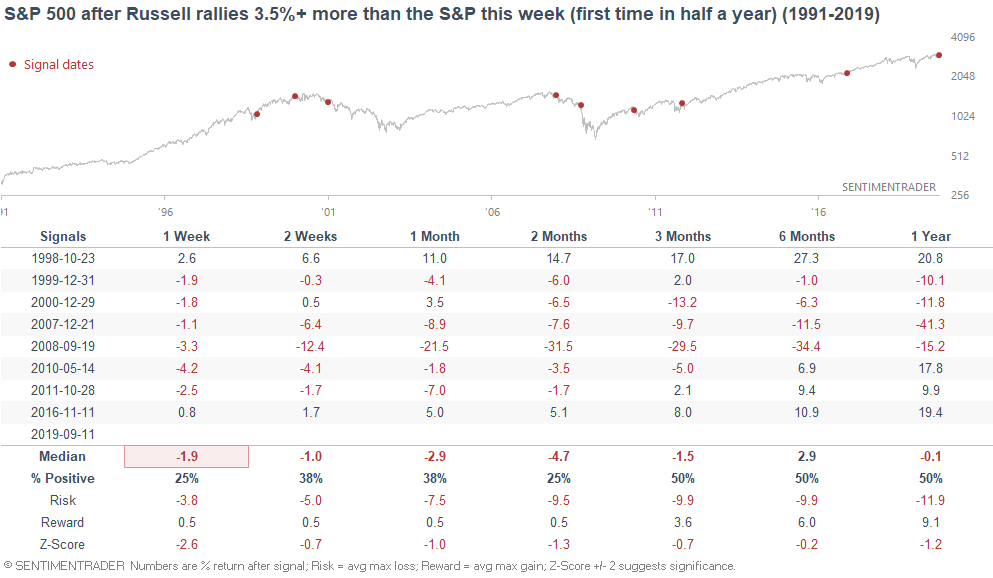
This stat hasn't been triggered yet because the week isn't over. But if small caps maintain their lead over large caps by the end of this week, I'll add this to the weekend post.
S&P 600
Speaking of small caps, the S&P 600 has gone up more than 1% for 3 days in a row.
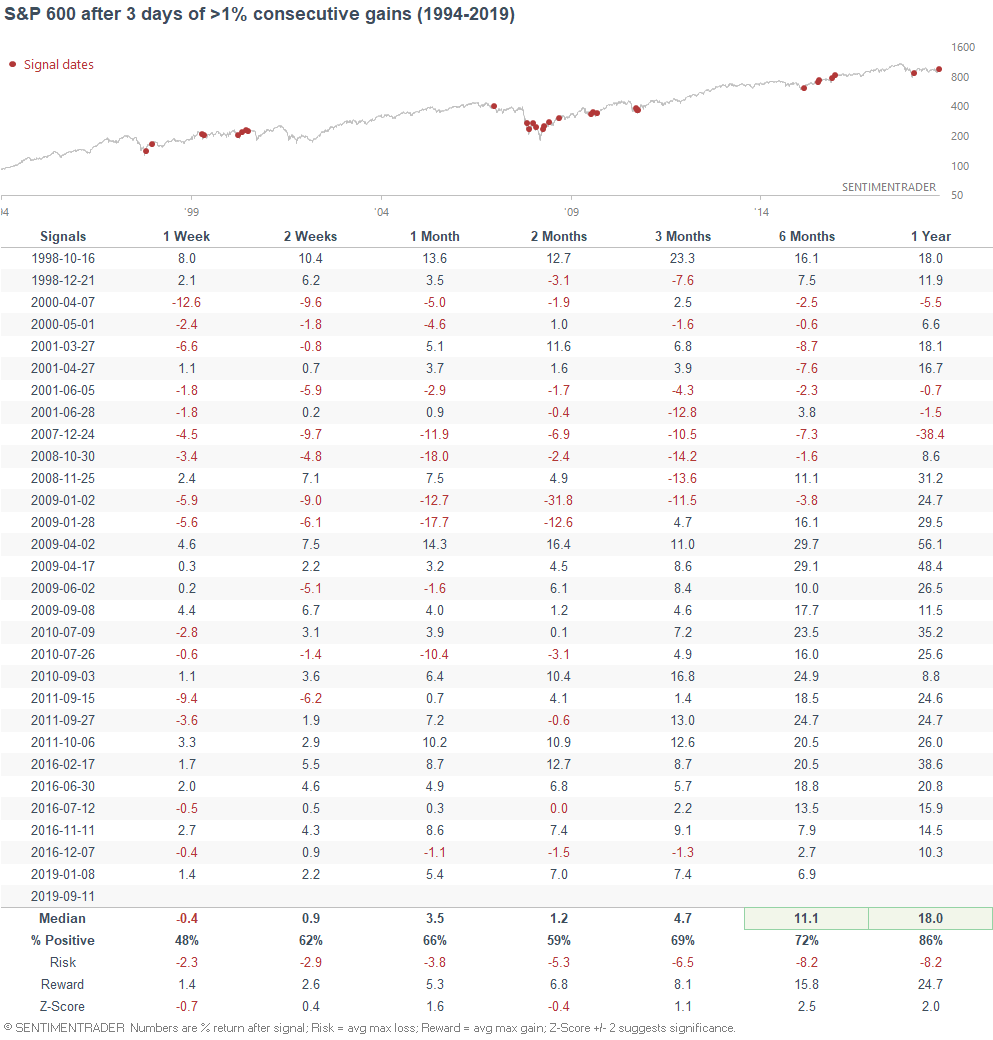
Like the previous stat, such strength was not consistently bullish for small caps over the next week. However, it was mostly bullish for the S&P 600 6-12 months later. Overall I wouldn't consider this to be a long term bullish sign for stocks. Using 3 days' price action to predict 6-12 months into the future isn't a great idea.
SPY breadth
Bespoke noted that while the S&P 500 is near an all-time highs, not many of its components are making new 52 week highs. As a result, our SPY New High % is *only* at 5.15%
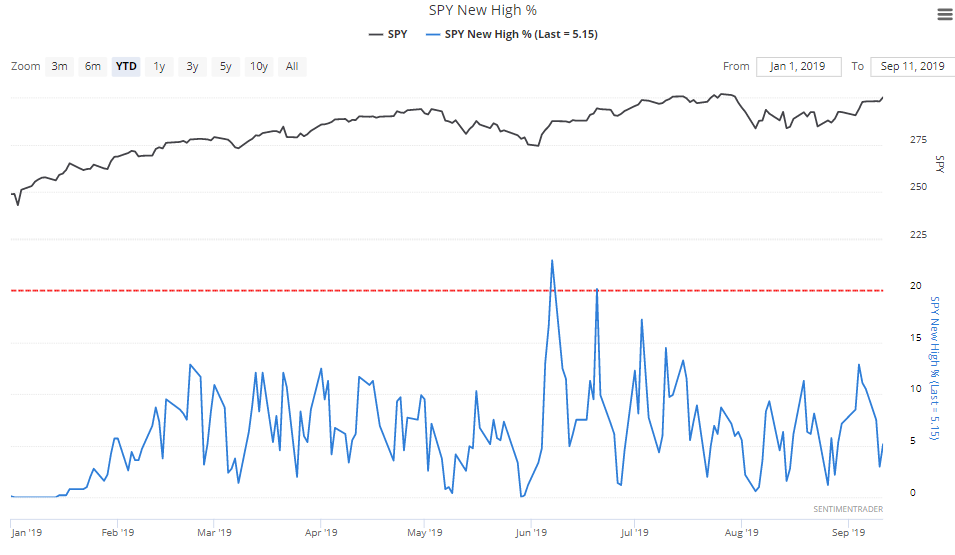
Is this something to worry about? The following chart looks at what happened next to the S&P when the S&P was within 1% of an all-time high while SPY New High % was below 5.5%
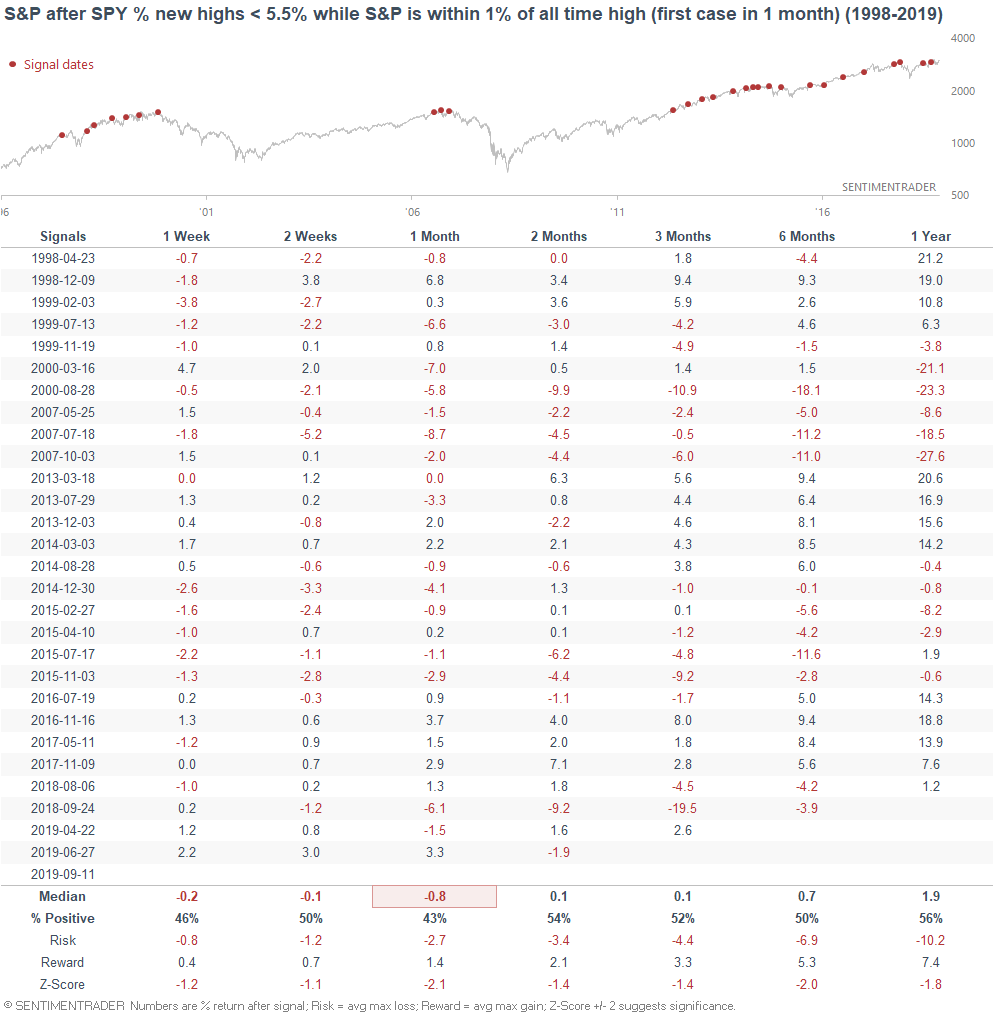
Slightly bearish for stocks over the next month. Moreover, some of these cases saw large drawdowns over the next few months because they coincided with big 15%+ stock market declines.
New lows
As you can see, the above stats demonstrate a bearish lean for stocks over the next month. However, the stock market's short term is usually very hard to predict, even if you have a high degree of confidence in your prediction. Too many exogenous and unpredictable events can impact the market in the short term. Or as a popular meme on Twitter goes, "your technical analysis is no match for my tweets" (Trump).
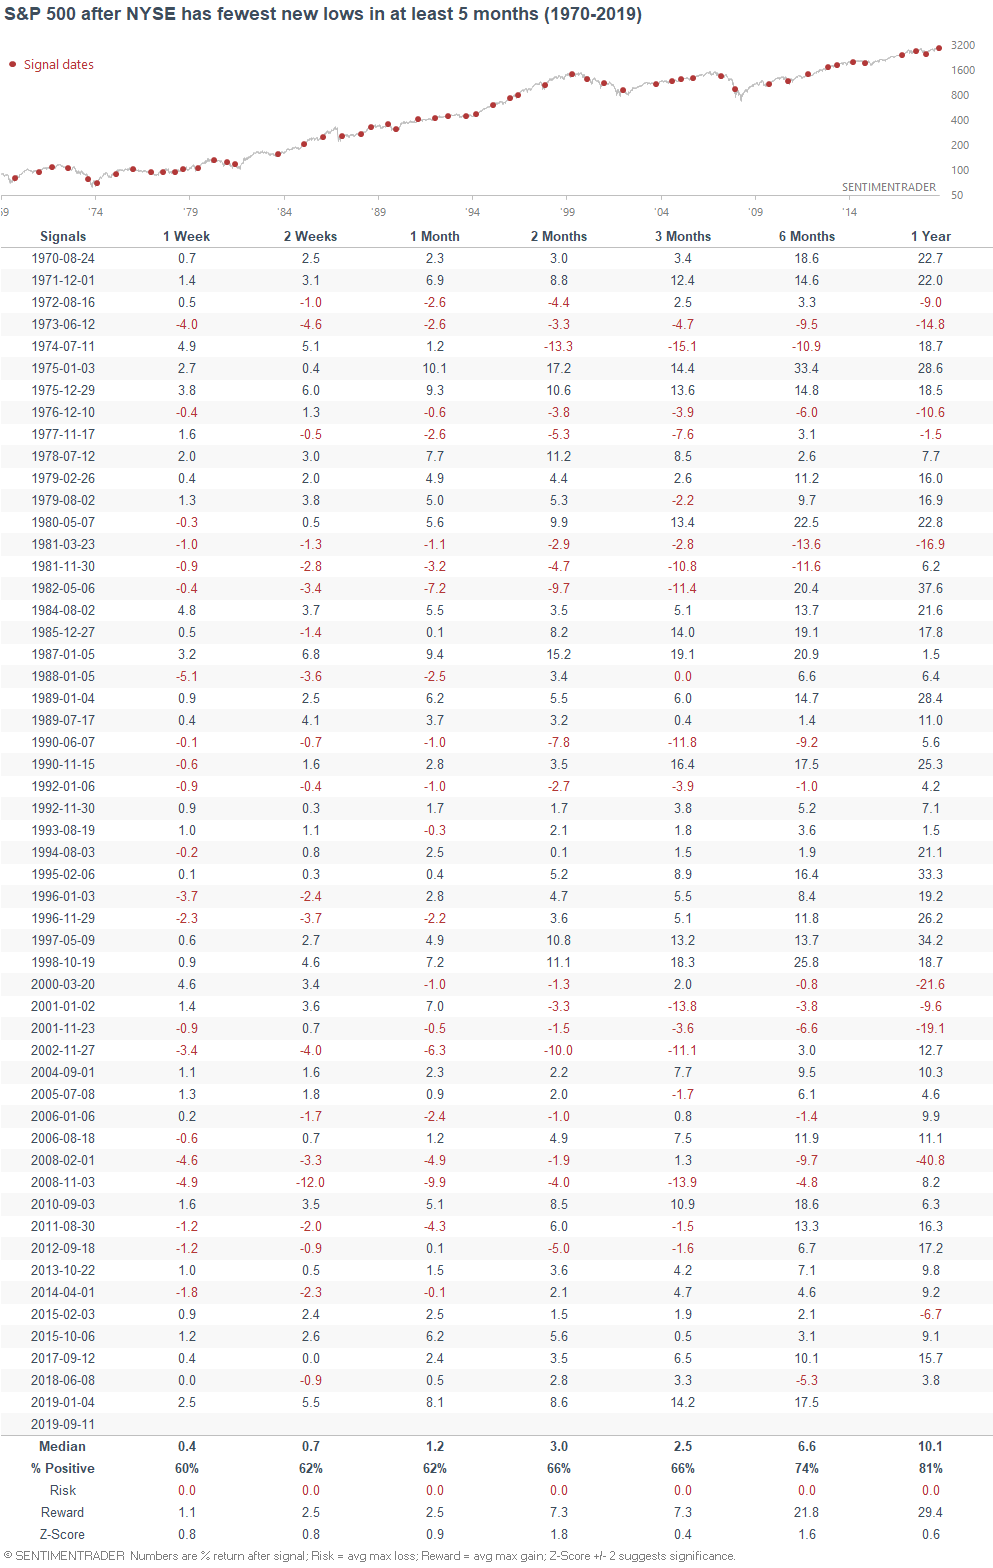
As Helene Meisler noted, the NYSE has the fewest issues making new lows since April.
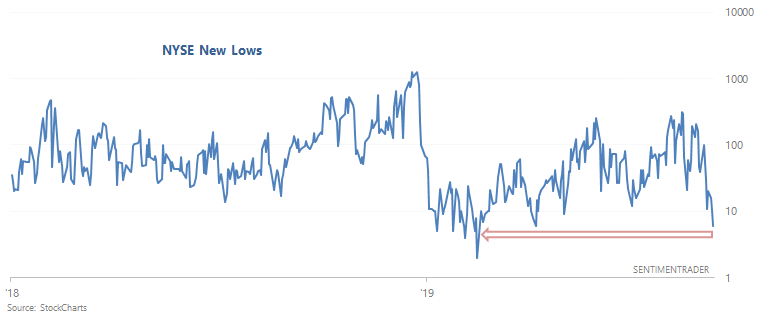
When NYSE New Lows made a 5 month low in the past, the S&P's forward returns weren't particularly bullish, but they weren't bearish either. As I said, the short term is usually very hard to predict.
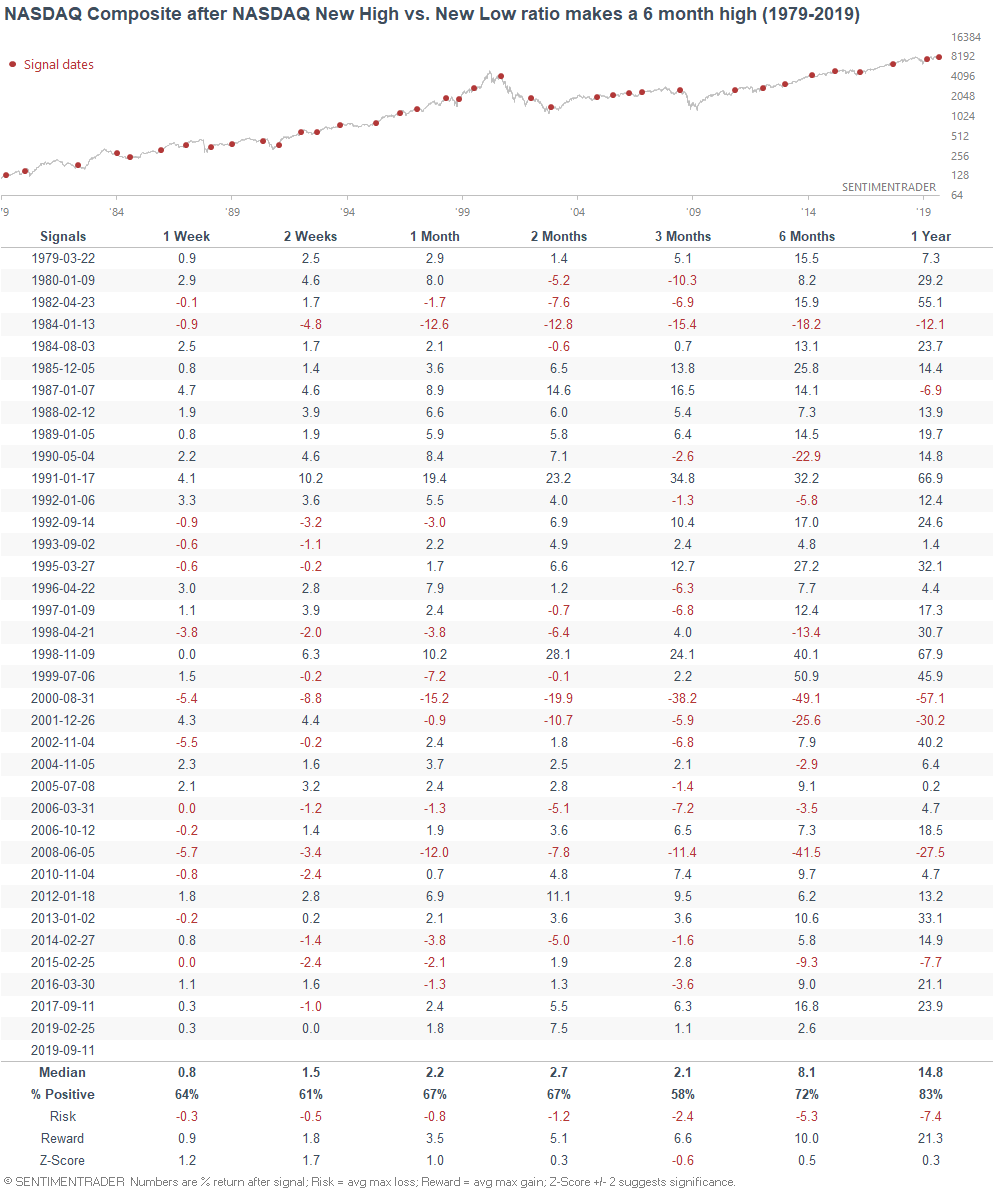
New Highs vs. New Lows
While the # of issues making new highs is below average, the # of issues making new lows is also quite low. As a result, the ratio of new highs vs. new lows has spiked.
The following chart looks at the NASDAQ's New Highs vs. New Lows ratio, which has spiked to the highest level since February.
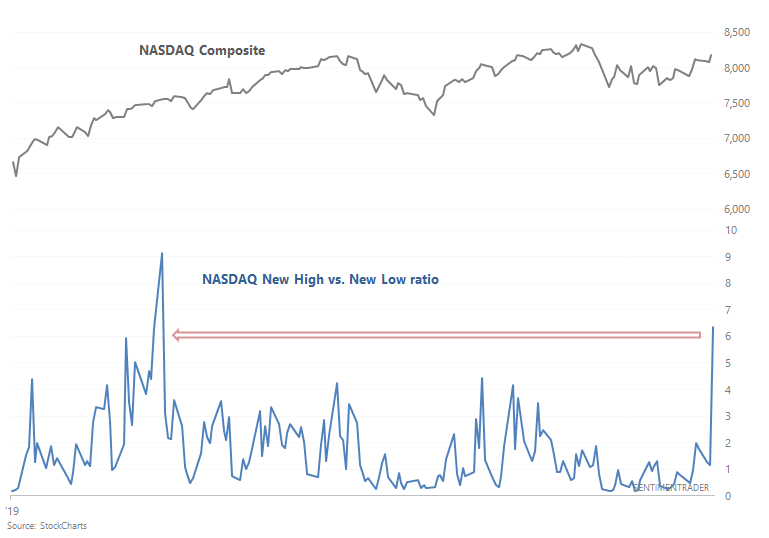
Similar spikes in the past were more bullish than random for the NASDAQ over the next year.
Overall, breadth is not consistently bullish or bearish for stocks over the next month. But it does suggest that the stock market will push on to new highs over the next 6-12 months.