
The TCTM composite washout model triggers a new signal

Key points:
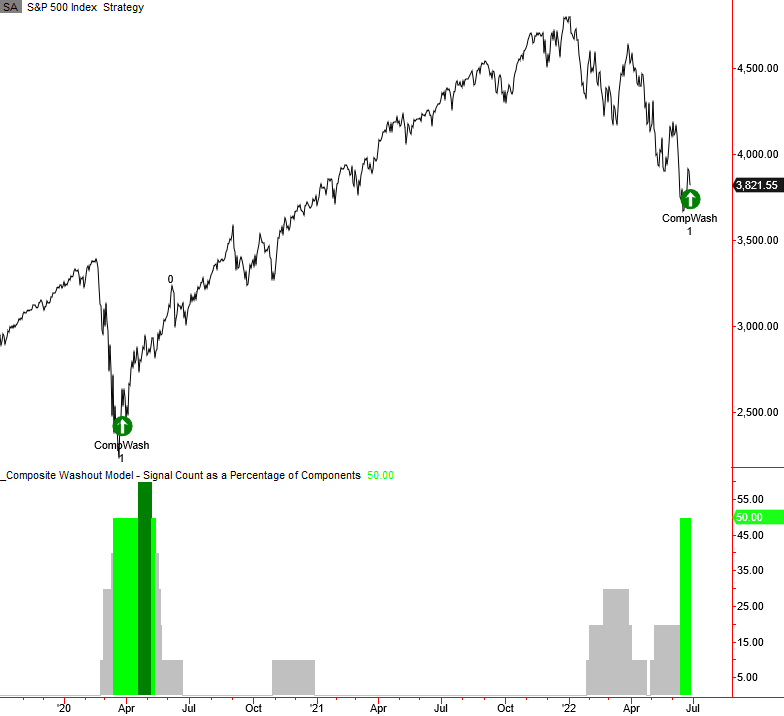
- The TCTM composite washout model exceeded the signal threshold level on 6/14/22
- Market momentum turned positive, and a new alert triggered on 6/28/22
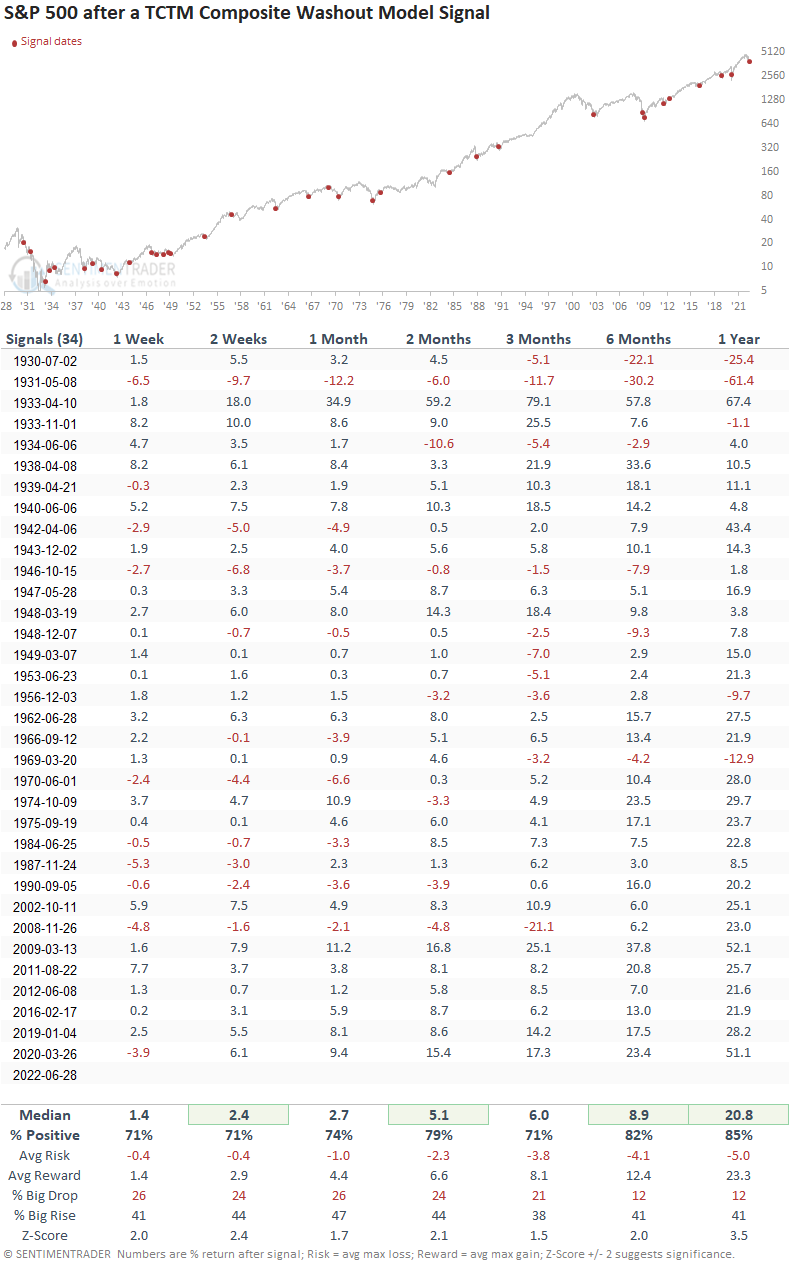
- The S&P 500 rallied 79% of the time over the next 2 months after other signals
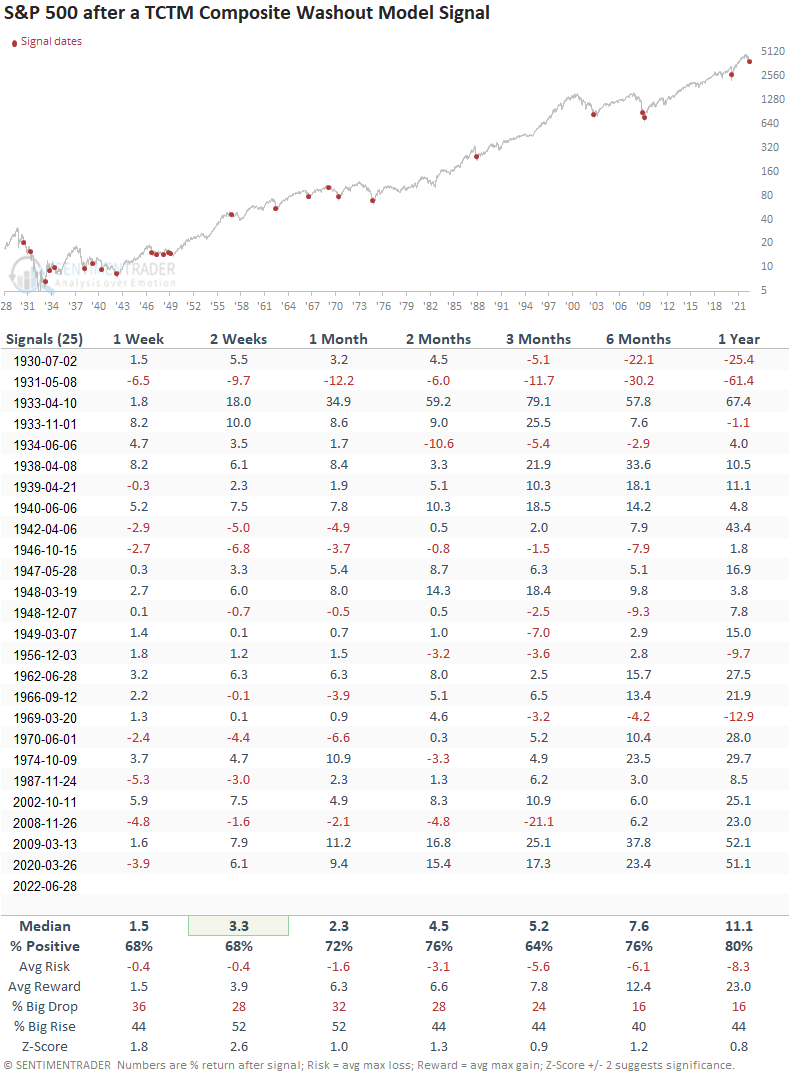
- Signals associated with a bear market rallied 76% of the time over the next 2 months
"A single arrow is easily broken, but not ten in a bundle" Japanese proverb
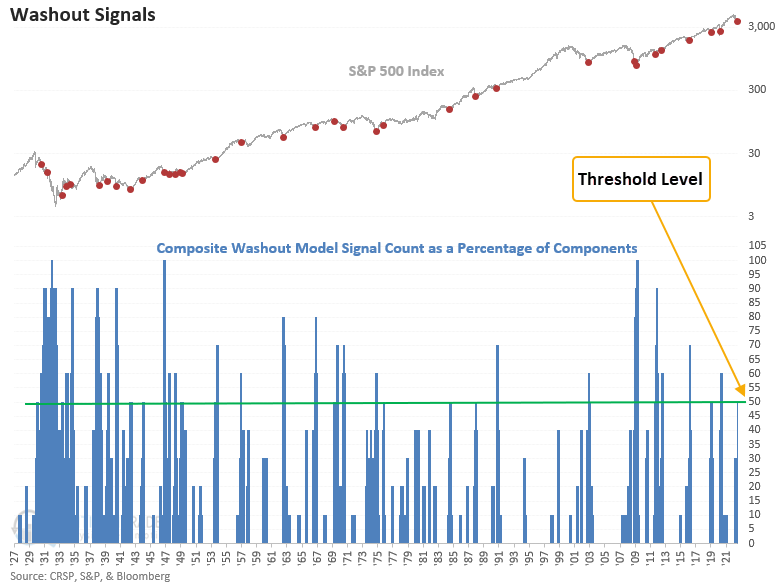
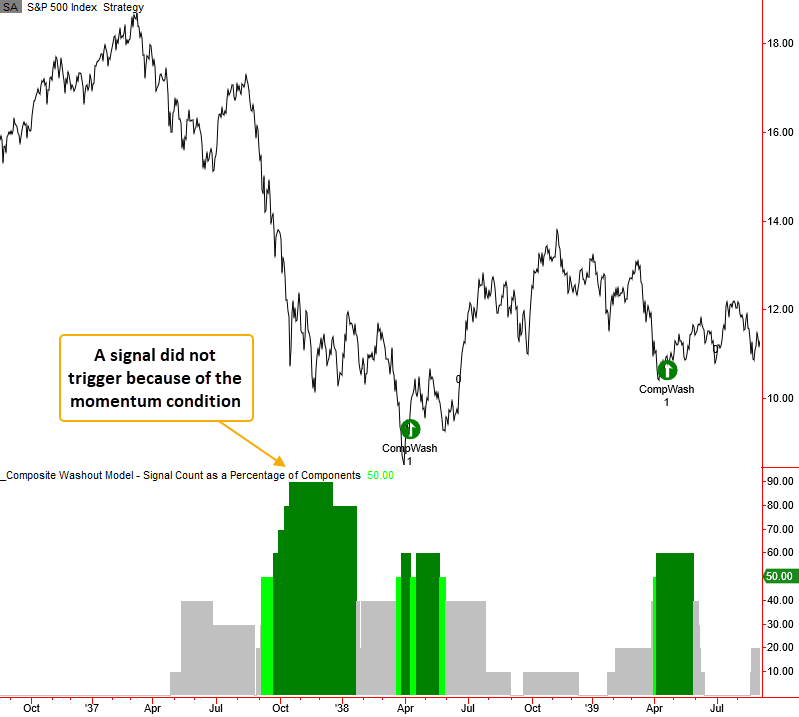
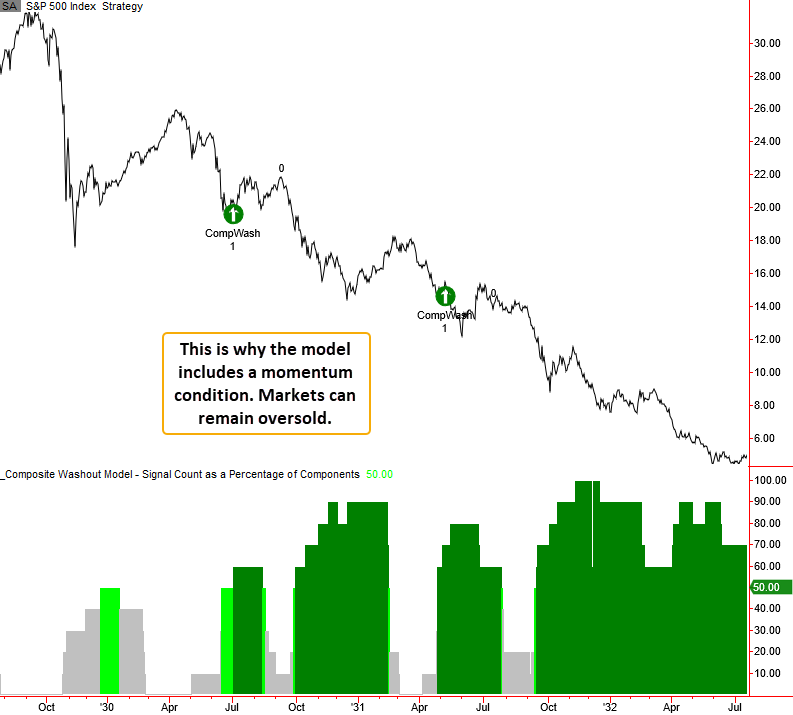
The TCTM Composite Washout Model triggered an alert on Tuesday at the close of trading. A signal occurs when the composite count increases to 50% or more and S&P 500 momentum is favorable within a user-defined number of days. I use the momentum condition because I want to see the market respond positively to the oversold condition versus trying to catch a falling knife. If positive price action fails to develop, the signal will not trigger.
I created the Composite Washout Model to identify potential turning points around bear market lows. It contains 10 components with a heavy reliance on breadth-based indicators.
The model issued an alert for only the 35th time since 1928. The last instance occurred in March 2020, which led to a substantial rally.
Similar signals preceded gains 79% of the time
This model generated a signal 34 other times over the past 92 years. After the others, S&P 500 future returns, win rates, and z-scores were solid across all time frames. The 2-month window contains only 2 drawdowns greater than 5%, which occurred during the challenging 1929-42 period. Except for a handful of instances, the 1-year stats look pretty compelling.
Signals associated with a bear market (down 20% or more from peak)
If I isolate instances based on whether they occurred within the context of a bear market, the model generated a signal 25 other times in the last 92 years. After the others, S&P 500 future returns, win rates, and z-scores were solid across all time frames. However, when I compare the stats to the outlook table for all signals, we see a slight deterioration, especially with the z-scores.
Let's zoom in and review some of the bear market signals/charts since 1929.
Current day chart example
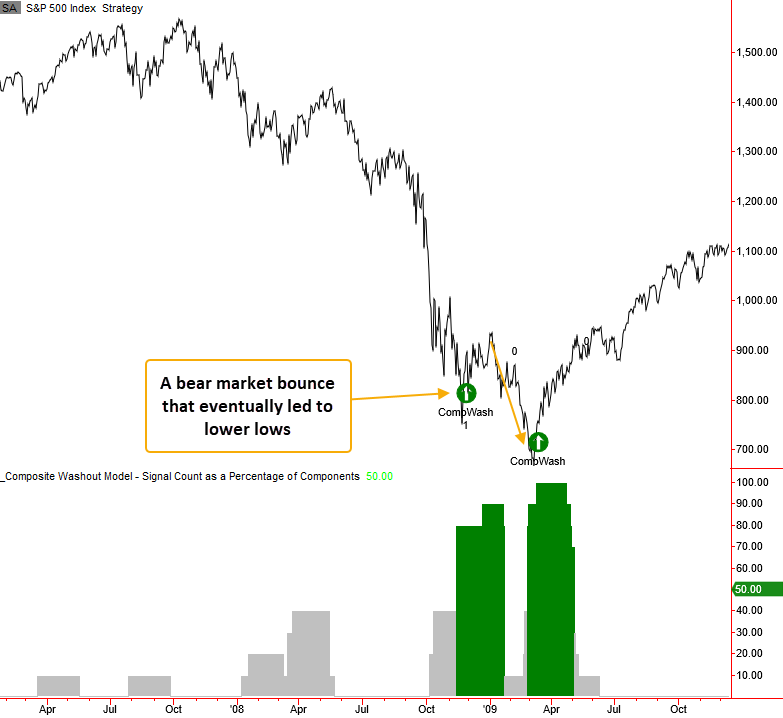
2007-08 bear market example
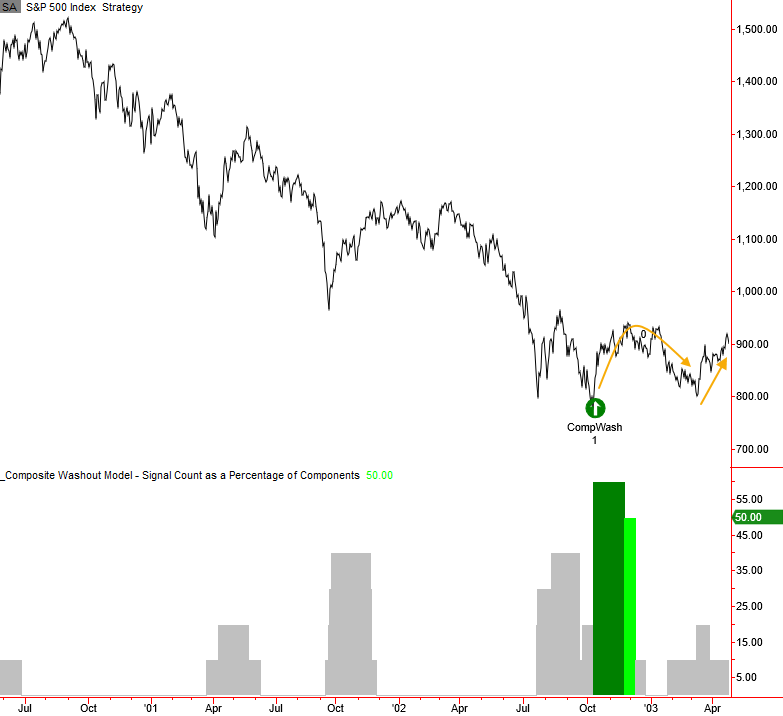
2000-02 bear market example
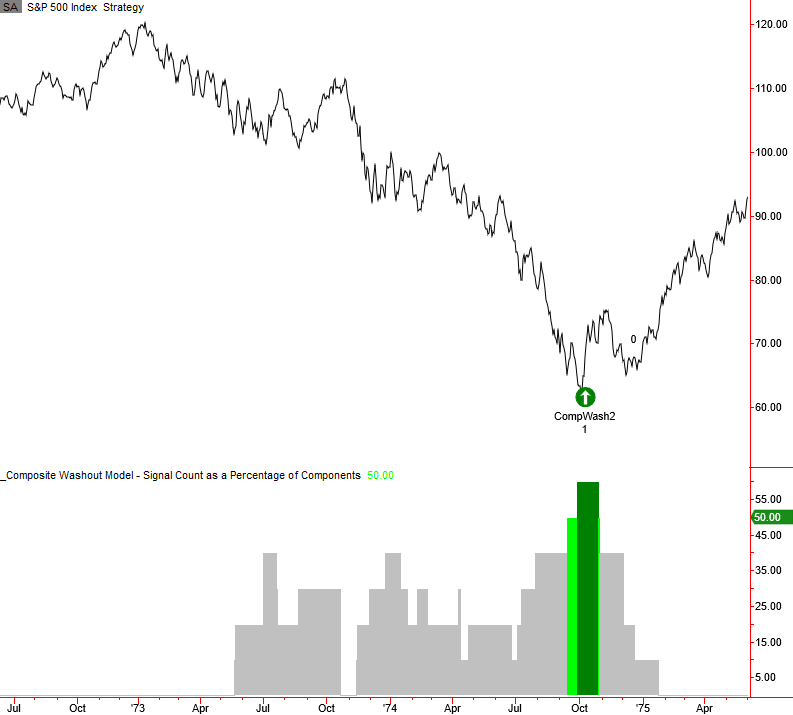
1973-74 bear market example
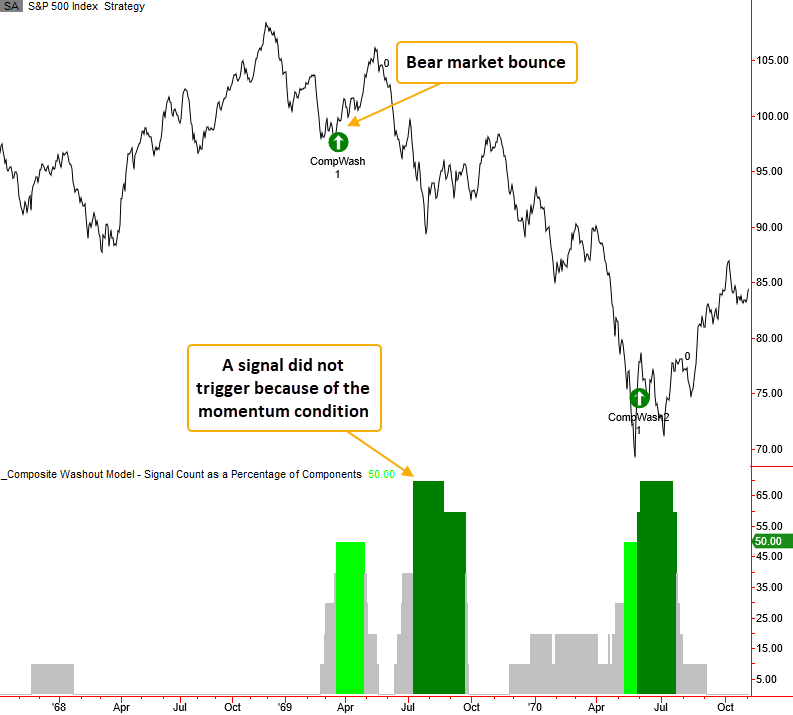
1968-70 bear market example
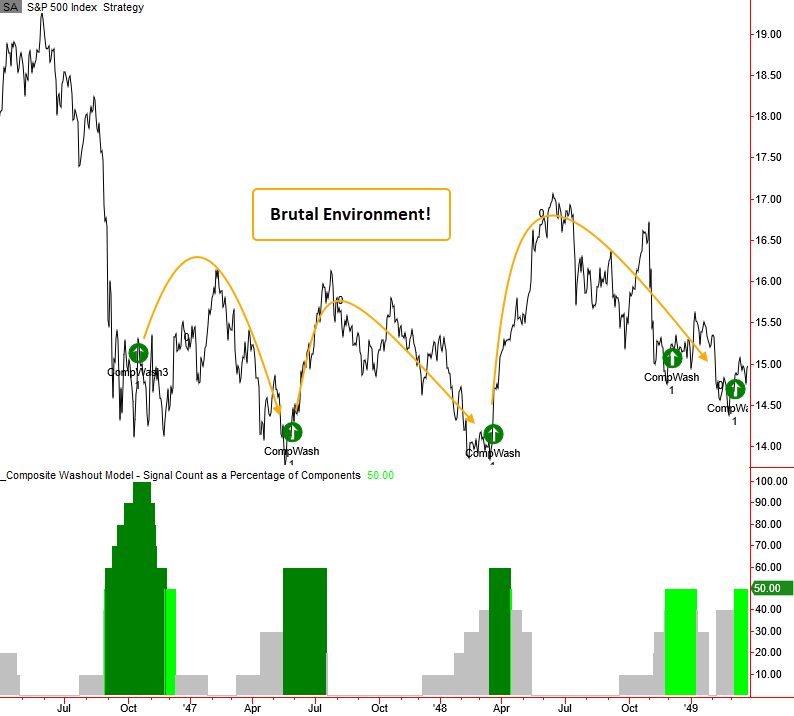
1946-49 bear market example
1937-38 bear market example
1929-32 bear market example
What the research tells us...
When the composite washout model issues an alert, a weight-of-the-evidence approach to identifying a potential bear market low suggests the worst could be over for the time being. Similar setups to what we're seeing now have preceded solid performance, win rates, and z-scores across all time frames, especially in the 2-month window. The results look good when I isolate bear market signals, which is the case now. However, the stats are a little less compelling when compared to all instances.
While the composite washout model issued a new signal, it's somewhat troubling that the 63 & 252-day new low divergence components did not trigger an alert. However, the models could fire bullish signals should the S&P 500 close at a new low with fewer members registering a low. Remember, markets typically bottom when new lows are contracting, not expanding as they are now.
We must also be mindful that most signals occurred when the Federal Reserve was easing policy, not tightening.
The composite thrust model is the most important TCTM component to monitor now that a washout signal has occurred. I like to refer to the thrust model as the bear killer. Stay tuned.