Data &
Technology
Research
Reports
Report Solutions
Reports Library
Actionable
Strategies
Free
Resources
Simple Backtest Calculator
Simple Seasonality Calculator
The Kelly Criterion Calculator
Sentiment Geo Map
Public Research Reports
Free Webinar
Pricing
Company
About
Meet Our Team
In the News
Testimonials
Client Success Stories
Contact
Log inLoginSign up
< BACK TO ALL REPORTS

21-Day High-Low % Spread Risk-Off Model

Dean Christians
2021-02-10
How I use the spread between 21-day highs and lows to identify a risk-off environment?

As many of you are aware by now, I have shared several risk-off studies over the last few weeks. My objective has been twofold. First, I want to prepare our subscribers by sharing my models in advance of any potential signals. I can't tell you when that day will be or how many of my models will trigger. However, I do know that preparation is one of the keys to being a successful investor. The second objective has been to share my thought process around designing a model. I want to share an important one today. My risk-off models always contain conditions that require the Index to be either a user-defined percentage below or a number of days since a high. If I'm going to hedge my portfolio, I want to do it as close to a high as possible.

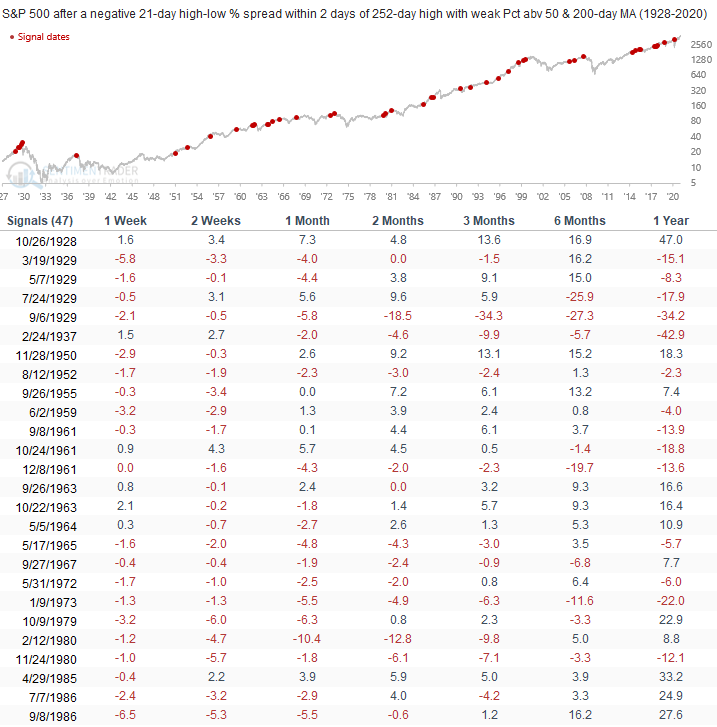
In today's note, I plan to share another risk-off model I utilize to manage portfolio risk. The process seeks to identify instances in history when the S&P 500 Index is two days or less from a 252-day, and market participation is weak.

21-Day High-Low % Spread Risk-Off Components

  • Percentage of S&P 500 members at a 21-Day high 
  • Percentage of S&P 500 members at a 21-Day low 
  • Percentage of S&P 500 members above the 50-day MA
  • Percentage of S&P 500 members above the 200-day MA

21-Day High-Low % Spread Risk-Off Signal

The 21-Day High-Low % Spread risk-off signal will issue an alert based upon the following conditions. 

Condition1 =  21-Day High-Low % Spread <= -0.5% (today)

Condition2 = 21-Day High-Low % Spread <= 20% (2 days prior)

Condition3 = 21-Day High-Low % Spread <= 10% (1 days prior)

Condition4 = S&P 500 Index <= two days from a 252-day high

Condition5 = S&P 500 Index <= 3% from a 252-day high

Condition6 = Number of members above the 50-day MA <= 66%

Condition7 = Number of members above the 200-day MA <= 75%

Current Model Conditions

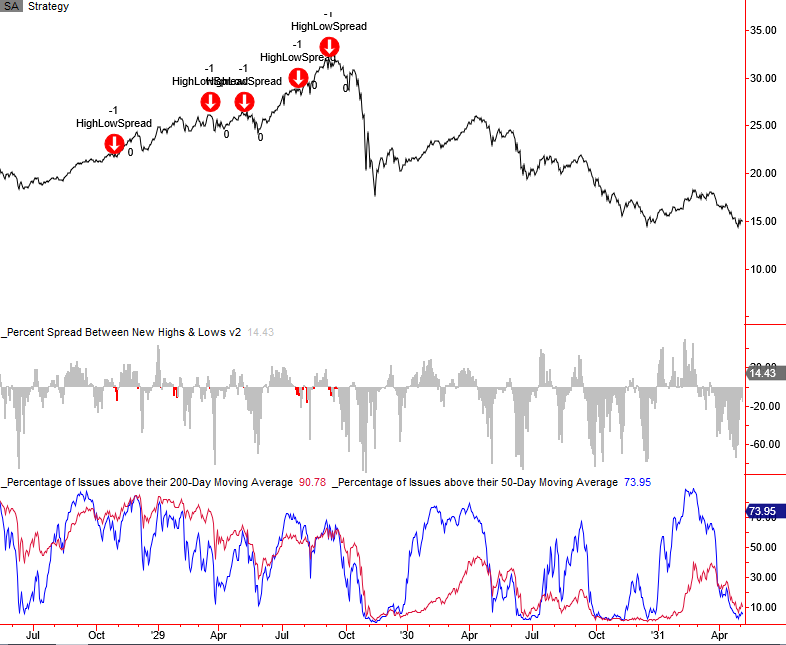
While the high-low % spread has softened and shows a lower low on the most recent high in the S&P 500, it's unlikely that a risk-off signal will trigger in the near-term. The percentage of members above the 200-day moving average remains well above the signal threshold, and the percent above the 50-day is currently improving. Please note, I calculated performance statistics in the chart as a short signal, whereas annualized returns result from buying the S&P 500.


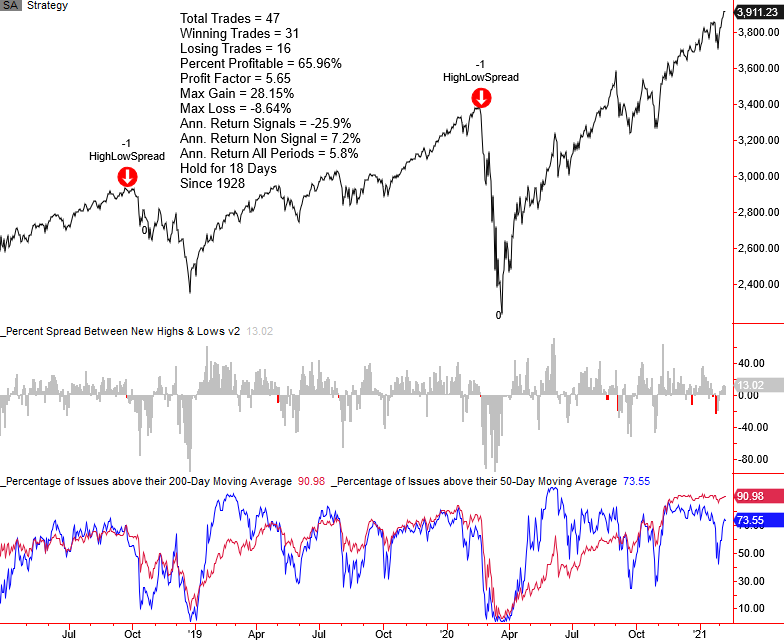
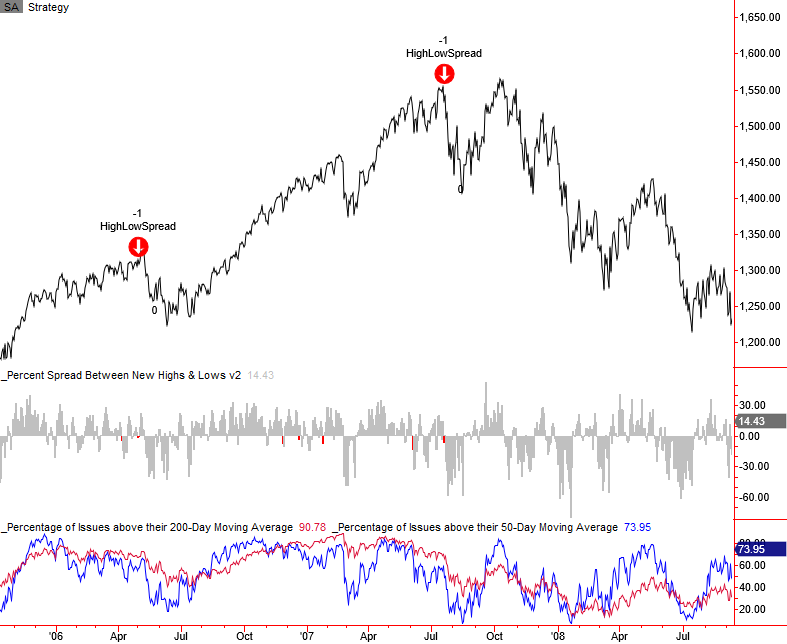
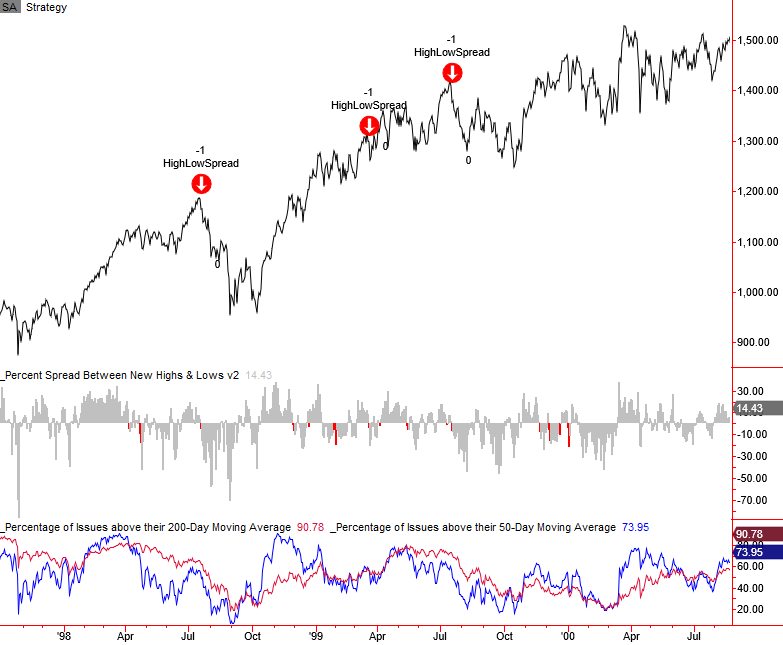
Historical Chart and Signal Examples
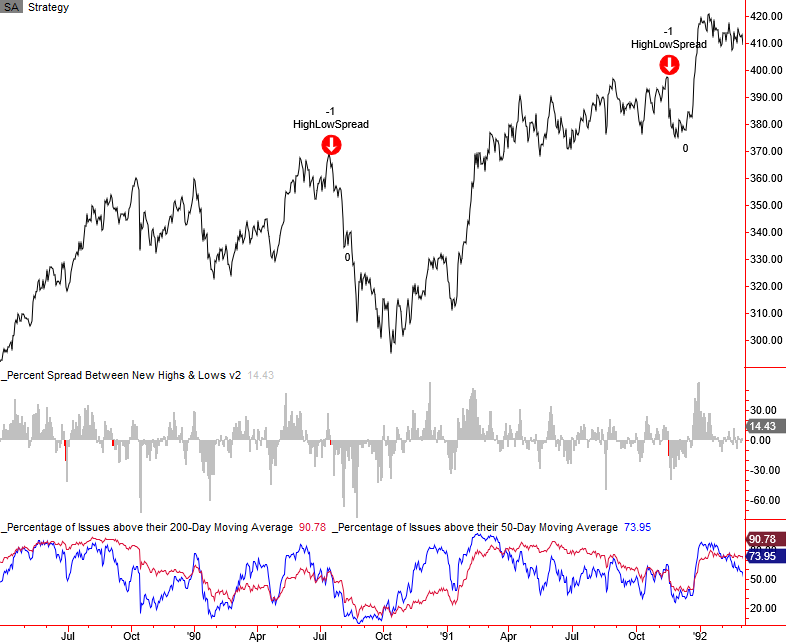
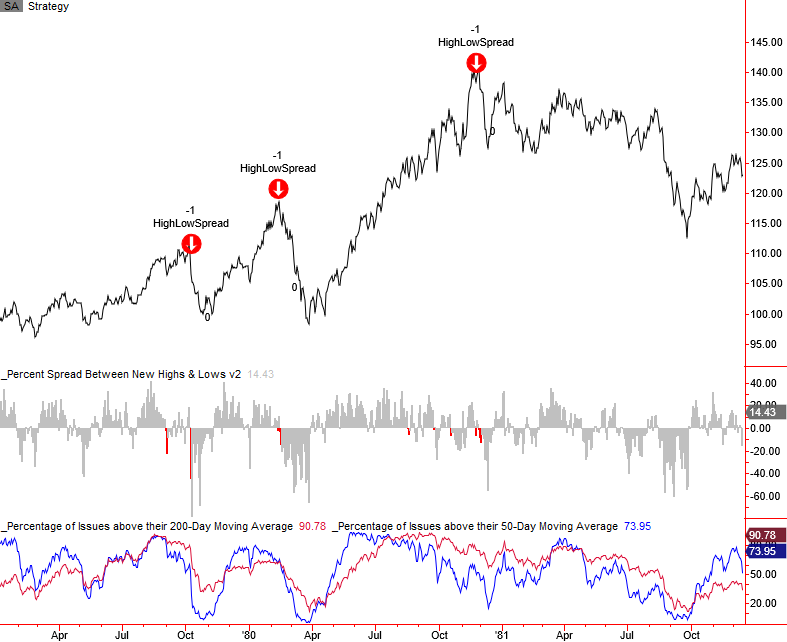
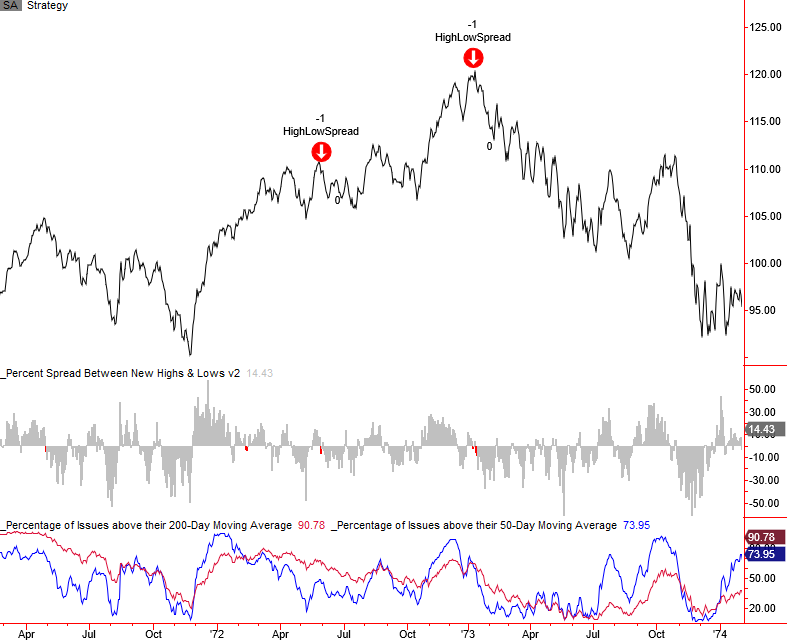
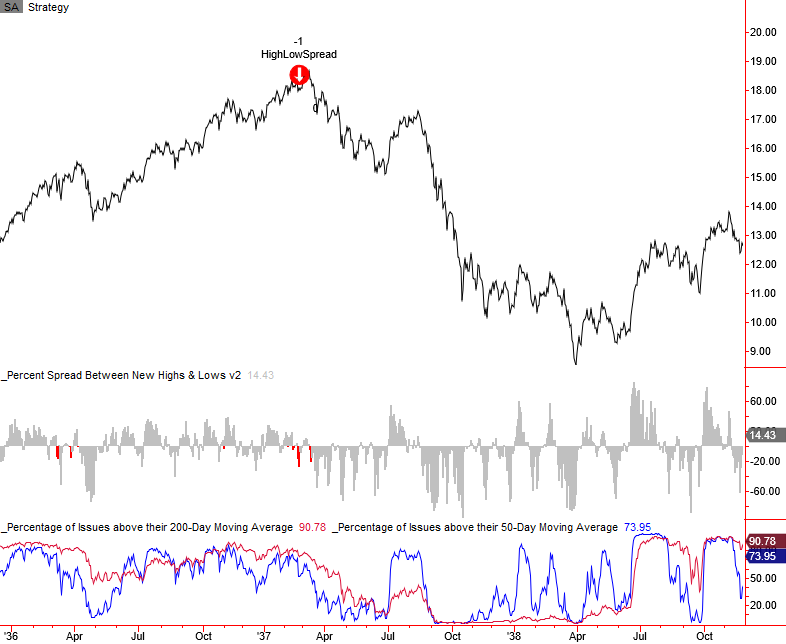
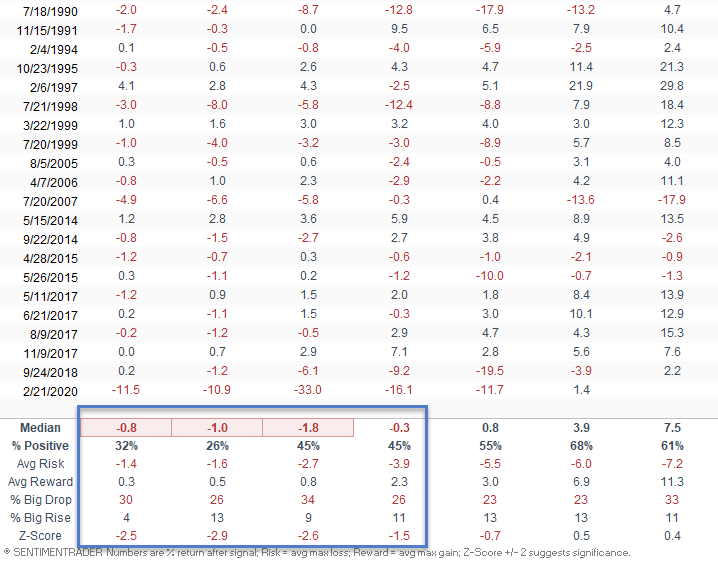


Signal Performance

As the table below shows, the 1-8 week timeframe shows weak S&P 500 Index results.

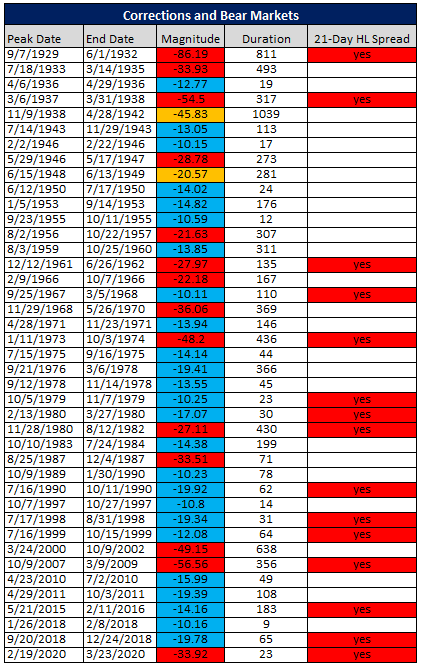
Corrections and Bear Markets

I maintain the following table for all of my primary risk-on or off models. I'm sharing it today so that I can make the following point. There is no holy grail when it comes to trading indicators, models, or systems. While the 21-day high-low % spread model is good, it will not trigger at the outset of every correction or bear market peak, as the table below shows. I use a weight-of-the-evidence approach with several risk-off models to cast a wide net.


Sorry, you don't have access to this report

Upgrade your subscription plan to get access
Go to Dasboard
DATA &
TECHnologies
IndicatorEdge
‍
BackTestEdge
‍
Other Tools
‍
DataEdge API
RESEARCH
reports
Research Solution
‍
Reports Library
‍
actionable
Strategies
Trading Strategies
‍
Smart Stock Scanner
‍
FREE
RESOUrCES
Simple Backtest
Calculator
Simple Seasonality
Calculator
The Kelly Criterion
Calculator
Sentiment Geo Map
‍
Public Research Reports
‍
Free Webinar
COMPANY
‍
About
‍
Meet our Team
‍
In the News
‍
Testimonials
‍
Client Success Stories
Pricing
Bundle pricing
‍
Announcements
‍
FAQ
© 2024 Sundial Capital Research Inc. All rights reserved.
Setsail Marketing
TermsPrivacyAffiliate Program
Risk Disclosure: Futures and forex trading contains substantial risk and is not for every investor. An investor could potentially lose all or more than the initial investment. Risk capital is money that can be lost without jeopardizing ones’ financial security or life style. Only risk capital should be used for trading and only those with sufficient risk capital should consider trading. Past performance is not necessarily indicative of future results.

Hypothetical Performance Disclosure: Hypothetical performance results have many inherent limitations, some of which are described below. No representation is being made that any account will or is likely to achieve profits or losses similar to those shown; in fact, there are frequently sharp differences between hypothetical performance results and the actual results subsequently achieved by any particular trading program. One of the limitations of hypothetical performance results is that they are generally prepared with the benefit of hindsight. In addition, hypothetical trading does not involve financial risk, and no hypothetical trading record can completely account for the impact of financial risk of actual trading. for example, the ability to withstand losses or to adhere to a particular trading program in spite of trading losses are material points which can also adversely affect actual trading results. There are numerous other factors related to the markets in general or to the implementation of any specific trading program which cannot be fully accounted for in the preparation of hypothetical performance results and all which can adversely affect trading results.

Testimonial Disclosure: Testimonials appearing on this website may not be representative of other clients or customers and is not a guarantee of future performance or success.