
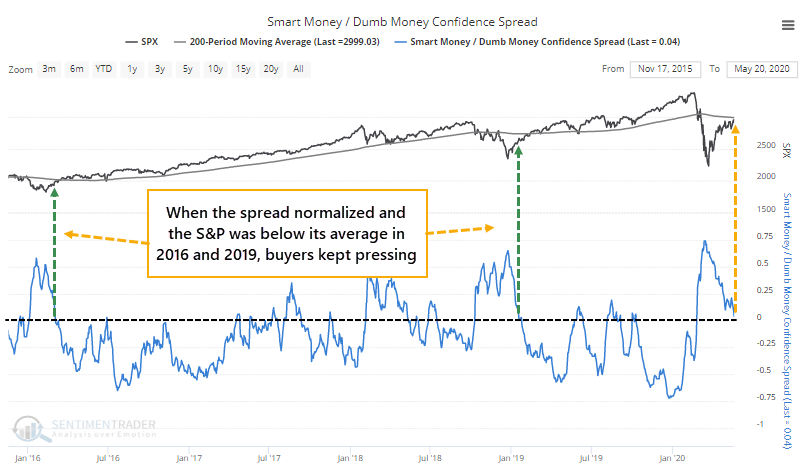
The spread between Smart and Dumb Money is narrowing

In January and February, there was a pretty clear consensus among our indicators - sentiment was extremely optimistic. In March, that consensus had flipped 180 degrees.
Now that we're in the post-panic chop, there is much less of a unified picture. We've discussed this several times recently, like some surveys and other measures showing pessimism while the behavior of options traders suggests overwhelming optimism.
It gets confusing, which is why we like to rely more heavily on aggregate models that take most of those factors into account. When we do that, we can see that both Smart Money Confidence and Dumb Money Confidence are both high, which is confusing in itself. Normally, the two move opposite each other.
Even so, the spread between them is nearing zero. During bear markets, we start to enter the danger zone when sentiment becomes neutral after bouts of severe pessimism. That's where we are now.
This happened in 2016 and 2019 as well. The spread neared zero while the S&P 500 was still below its 200-day average. After those, buyers persisted and that was a good sign longer-term.
Below, we can see other times when the spread narrowed after at least a month of being above +5%. These are only times when the S&P was below its 200-day average at the time.
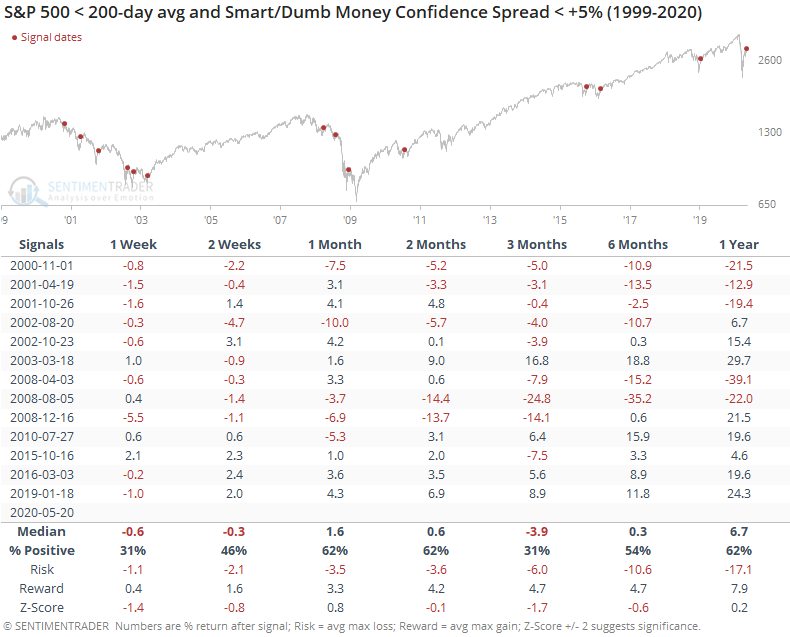
There was a decent correlation between the S&P's returns over the next two weeks and its returns over the next year. That suggests at least a weak pattern like we saw the last two times - if buyers persisted shorter-term, then they were likely to persist longer-term, too.
All but three of these signals showed a negative return either 1, 2, or 3 months later. Those were the recovery in early 2003, then again in 2016 and 2019 as shown above. Stocks are in a vulnerable stretch here, with the tailwind of excessive pessimism mostly gone. Now it has to trade on its merits. If those are strong enough to continue to propel it higher in the coming weeks to months, then it suggests a much longer recovery is in store.