Data &
Technology
Research
Reports
Report Solutions
Reports Library
Actionable
Strategies
Free
Resources
Simple Backtest Calculator
Simple Seasonality Calculator
The Kelly Criterion Calculator
Sentiment Geo Map
Public Research Reports
Free Webinar
Pricing
Company
About
Meet Our Team
In the News
Testimonials
Client Success Stories
Contact
Log inLoginSign up
< BACK TO ALL REPORTS

The options market hasn't done this since 2002

Jason Goepfert
2020-05-21
Over the past 3 days, the Equity-only Put/Call Ratio has been below 0.5, meaning options traders turned over half has many puts as calls, typically a sign of optimism. Stocks have struggled when the ratio was this low over a 3-day period, and it hasn't happened since 2002 when the S&P 500 was below its 200-day average.

On Monday, we saw that the smallest of options traders had become so aggressively optimistic about a continued rally that they established a record number of bullish versus bearish trades.

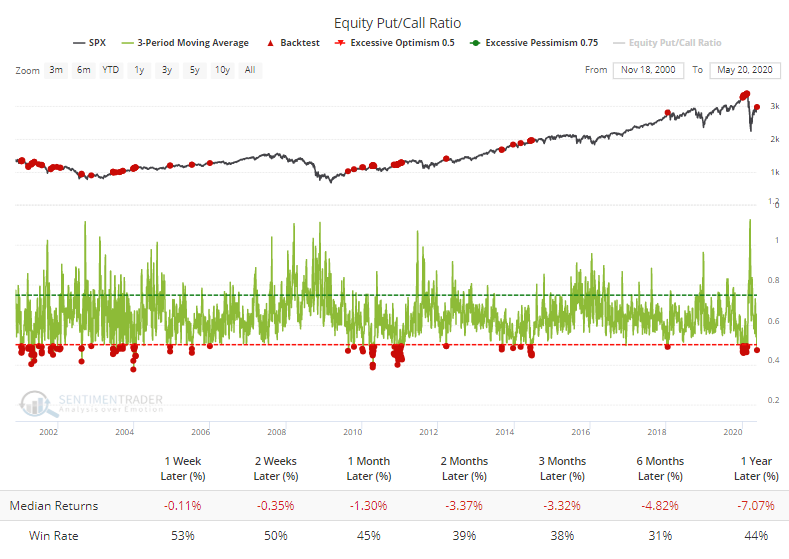
That sentiment seems to have spread to the options market at large. Over the past three sessions, options traders have turned over only half as many put contracts as call contracts. This is the first time in months that the 3-day average of the Equity-only Put/Call Ratio has been below 0.5.

The Backtest Engine shows that the S&P 500 has struggled when the ratio was this low. This is only the last 20 years - prior to that, the ratio was persistently low. The pricking of the internet bubble triggered an overall higher range in put/call ratios.

If we focus only on the first time that the 3-day average of the ratio fell below 0.5 in at least 30 sessions, then we get the following returns for the S&P 500.

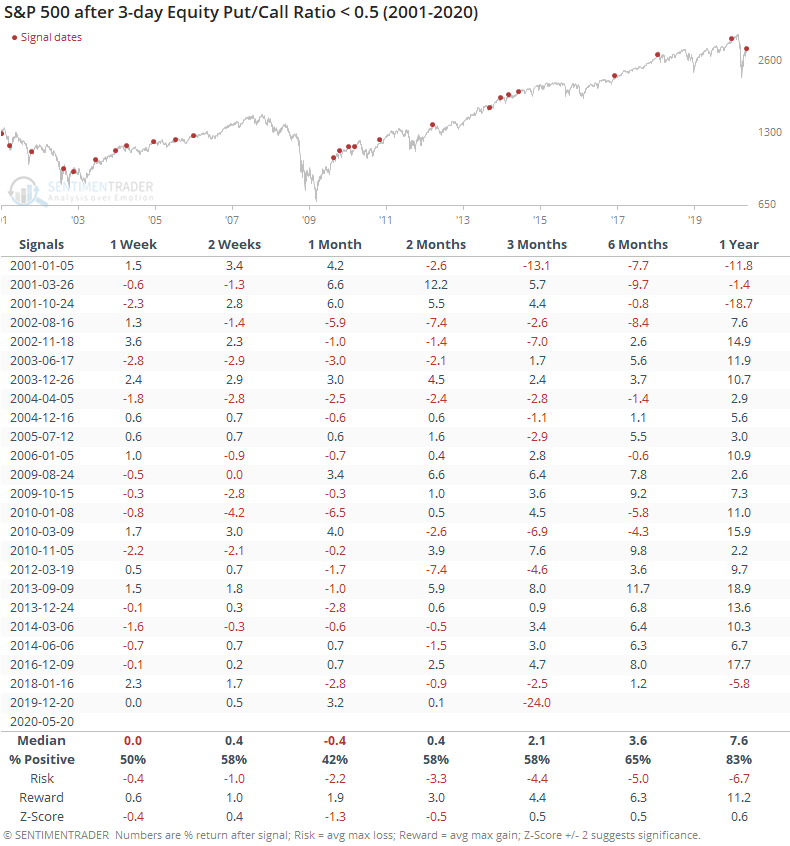
It still showed a flat to negative bias up to three months later in the risk/reward ratio. Of the 24 signals, 19 of them showed a negative return either 1, 2, or 3 months later.

What's especially notable now is that this apparent optimism is occurring while the S&P is still trading below its 200-day average. That has only happened in 2001 and 2002, never since.

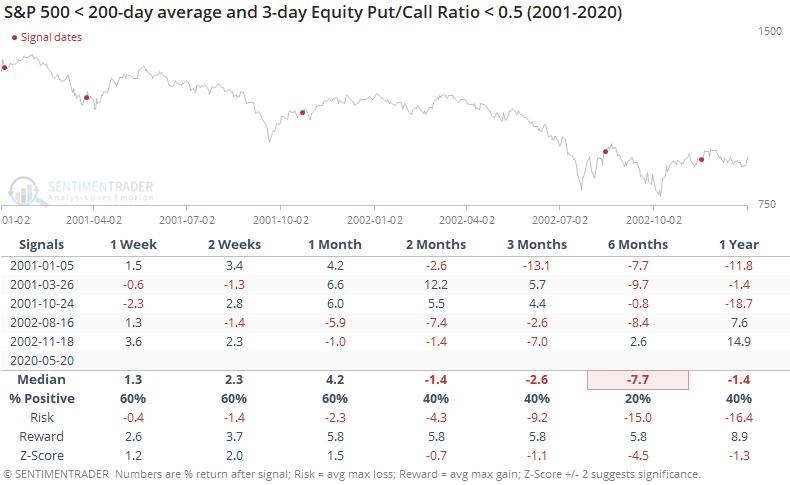
Returns were mixed after those, with it taking various lengths of time before the optimism wore off with lower prices. Because it was a protracted bear market, these bouts of optimism led to poor results over the next 2-6 months.

When we see readings like this lead to poor returns even during bull markets, the current level of options activity is a worry. The saving grace might be that we're early enough in a new bull market to run over any negatives like this, but that's placing a lot of faith in the idea that we've passed the worst of the damage.

Sorry, you don't have access to this report

Upgrade your subscription plan to get access
Go to Dasboard
DATA &
TECHnologies
IndicatorEdge
‍
BackTestEdge
‍
Other Tools
‍
DataEdge API
RESEARCH
reports
Research Solution
‍
Reports Library
‍
actionable
Strategies
Trading Strategies
‍
Smart Stock Scanner
‍
FREE
RESOUrCES
Simple Backtest
Calculator
Simple Seasonality
Calculator
The Kelly Criterion
Calculator
Sentiment Geo Map
‍
Public Research Reports
‍
Free Webinar
COMPANY
‍
About
‍
Meet our Team
‍
In the News
‍
Testimonials
‍
Client Success Stories
Pricing
Bundle pricing
‍
Announcements
‍
FAQ
© 2024 Sundial Capital Research Inc. All rights reserved.
Setsail Marketing
TermsPrivacyAffiliate Program
Risk Disclosure: Futures and forex trading contains substantial risk and is not for every investor. An investor could potentially lose all or more than the initial investment. Risk capital is money that can be lost without jeopardizing ones’ financial security or life style. Only risk capital should be used for trading and only those with sufficient risk capital should consider trading. Past performance is not necessarily indicative of future results.

Hypothetical Performance Disclosure: Hypothetical performance results have many inherent limitations, some of which are described below. No representation is being made that any account will or is likely to achieve profits or losses similar to those shown; in fact, there are frequently sharp differences between hypothetical performance results and the actual results subsequently achieved by any particular trading program. One of the limitations of hypothetical performance results is that they are generally prepared with the benefit of hindsight. In addition, hypothetical trading does not involve financial risk, and no hypothetical trading record can completely account for the impact of financial risk of actual trading. for example, the ability to withstand losses or to adhere to a particular trading program in spite of trading losses are material points which can also adversely affect actual trading results. There are numerous other factors related to the markets in general or to the implementation of any specific trading program which cannot be fully accounted for in the preparation of hypothetical performance results and all which can adversely affect trading results.

Testimonial Disclosure: Testimonials appearing on this website may not be representative of other clients or customers and is not a guarantee of future performance or success.