Data &
Technology
Research
Reports
Report Solutions
Reports Library
Actionable
Strategies
Free
Resources
Simple Backtest Calculator
Simple Seasonality Calculator
The Kelly Criterion Calculator
Sentiment Geo Map
Public Research Reports
Free Webinar
Pricing
Company
About
Meet Our Team
In the News
Testimonials
Client Success Stories
Contact
Log inLoginSign up
< BACK TO ALL REPORTS

New lows tick higher even with historic year-ago comparisons

Jason Goepfert
2021-03-24
With some weakness this week, there was a flip in the percentage of securities trading at 52-week lows versus those at 52-week highs. There hasn't been a protracted divergence, often seen near major peaks, but it's not necessary. And it likely won't happen given how far the median stock is above its 52-week low.

One of the major developments we've been watching for ever since there was overwhelming evidence of excessive optimism is weakening internals.

That can take any number of forms, and for the most part, we haven't really seen it.

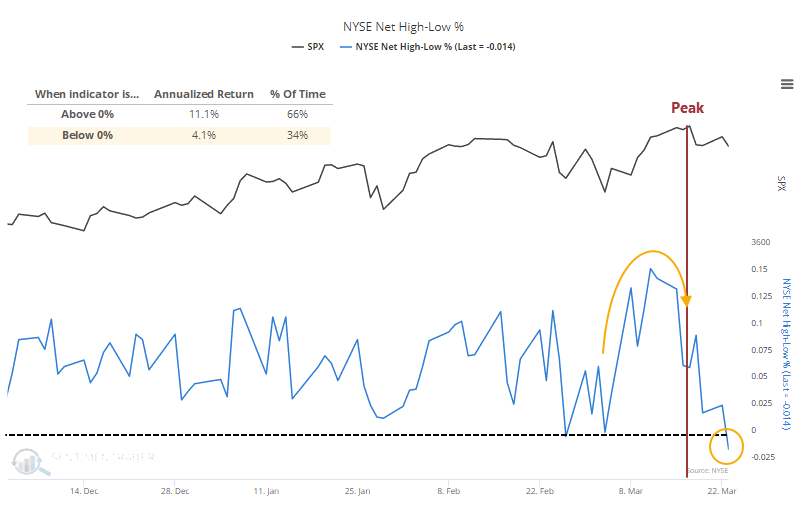
One of the clearest ways to look for this is the net percentage of securities on the NYSE that reach 52-week highs versus 52-week lows. After the surge in new highs in early March, there was a minor divergence as those figures weakened even as the S&P 500 made a new high, but it wasn't major.

More concerning is that by Tuesday, there were more 52-week lows than 52-week highs. We can see the stark difference in forward returns in the chart below when this metric is below zero. It's also a worry that this has flipped so soon after a new high in the S&P, triggering the Titanic Syndrome noted in Tuesday's Daily Report.

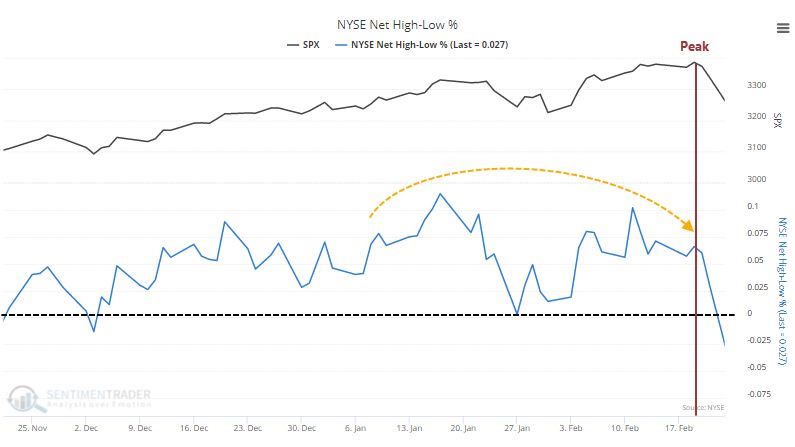
When the S&P peaked last year, there was more of a divergence but even that wasn't too major. And when stocks peaked, there were still many more issues hitting new highs than new lows.

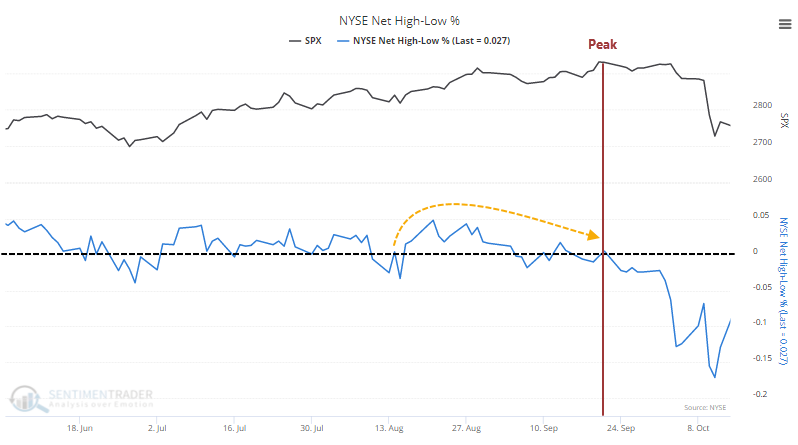
The peak prior to that, in September 2018, was much more pronounced. Even as stocks were hitting new highs, there were actually more new lows on the NYSE than new highs. Major warning sign.

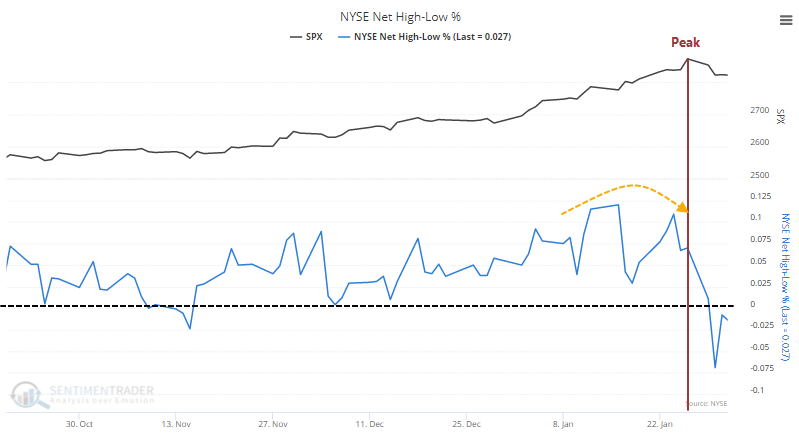
The big rally at the end of 2017 and into early 2018 didn't show any major divergence before stocks peaked.

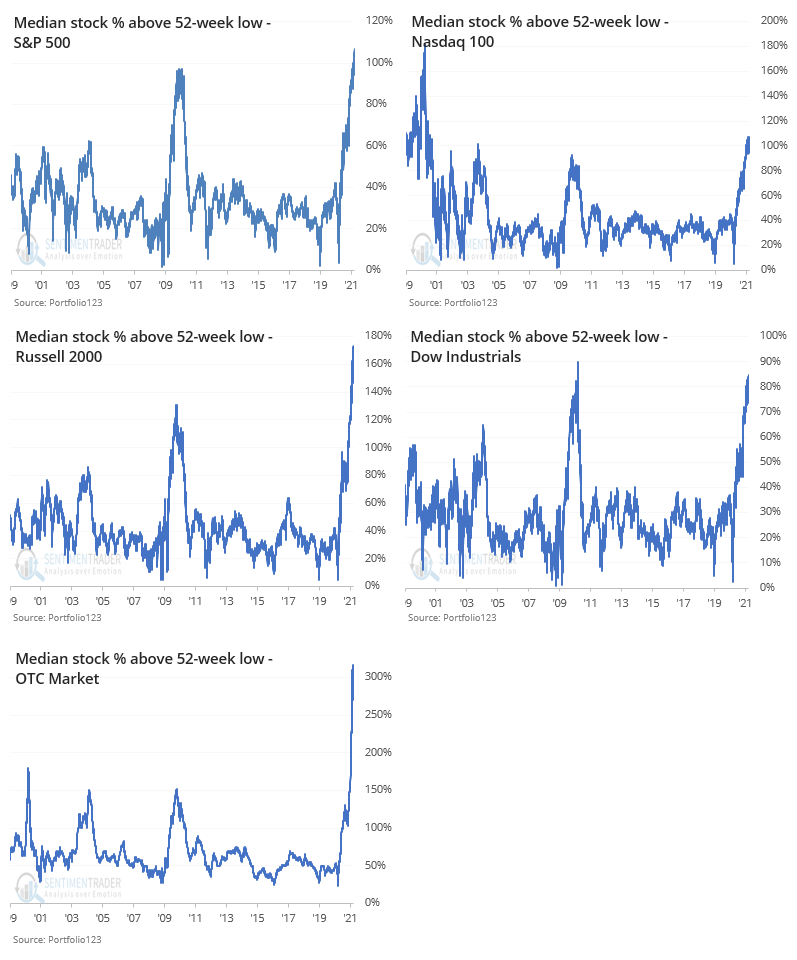
The reason we shouldn't expect a divergence this time is simply how far stocks have traveled. Across all the major equity indexes, and throwing in over-the-counter stocks just because they have seen such a tremendous surge of interest, the median stock is up more than 100% from its lows.

That's more than the initial recoveries off the bear market bottoms in 2003 and 2009.

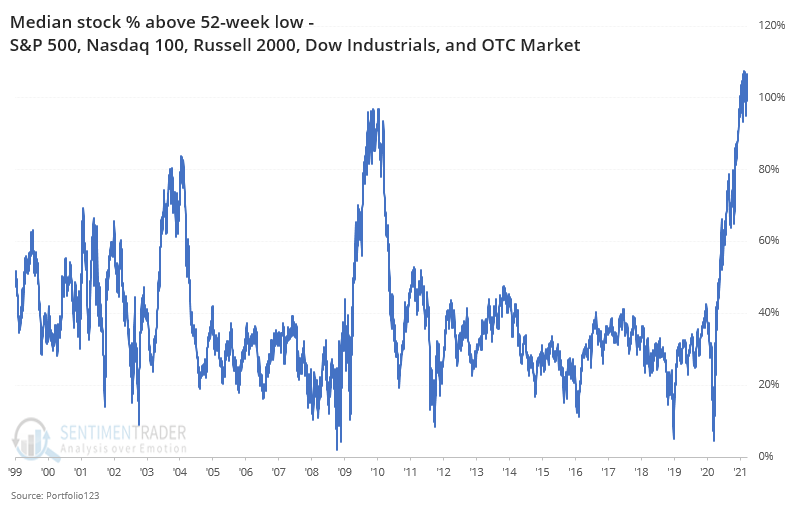
Among the indexes, we can see just how much the average stock has rallied.

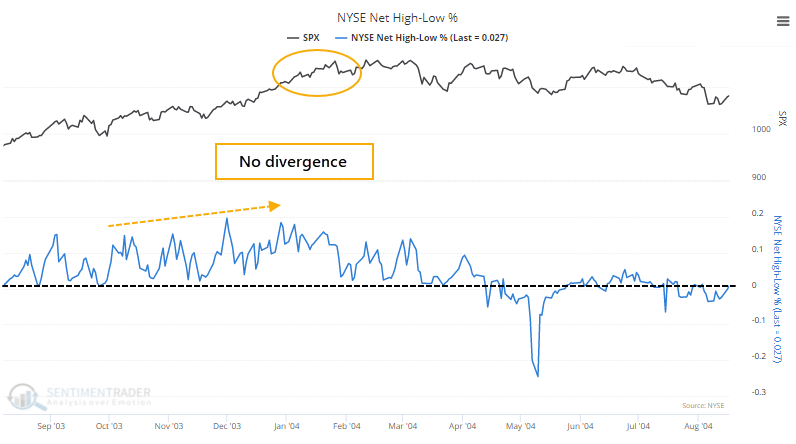
If we go back to the other two times when the median stock was at least 80% above its 52-week low, then we can see if there were divergences then between the S&P 500 and the NYSE Net New High / New Low line.

In early 2004, when the median stock was more than 80% above its low, breadth was still very strong and there was no divergence before stocks slumped into months of choppy downside.

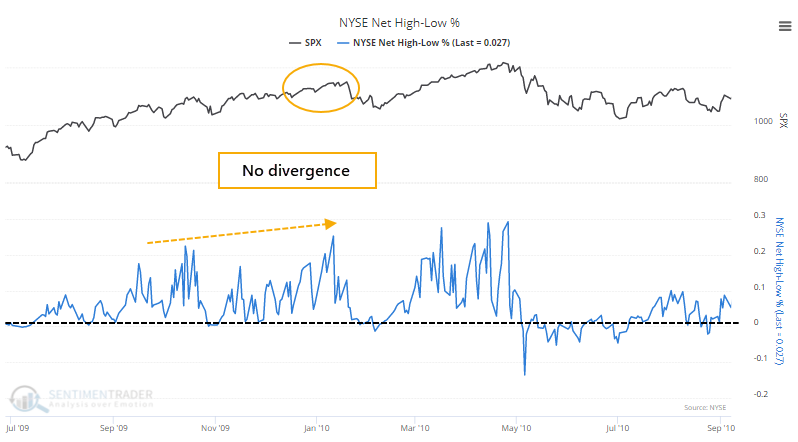
Same goes for early 2010, when the median stock had doubled off its financial crisis low.

Based on this, we're not likely to see the 52-week low list grow any time soon. The average stock has skyrocketed off its low from a year ago, so it will take either a massive decline, or simply more time to generate easier 52-week comparisons, before the list will grow and potentially trigger a divergence with indexes like the S&P. Those divergences, while a warning sign if present, are not required before stocks correct. The more the net percentage of securities remains below zero, the more risk there is of a weakening market.

DATA &
TECHnologies
IndicatorEdge
‍
BackTestEdge
‍
Other Tools
‍
DataEdge API
RESEARCH
reports
Research Solution
‍
Reports Library
‍
actionable
Strategies
Trading Strategies
‍
Smart Stock Scanner
‍
FREE
RESOUrCES
Simple Backtest
Calculator
Simple Seasonality
Calculator
The Kelly Criterion
Calculator
Sentiment Geo Map
‍
Public Research Reports
‍
Free Webinar
COMPANY
‍
About
‍
Meet our Team
‍
In the News
‍
Testimonials
‍
Client Success Stories
Pricing
Bundle pricing
‍
Announcements
‍
FAQ
© 2024 Sundial Capital Research Inc. All rights reserved.
Setsail Marketing
TermsPrivacyAffiliate Program
Risk Disclosure: Futures and forex trading contains substantial risk and is not for every investor. An investor could potentially lose all or more than the initial investment. Risk capital is money that can be lost without jeopardizing ones’ financial security or life style. Only risk capital should be used for trading and only those with sufficient risk capital should consider trading. Past performance is not necessarily indicative of future results.

Hypothetical Performance Disclosure: Hypothetical performance results have many inherent limitations, some of which are described below. No representation is being made that any account will or is likely to achieve profits or losses similar to those shown; in fact, there are frequently sharp differences between hypothetical performance results and the actual results subsequently achieved by any particular trading program. One of the limitations of hypothetical performance results is that they are generally prepared with the benefit of hindsight. In addition, hypothetical trading does not involve financial risk, and no hypothetical trading record can completely account for the impact of financial risk of actual trading. for example, the ability to withstand losses or to adhere to a particular trading program in spite of trading losses are material points which can also adversely affect actual trading results. There are numerous other factors related to the markets in general or to the implementation of any specific trading program which cannot be fully accounted for in the preparation of hypothetical performance results and all which can adversely affect trading results.

Testimonial Disclosure: Testimonials appearing on this website may not be representative of other clients or customers and is not a guarantee of future performance or success.