Headlines
|
|
Credit investors are getting a bit nervous:
In recent days, there have been some signs that corporate bond investors are getting a bit worried. The spread on BBB-rated bonds is rising faster than the spread on AAA-rated ones, something we see during times of rising anxiety.
Titanic Syndrome: When the S&P 500 was recently at a 52-week high, and then suddenly there are more securities at 52-week lows than 52-week highs on the NYSE, it triggers a Titanic Syndrome. This is one of the silly-sounding technical warning signs like the Hindenburg Omen. Despite the names, they tend to be effective, especially when triggering in clusters (which we haven't seen yet). The Backtest Engine shows that when there is even a single warning, two weeks later the S&P was higher after 100 out of 244 signals, a 41% win rate, averaging a return of -0.65%.
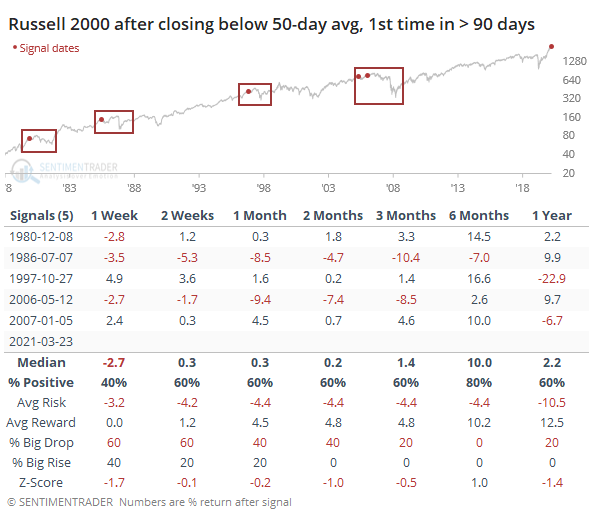
Russell rocked: For the first time in 96 sessions, the small-cap Russell 2000 index closed below its 50-day moving average. That ends the index's 14th-longest streak above its average since 1979. There have been 5 other times it ended a long streak like this while hitting an all-time high within the past two weeks. The forward returns in the table aren't all that bad, but the red boxes on the chart show that the index had some long-term trouble regaining its momentum.
Bottom Line:
See the Outlook & Allocations page for more details on these summaries STOCKS: Weak sell
The extreme speculation registered in January and February is starting to get wrung out. Internal dynamics have mostly held up, so a return to neutral sentiment conditions would improve the forward risk/reward profile substantially. We're still a ways off from that. BONDS: Weak buy
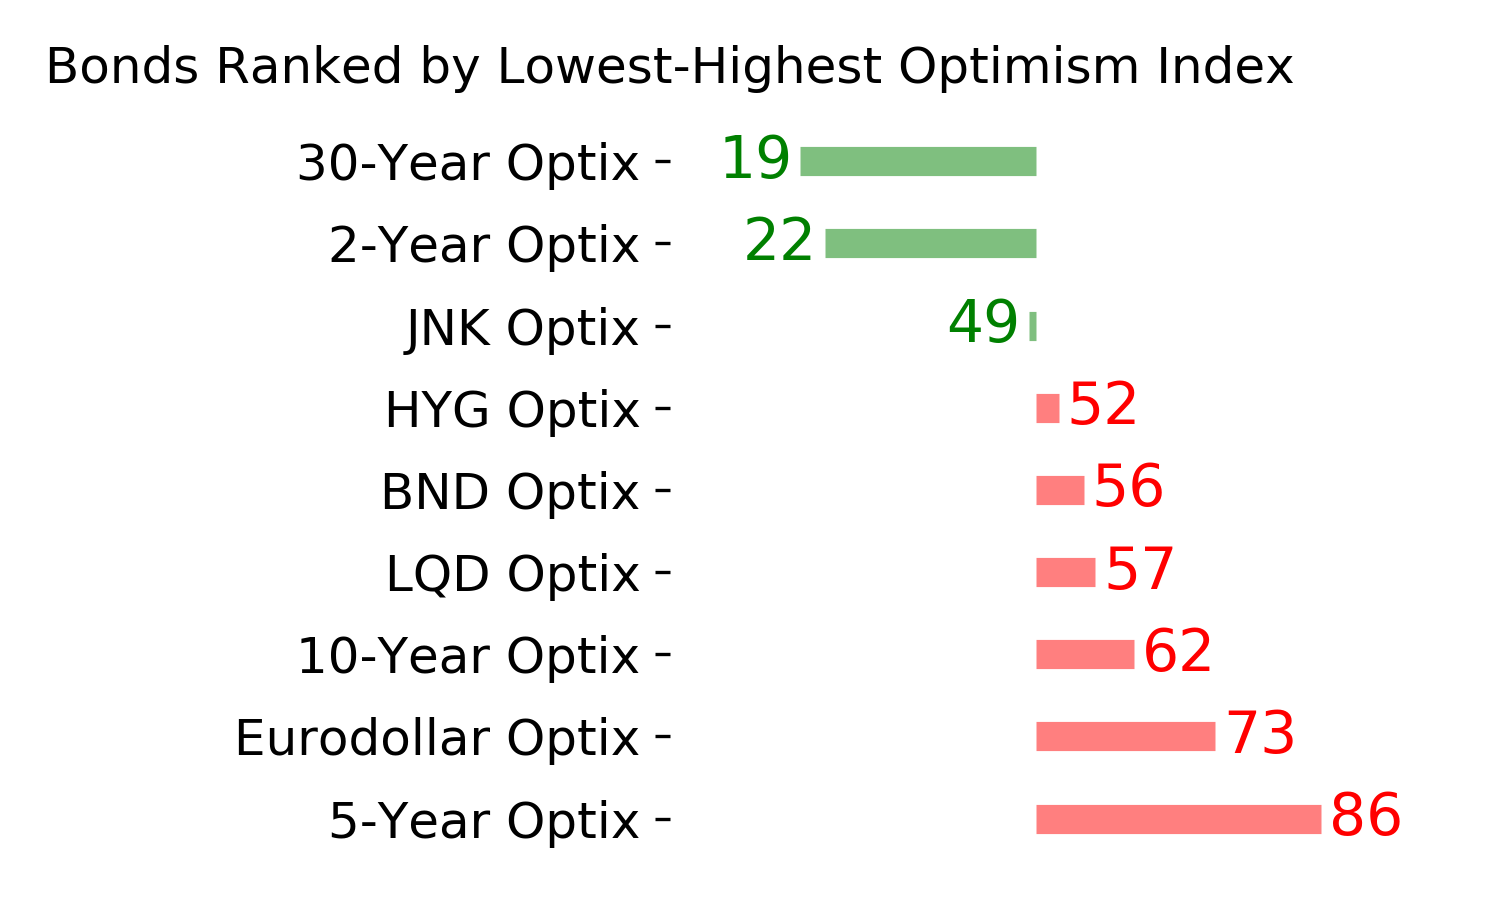
Various parts of the market have been hit in recent weeks, with mild oversold conditions. The Bond Optimism Index is now about as low as it gets during healthy bond market environments. Fixed income isn't responding well, so that needs to be monitored in case it's transitioning to a longer-term negative market environment. GOLD: Weak buy
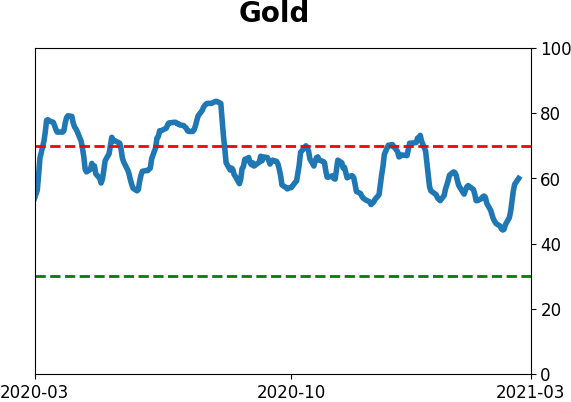
A dollar trying to rebound from a severe short position has weighed on gold and miners. The types of signals they've given in recent weeks, within the context of their recent surge, have usually resulted in higher prices over a medium- to long-term time frame. Like bonds, gold and miners aren't responding very well, and this needs to be monitored.
|
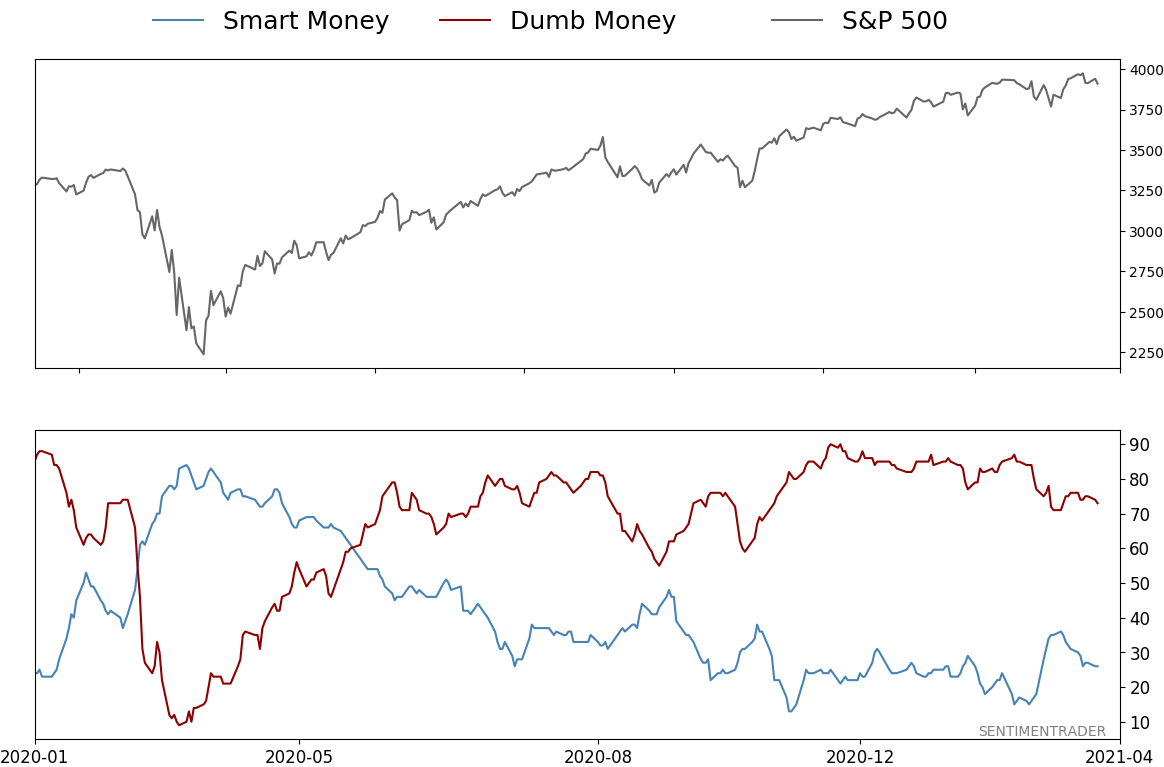
Smart / Dumb Money Confidence
|
Smart Money Confidence: 26%
Dumb Money Confidence: 73%
|
|
Risk Levels
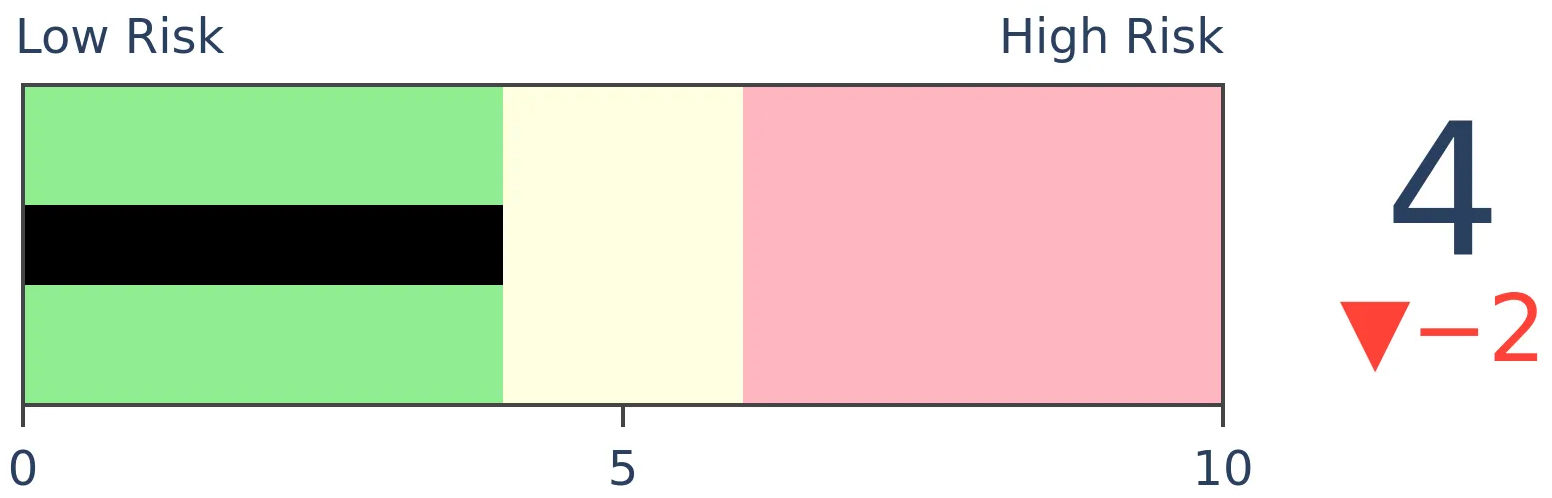
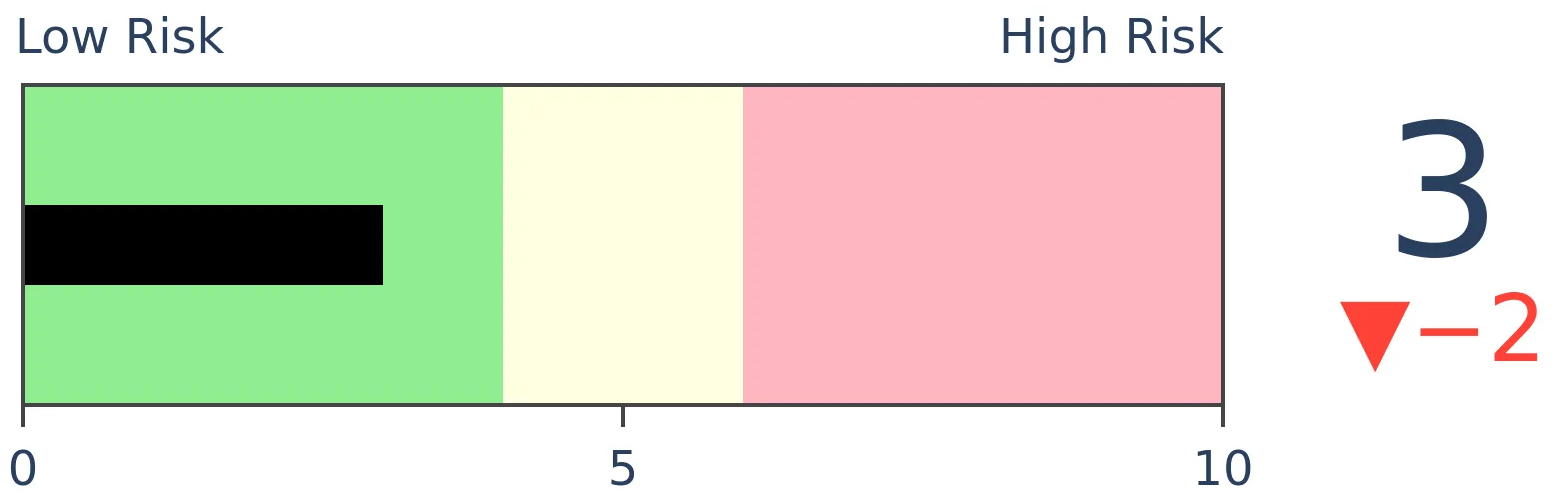
Stocks Short-Term
|
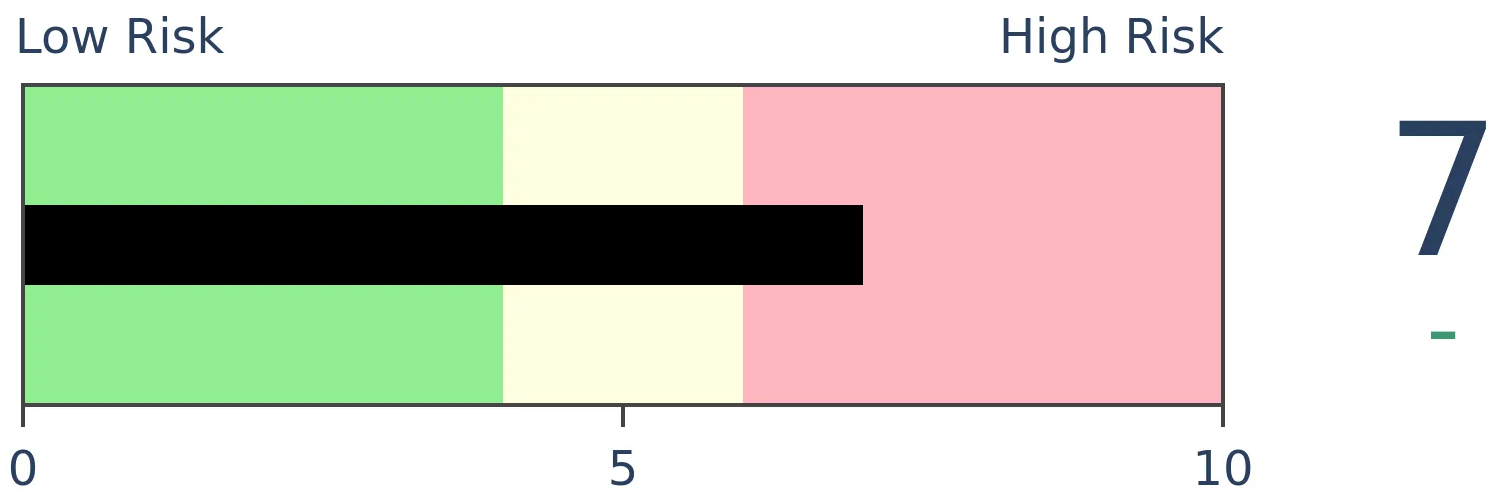
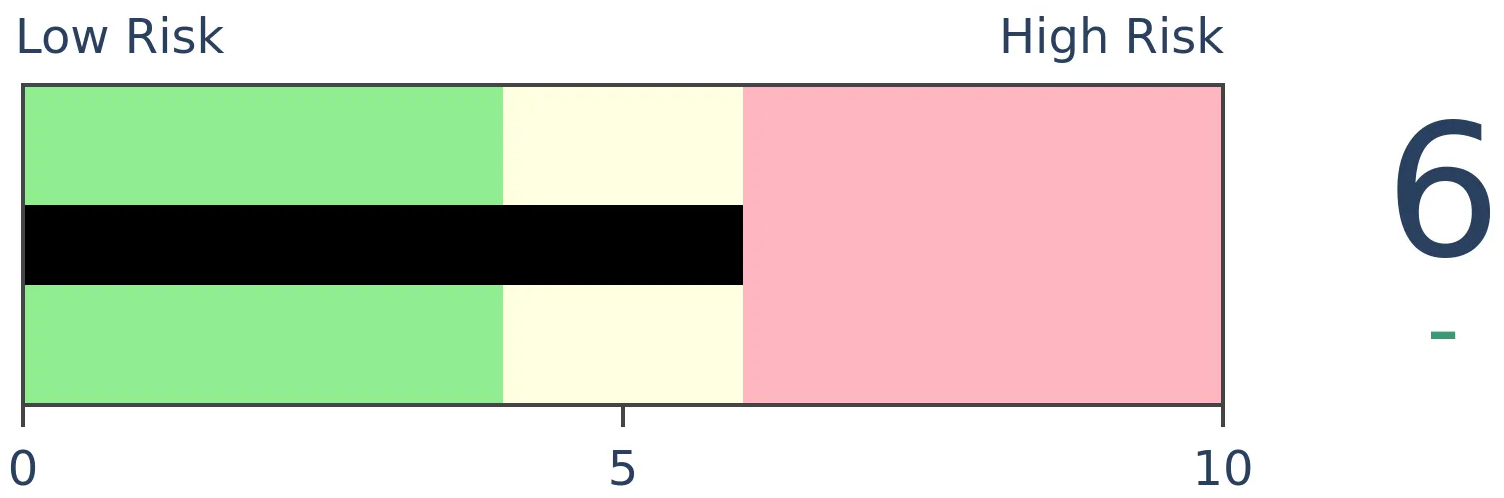
Stocks Medium-Term
|
|
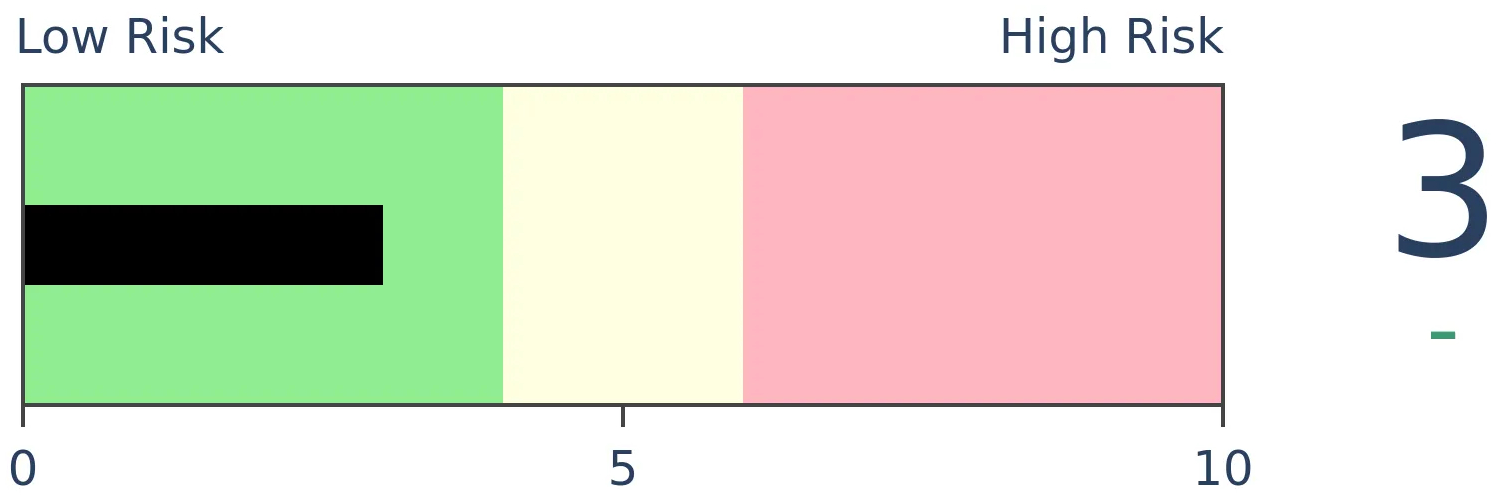
Bonds
|
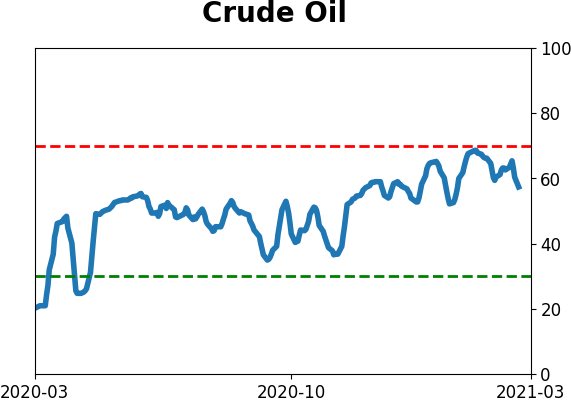
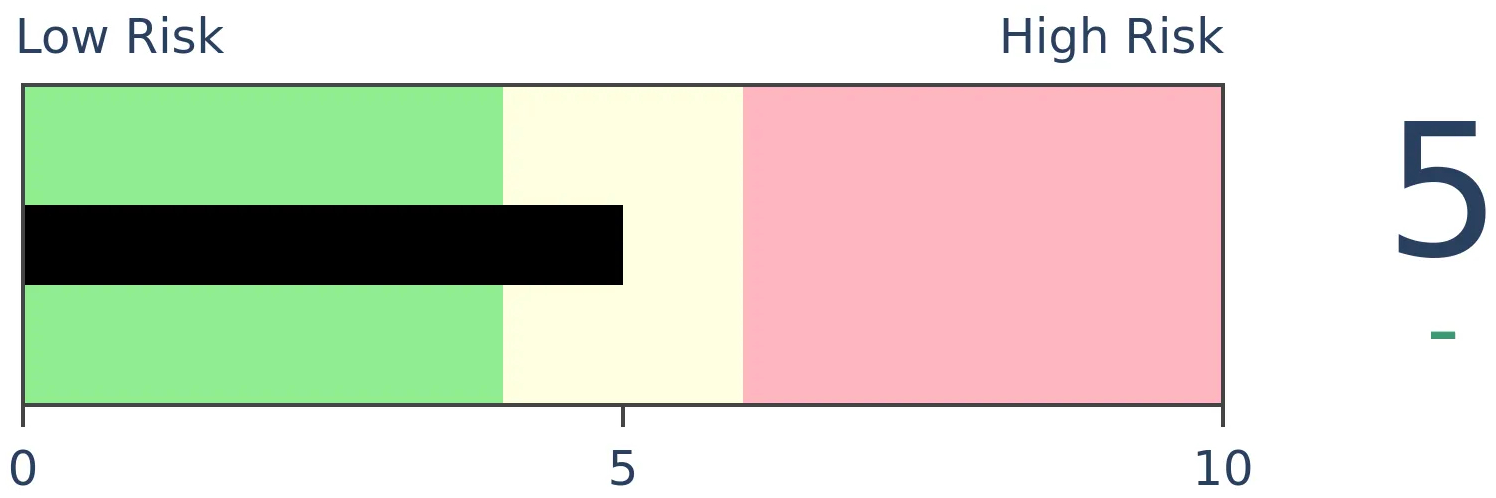
Crude Oil
|
|
Gold
|
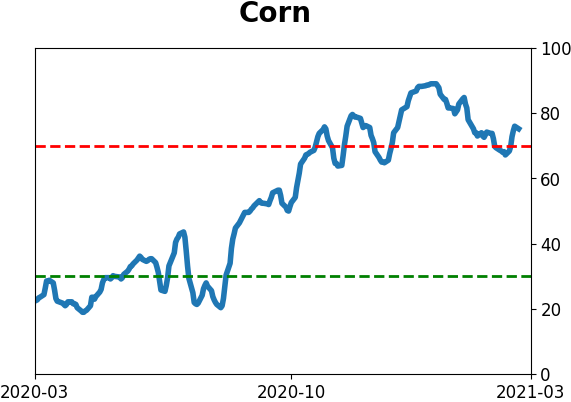
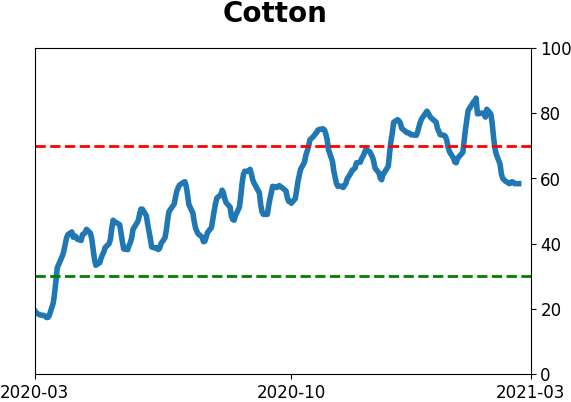
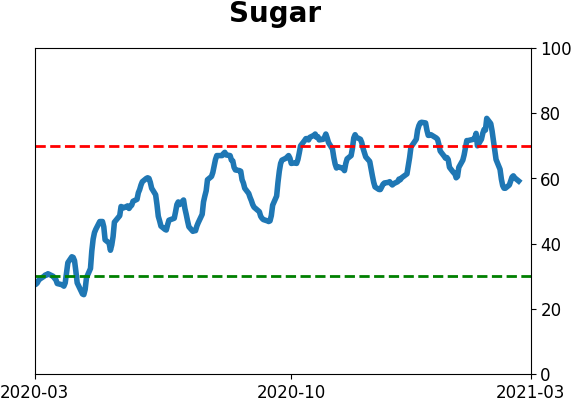
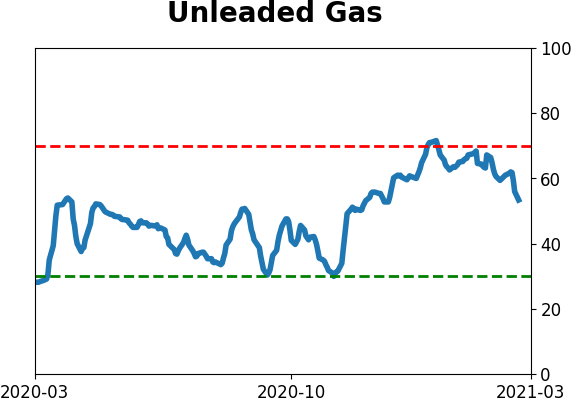
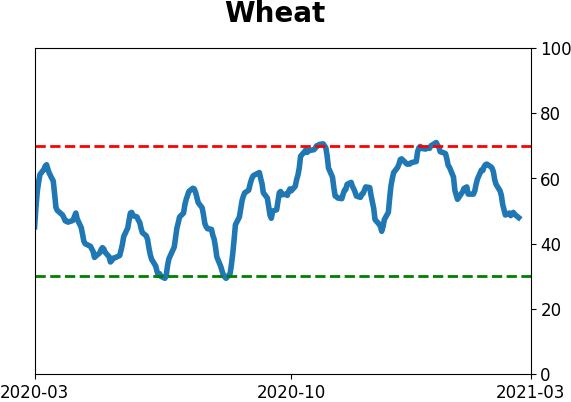
Agriculture
|
|
Research
BOTTOM LINE
In recent days, there have been some signs that corporate bond investors are getting a bit worried. The spread on BBB-rated bonds is rising faster than the spread on AAA-rated ones, something we see during times of rising anxiety.
FORECAST / TIMEFRAME
None
|
Much of the rally in assets over the past few months seems to have been driven by ever-easier financial conditions.
Granted, that is a bit tautological, since rising asset prices help drive financial conditions but the performance of the S&P 500 is only 1 of 9 inputs to the Bloomberg U.S. Financial Conditions Index, for example.
After the spike a year ago, financial conditions have steadily eased. Only lately have they plateaued (or troughed, depending on which index you're looking at).
Part of this is due to changes within the bond market. It's no secret that bonds have gotten shellacked, even corporate bonds. And within that universe, we're just now seeing the spread between the lowest-rated investment-grade corporate bonds rising faster than that of the highest-rated bonds. This suggests that credit investors are starting to get just a bit nervous.
There could be other reasons, like outlooks for taxes rates, liquidity, sales geography, etc., that are influencing this, but generally, we can assume that when the spread between lower-quality and high-quality bonds is rising, it's during times of rising anxiety. The chart below shows this clearly (note that the scale on the spread is inverted).
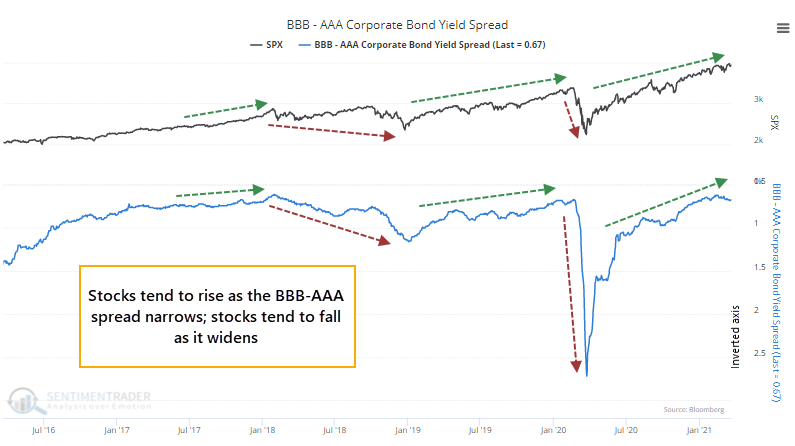
For the first time in almost a year, spreads on riskier bonds are starting to rise compared to spreads on the safest ones. It had been more than 200 days since the 50-day average of the spread was rising, ending the 3rd-longest streak in 25 years.
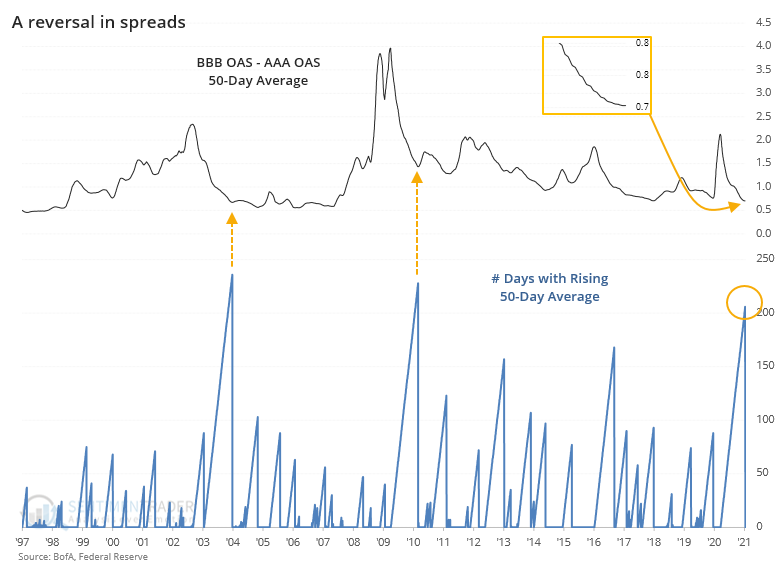
When the 50-day average of this difference in spreads first started to rise after more than 90 days of declining, it wasn't necessarily a sell signal for stocks. Returns over the medium-term were mediocre, about in line with random. Thanks to the overall rising trend over the study period, longer-term returns were good.
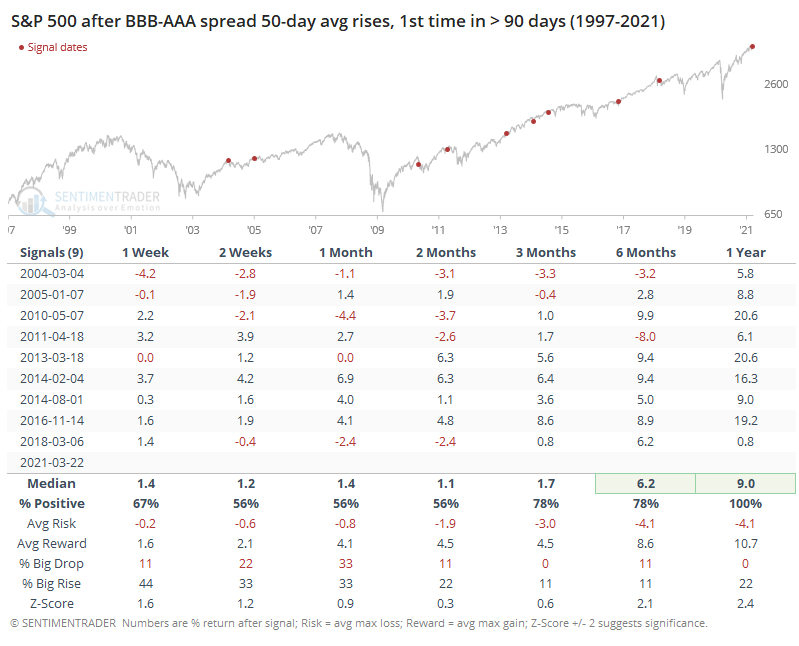
After the ends of the two other 200+ day streaks, in March 2004 and May 2010, the S&P did struggle more over the ensuing weeks and months. Those time frames also lined up with what had been protracted extremes in optimistic sentiment like we're seeing now.
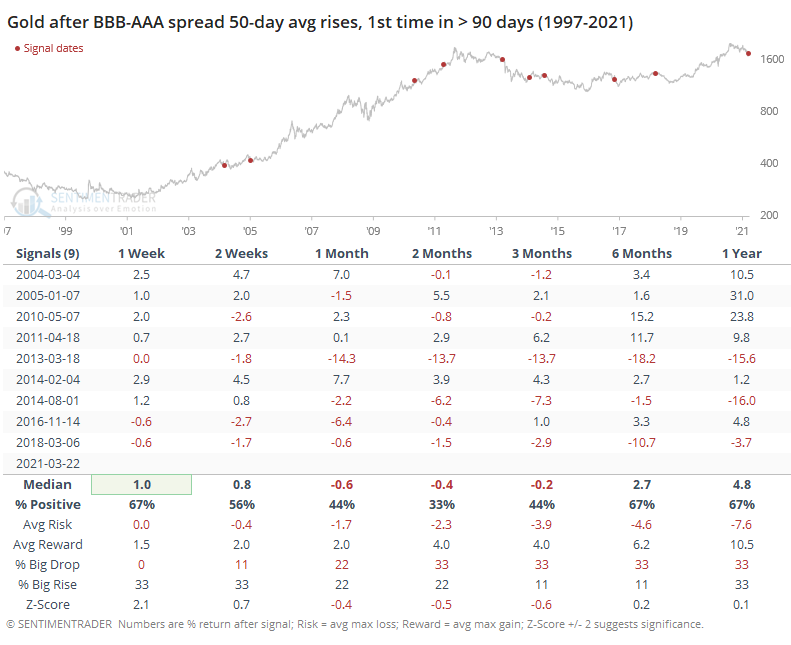
It might be assumed that if credit investors were becoming more nervous, then they might bid up some safe-haven assets. Gold, however, did not react well.
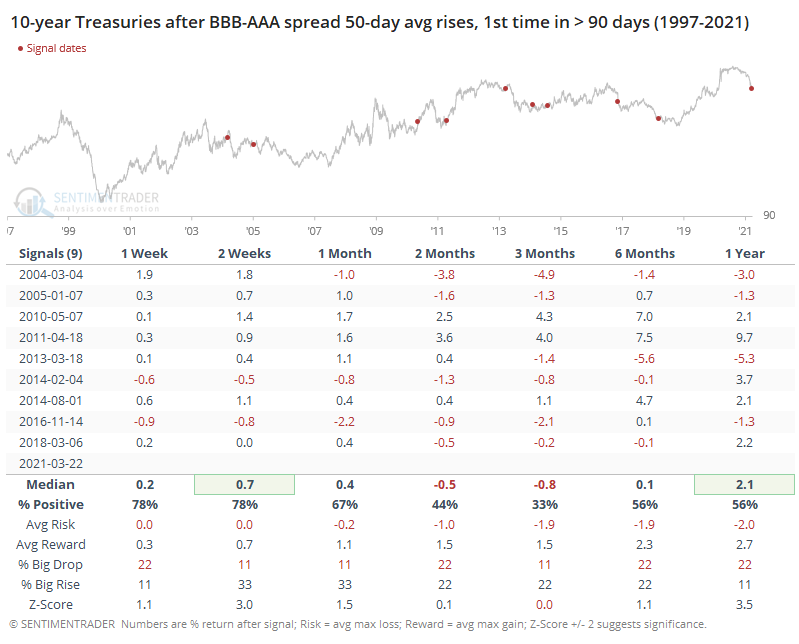
There also wasn't much of a flight-to-safety response in Treasuries.
The idea that credit investors seem to be getting a tad more nervous, as we're in the midst of one of the most protracted bouts of extremely optimistic sentiment in over 20 years, is a modest worry. It's not like spreads are blowing out, and the other two times we saw a similar situation, stocks only declined modestly. It's just another indication that the risk/reward for riskier assets isn't all that great right now.
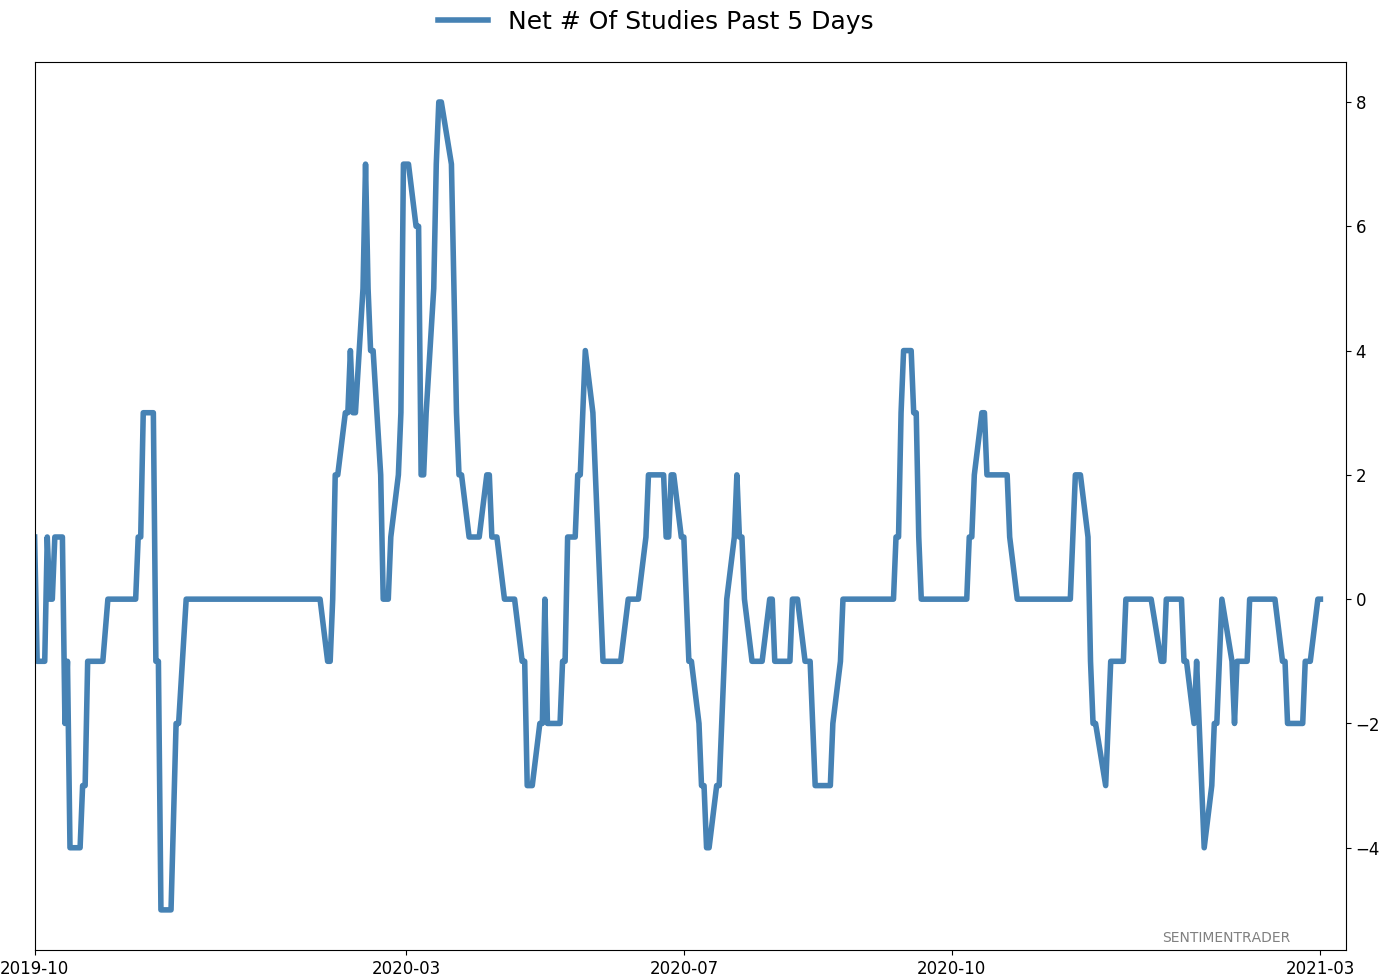
Active Studies
| Time Frame | Bullish | Bearish | | Short-Term | 0 | 0 | | Medium-Term | 2 | 10 | | Long-Term | 16 | 4 |
|
Indicators at Extremes
Portfolio
| Position | Description | Weight % | Added / Reduced | Date | | Stocks | RSP | 4.9 | Reduced 4% | 2021-02-09 | | Bonds | 30.0% BND, 8.8% SCHP | 38.8 | Added 15.1% | 2021-02-18 | | Commodities | GCC | 2.3 | Reduced 2.1%
| 2020-09-04 | | Precious Metals | GDX | 9.0 | Added 0.1% | 2021-02-18 | | Special Situations | 7.3% XLE, 4.8% PSCE | 12.1 | Reduced 5.6% | 2021-02-18 | | Cash | | 32.8 | | |
|
Updates (Changes made today are underlined)
With a market that has seen the kinds of broad participation and big breath thrusts like we did in the fall, it's hard to become too negative. Those kinds of conditions have consistently preceded higher returns over the next 6-12 months. It's the interim that's more of an issue. Even conditions like that haven't prevented some shorter-term pullbacks. And when we combine an environment where speculation is rampant and recent days have seen an increase in cracks under the surface of the indexes, it's enough to become more defensive over a short- to medium-term time frame. We still don't have much confirmation from the price action in the indexes, so those who are more conservative would likely wait before increasing cash levels. I've decreased risk exposure a bit more, mainly in terms of energy stocks and the ANGL fund, while adding more to the broader bond market. RETURN YTD: 5.1% 2020: 8.1%, 2019: 12.6%, 2018: 0.6%, 2017: 3.8%, 2016: 17.1%, 2015: 9.2%, 2014: 14.5%, 2013: 2.2%, 2012: 10.8%, 2011: 16.5%, 2010: 15.3%, 2009: 23.9%, 2008: 16.2%, 2007: 7.8%
|
|
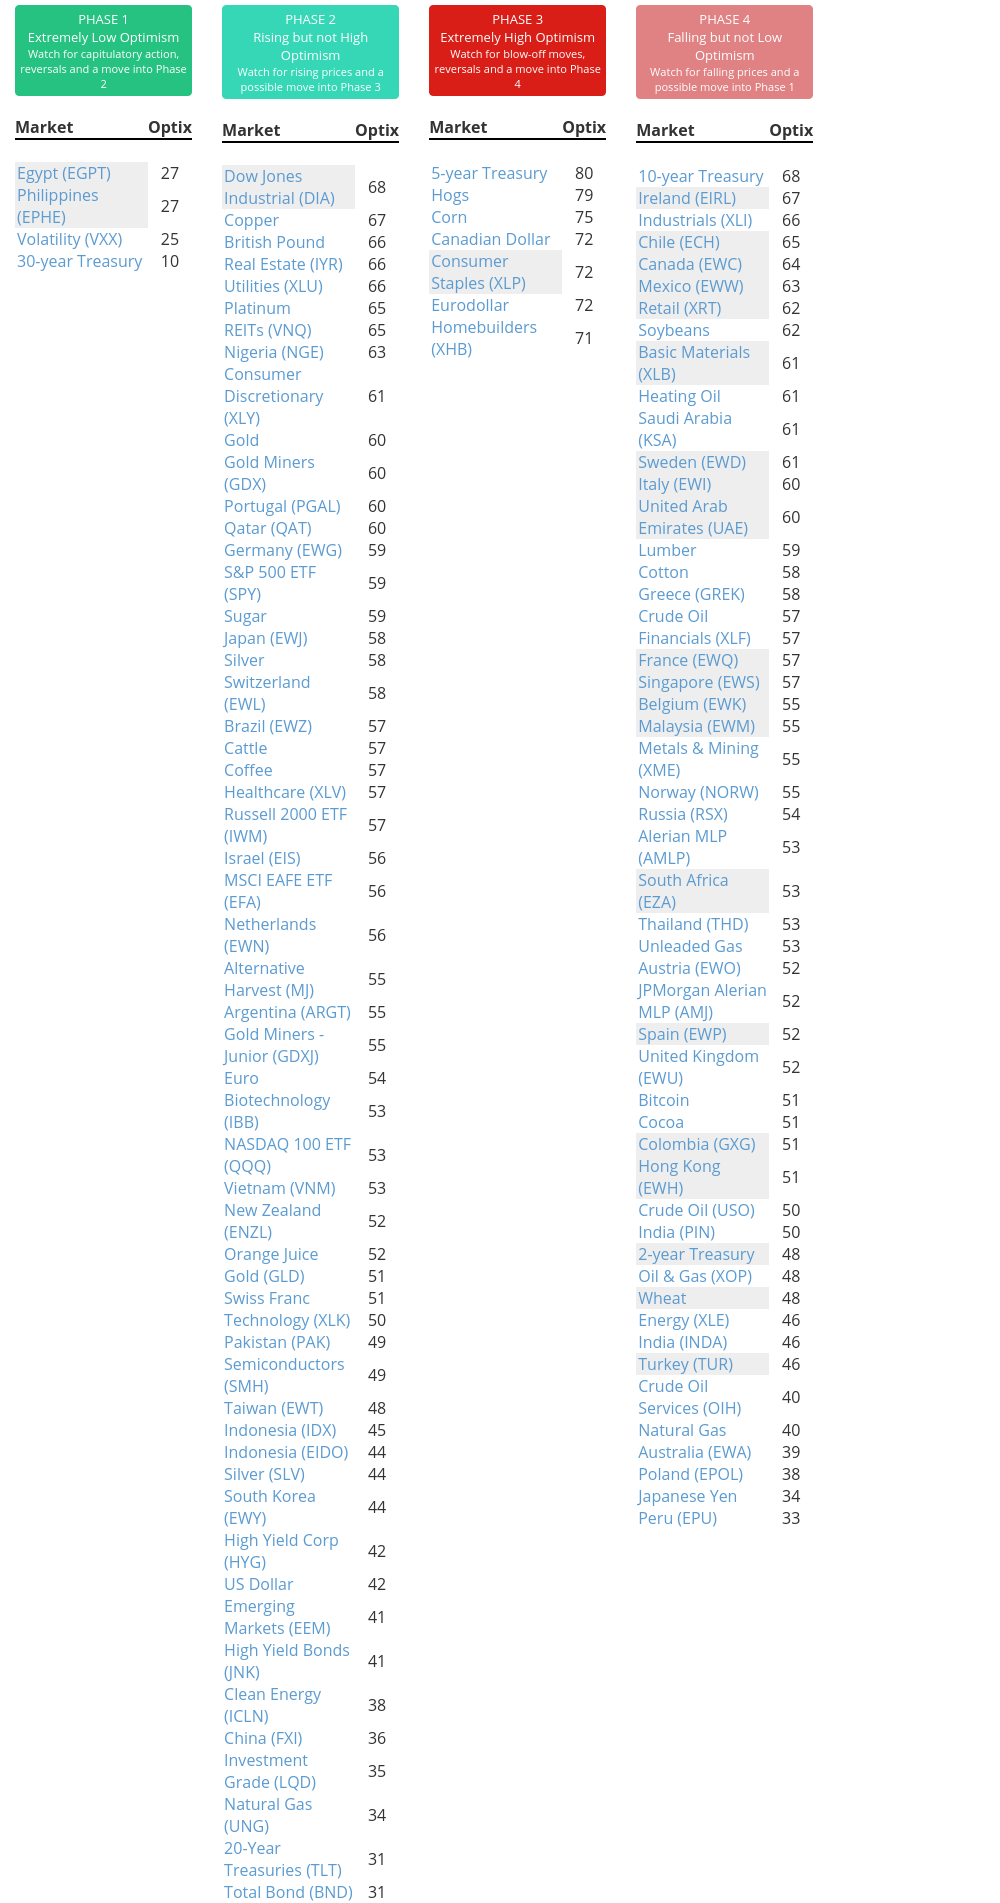
Phase Table
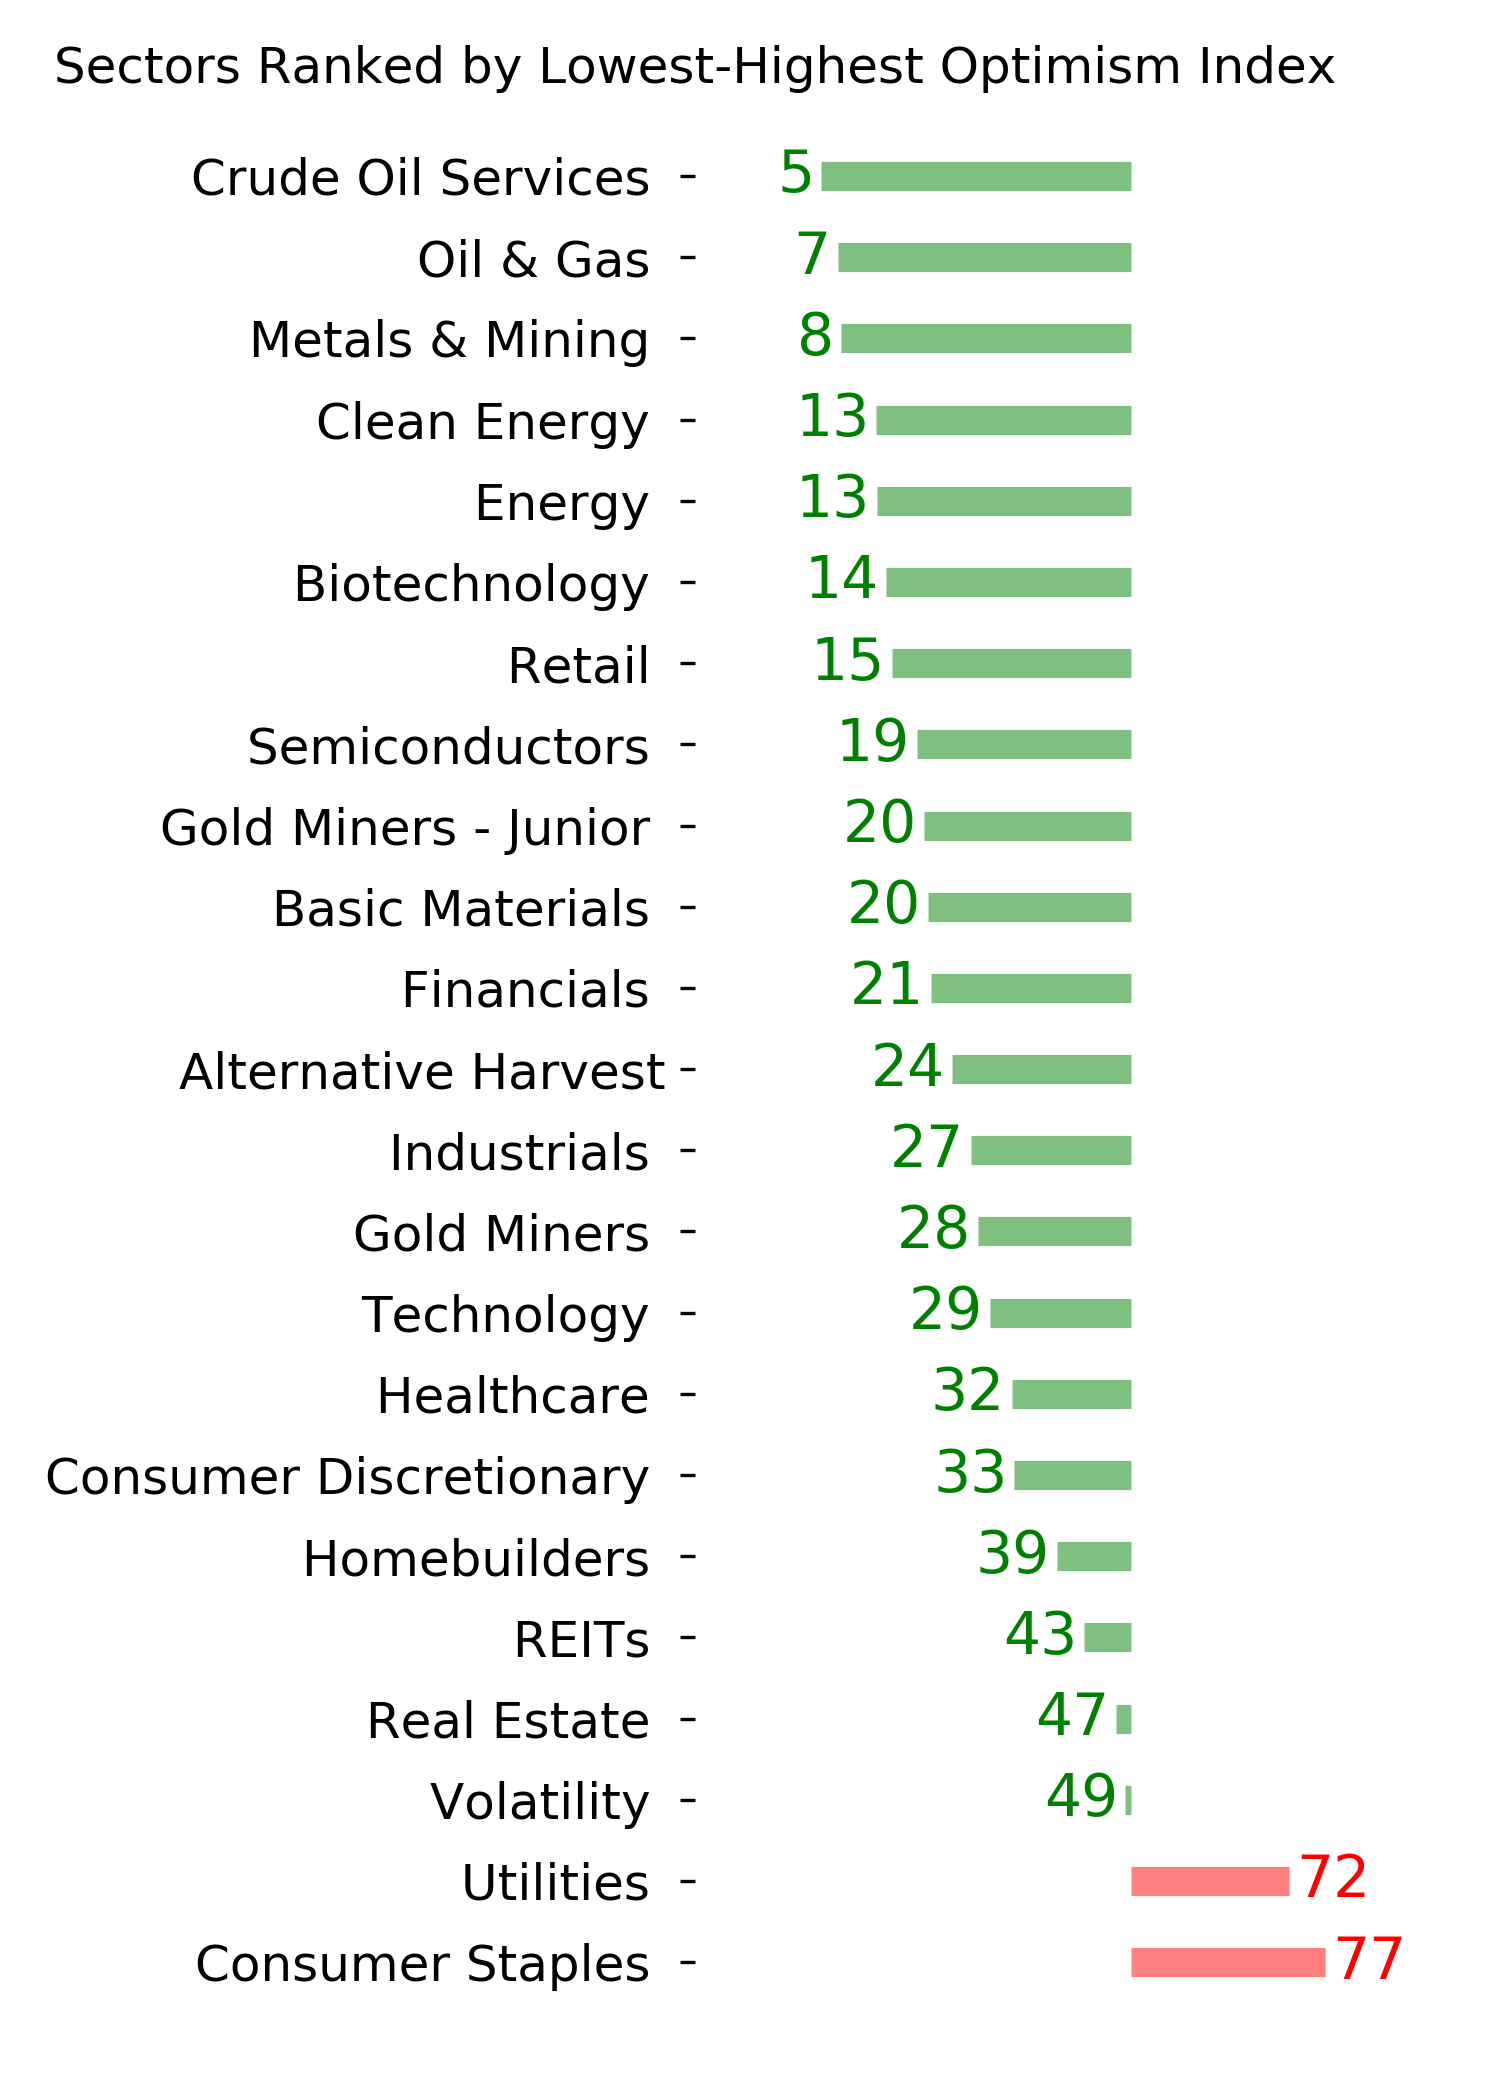
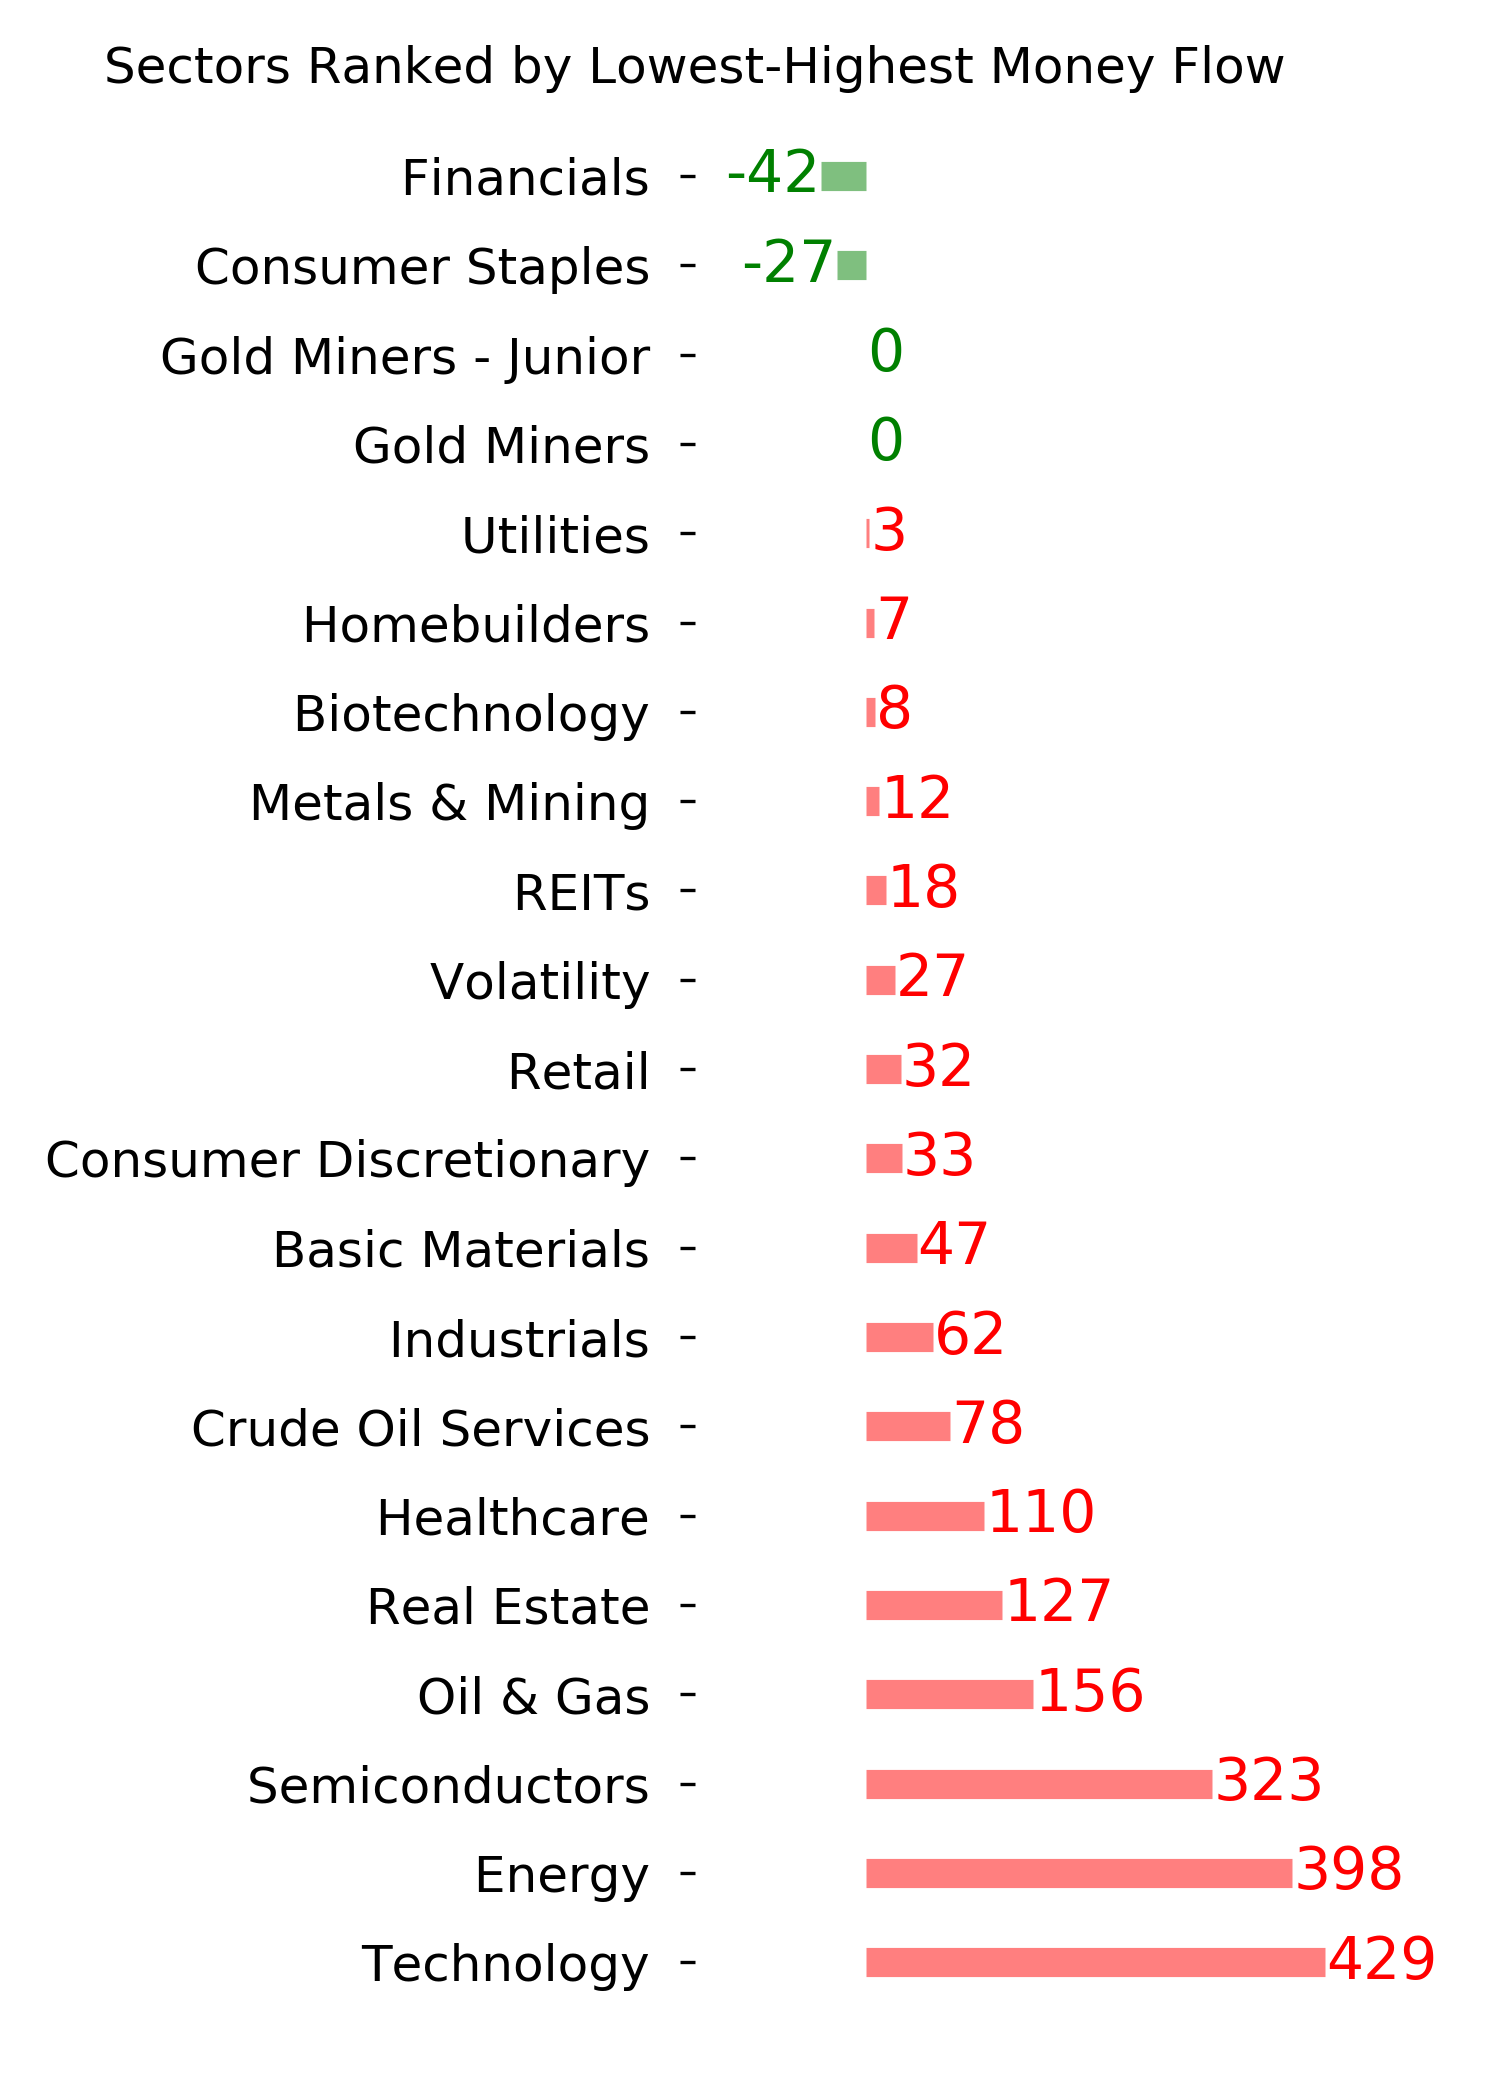
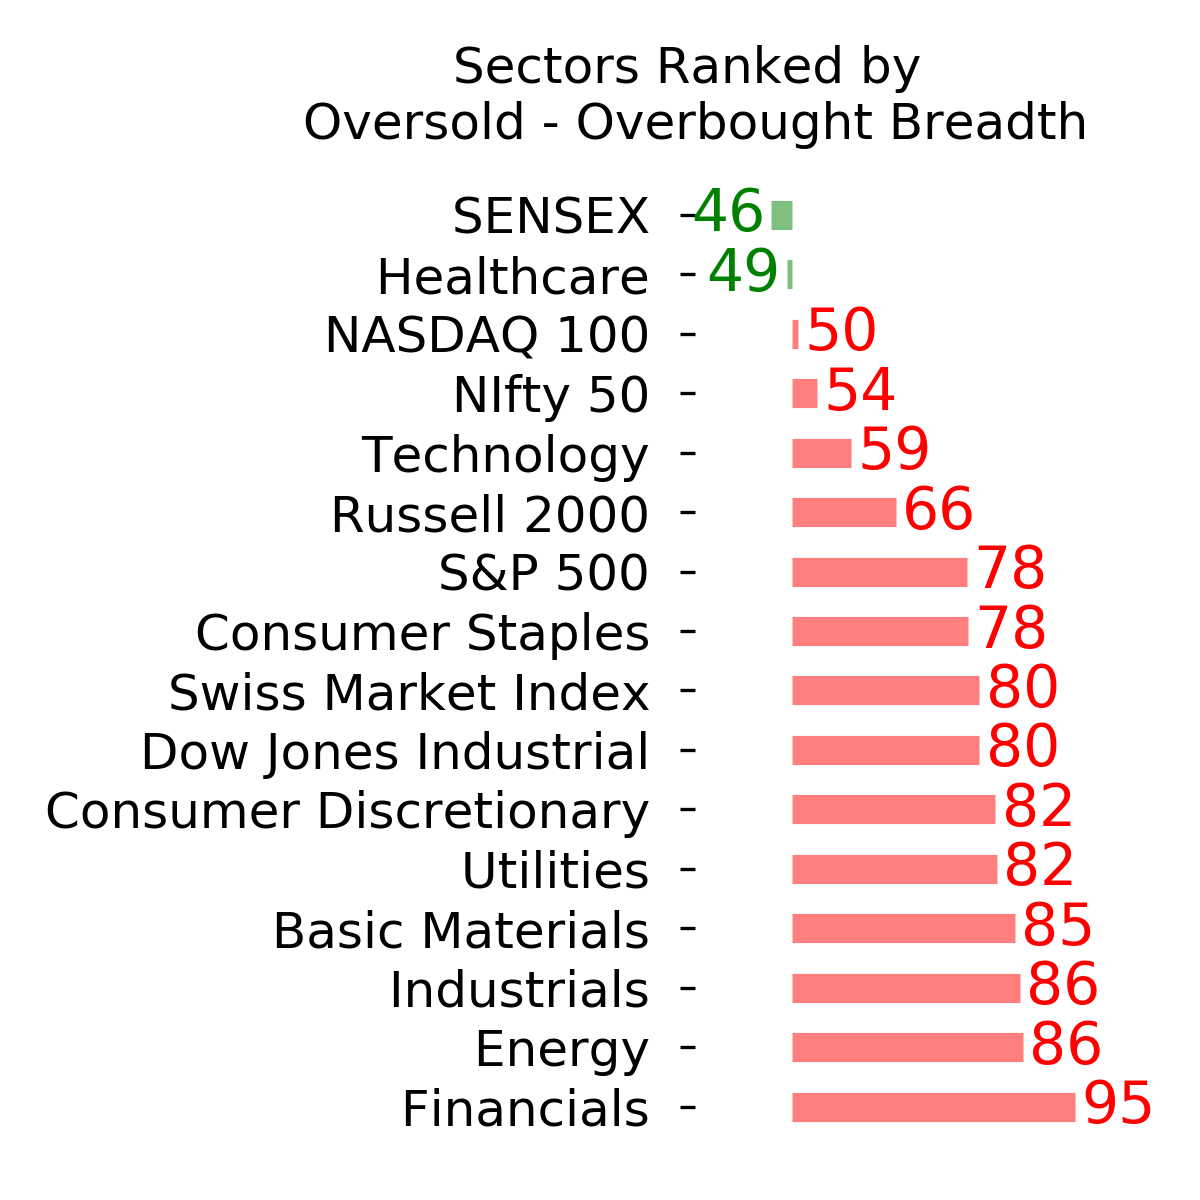
Ranks
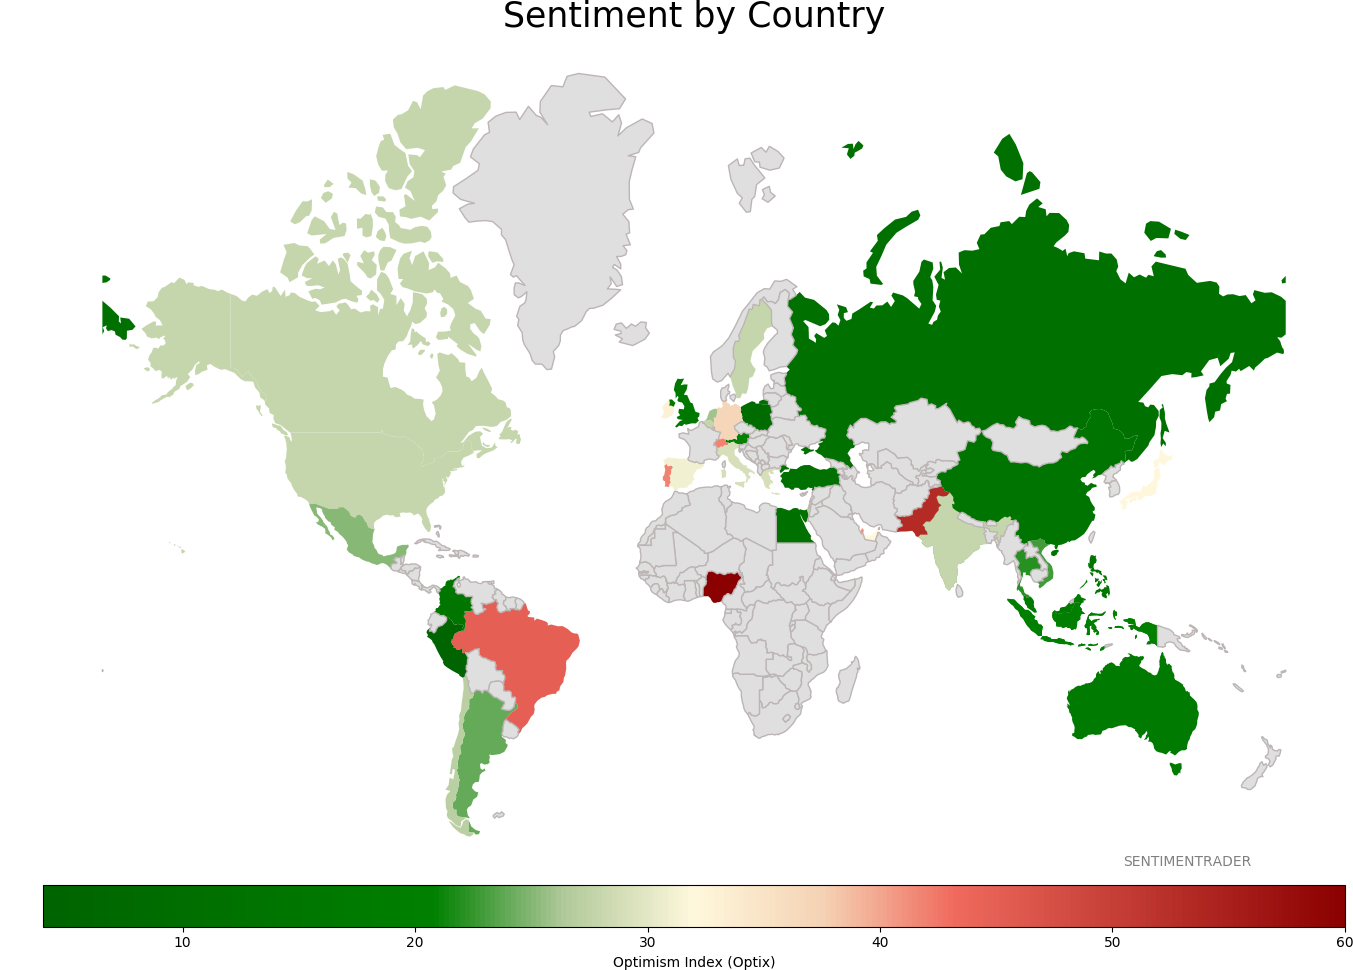
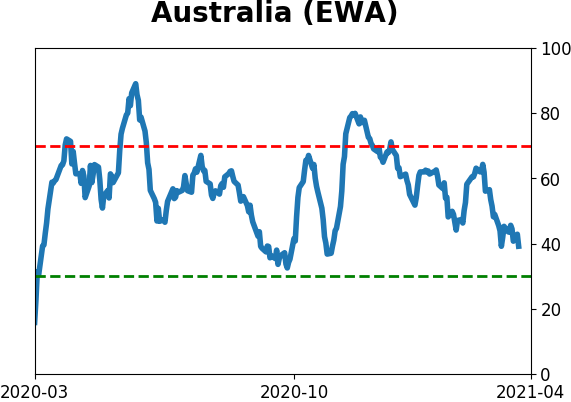
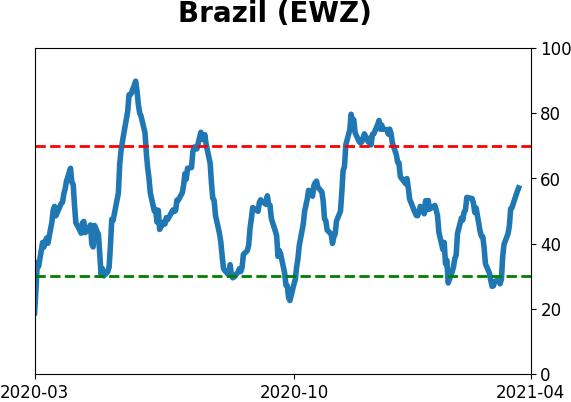
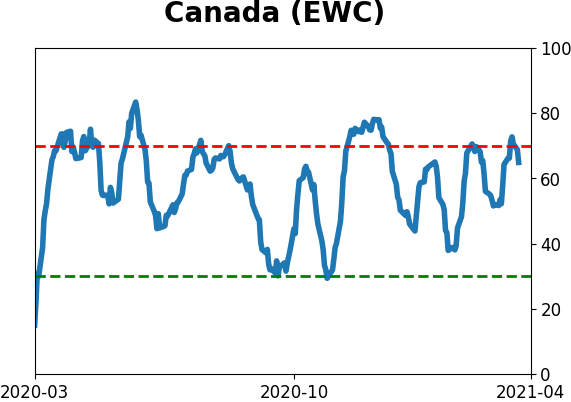
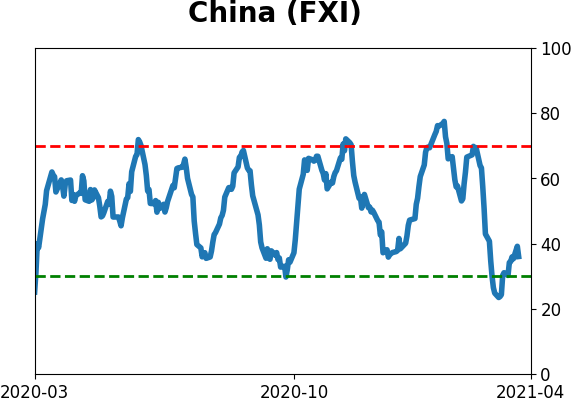
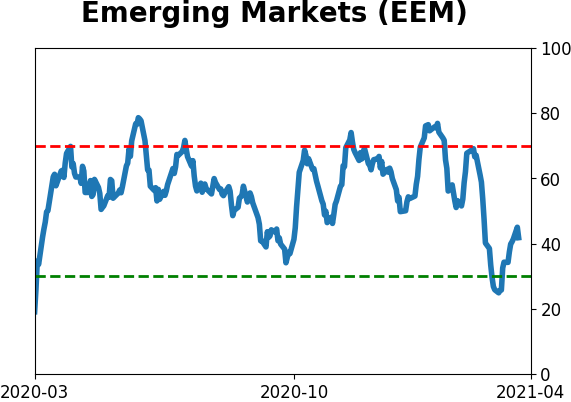
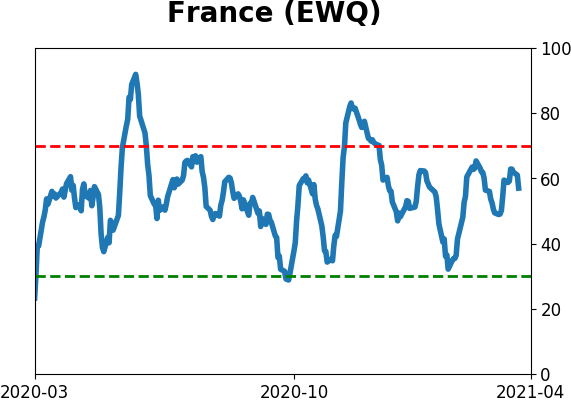
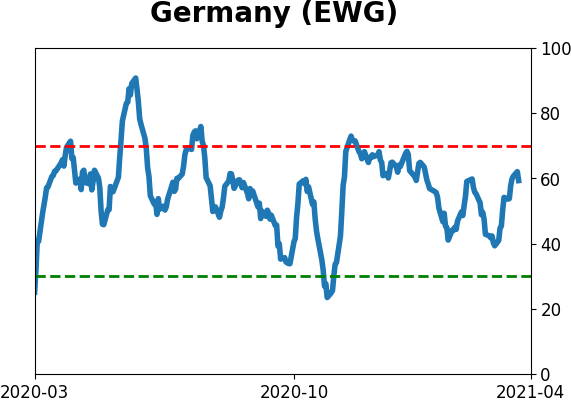
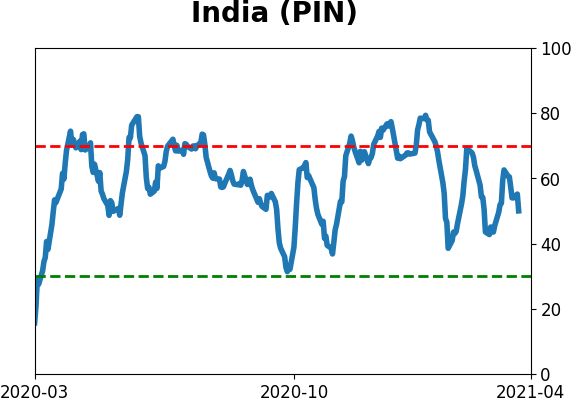
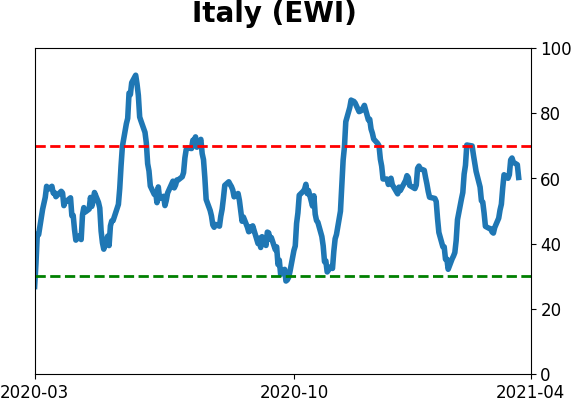
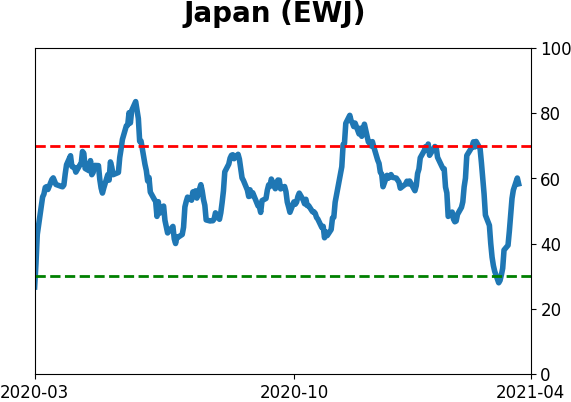
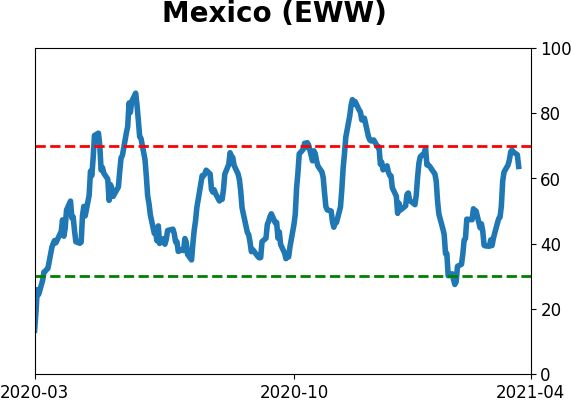
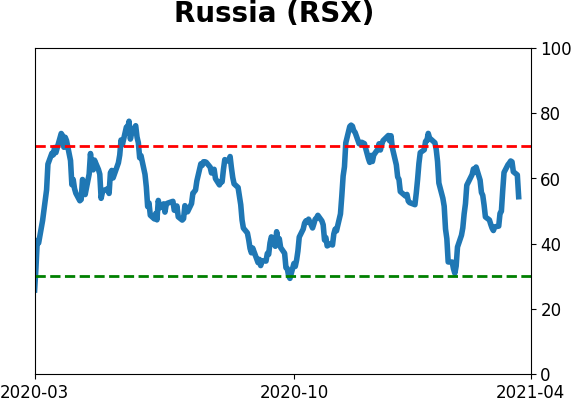
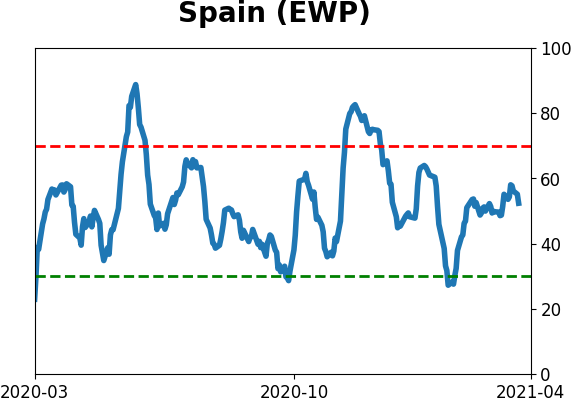
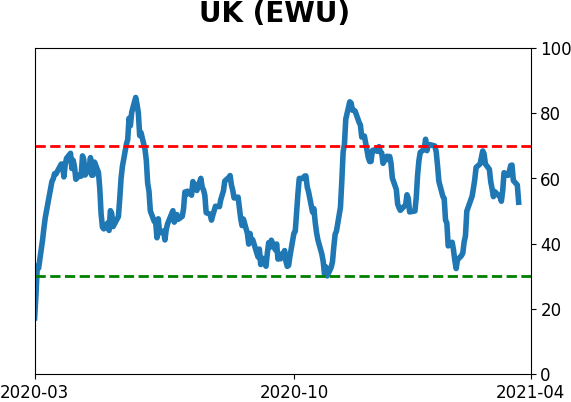
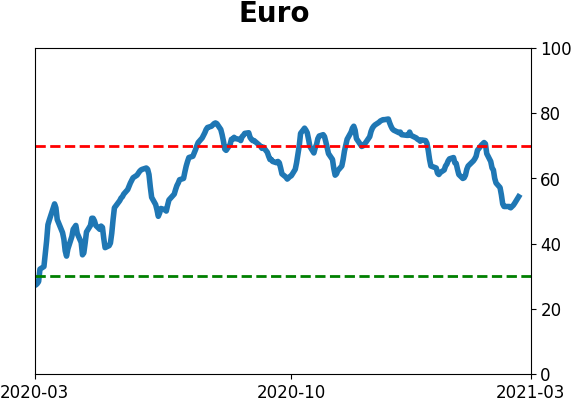
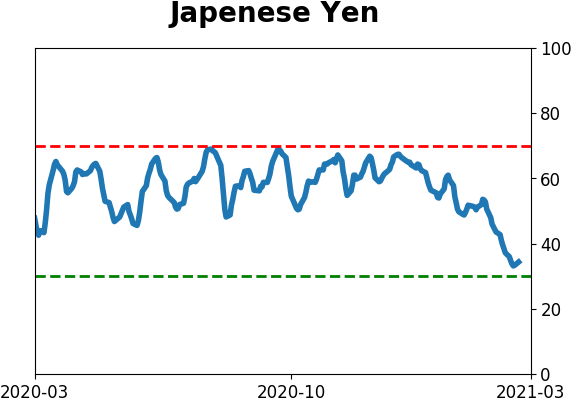
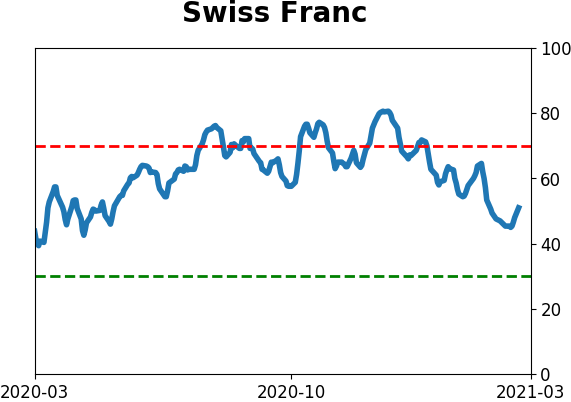
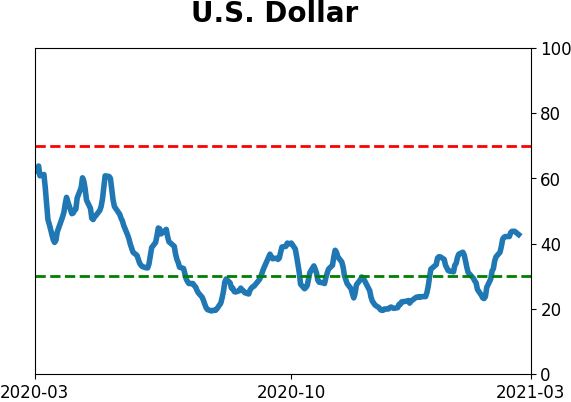
Sentiment Around The World
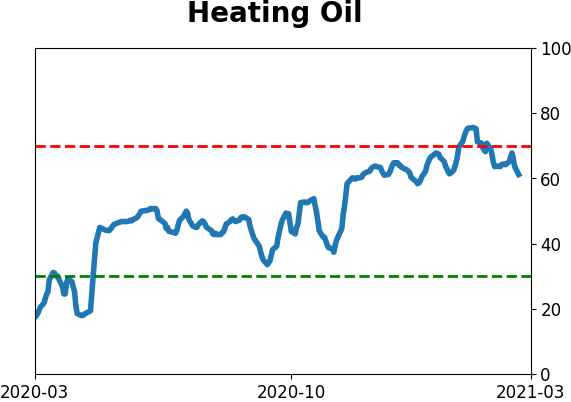
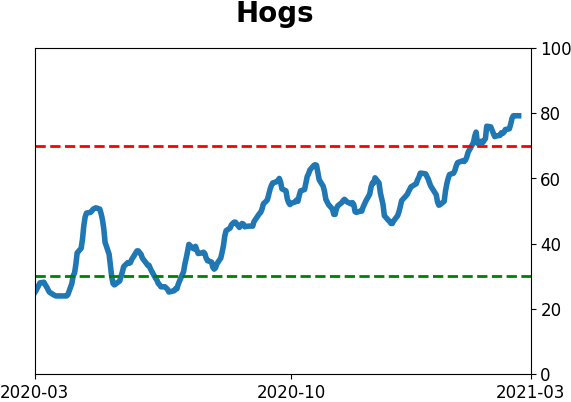
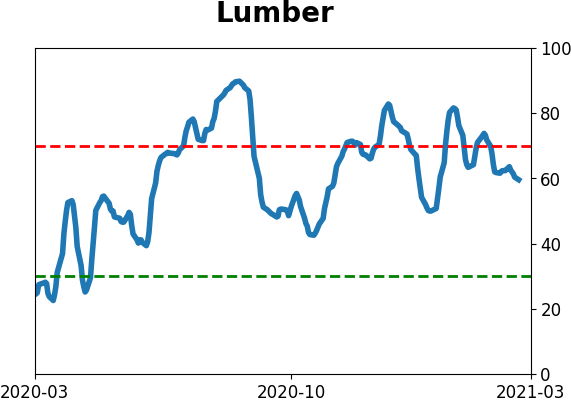
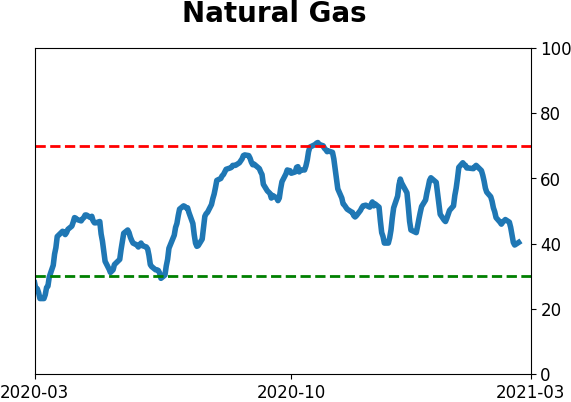
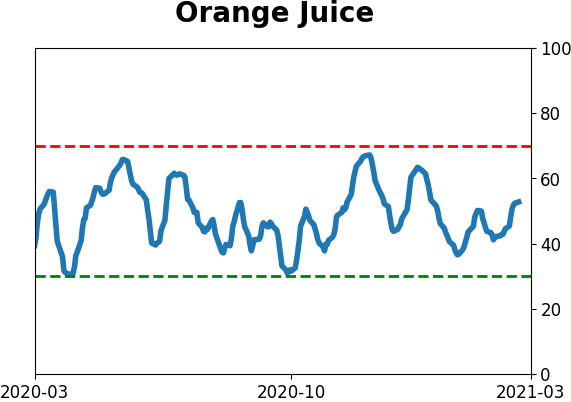
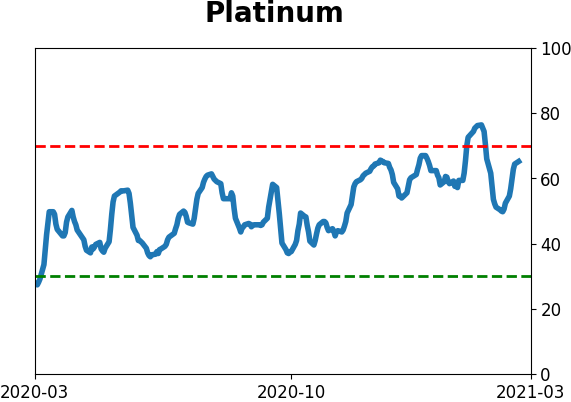
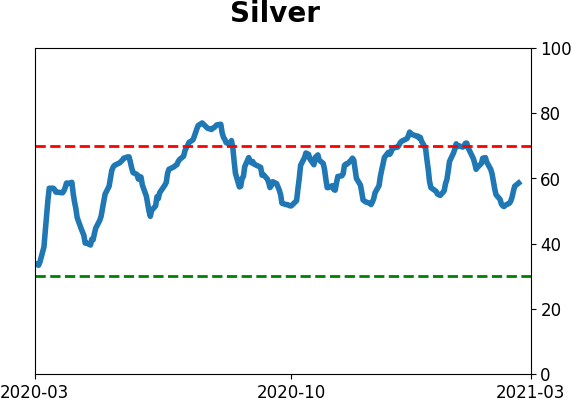
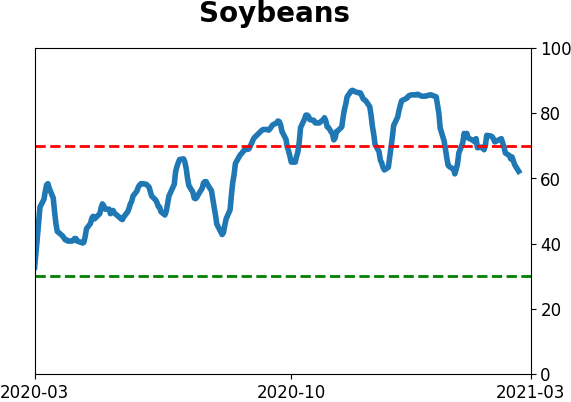
Optimism Index Thumbnails
|
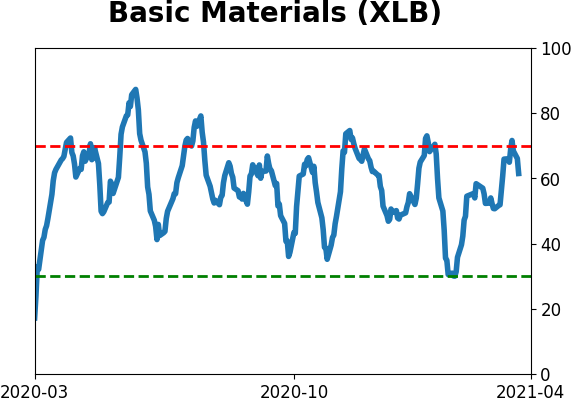
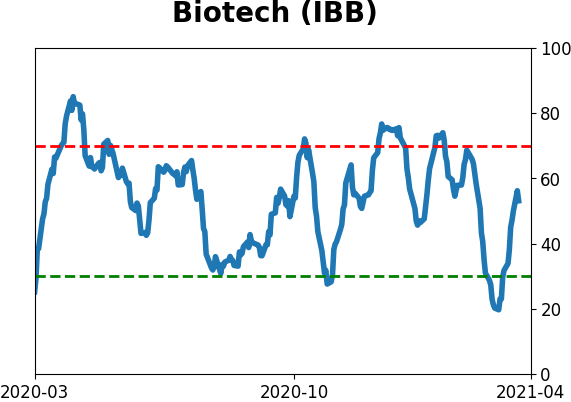
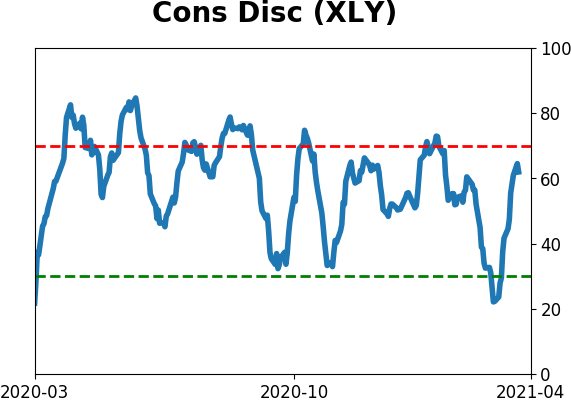
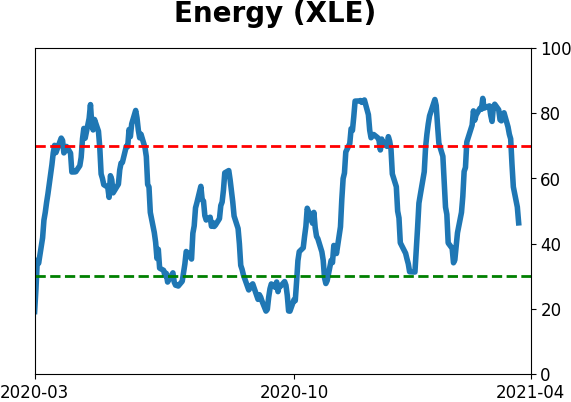
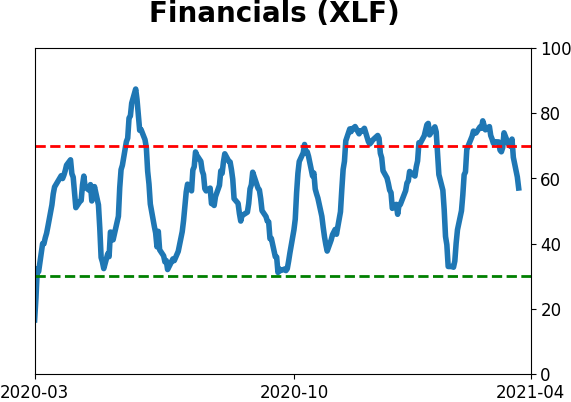
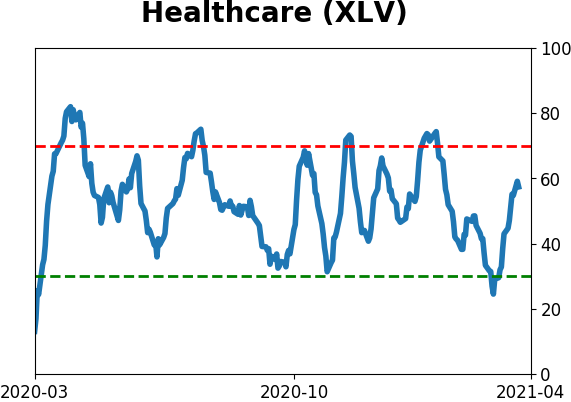
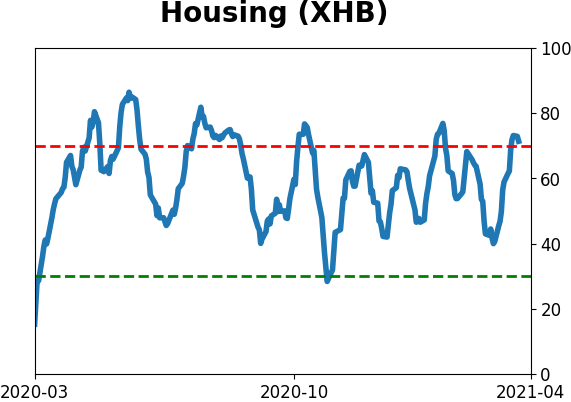
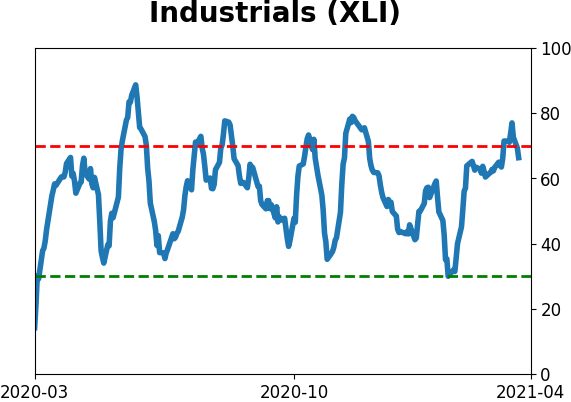
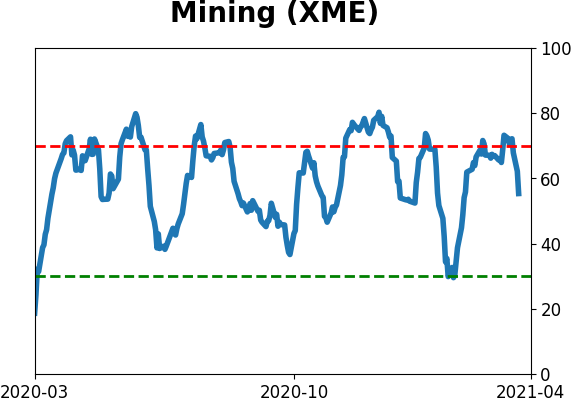
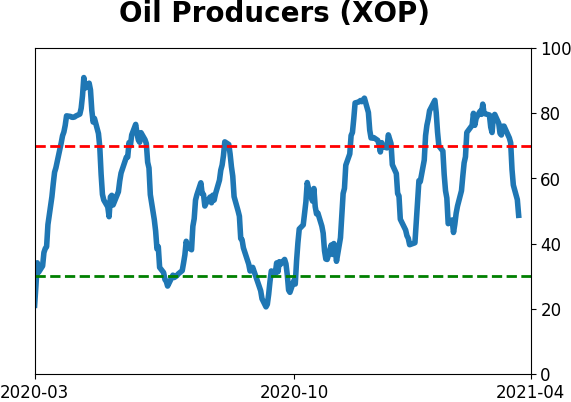
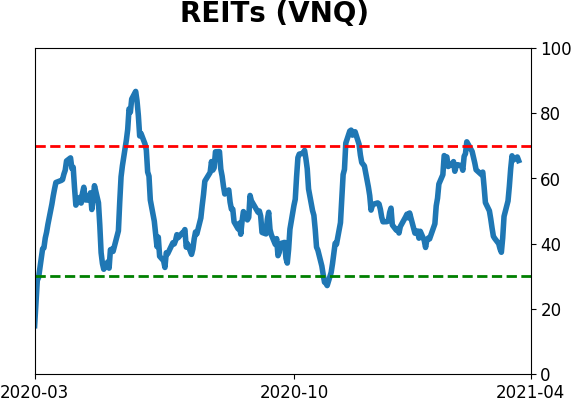
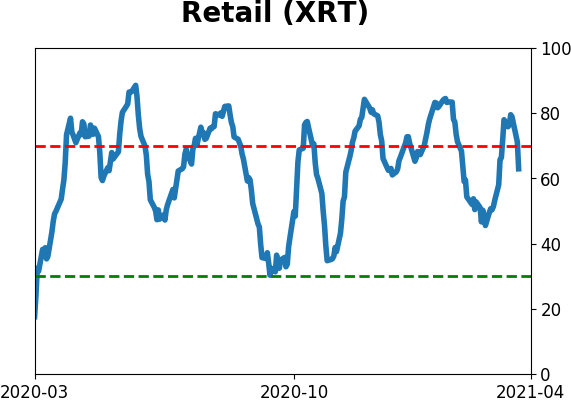
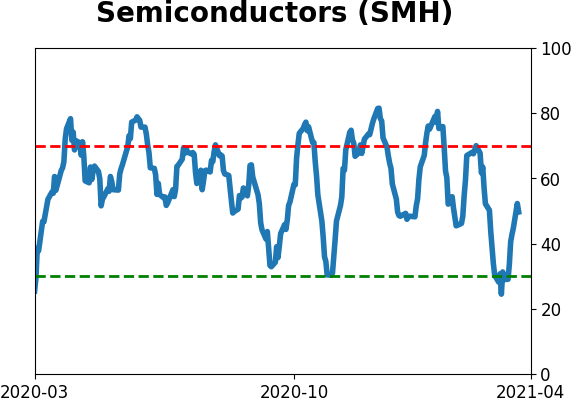
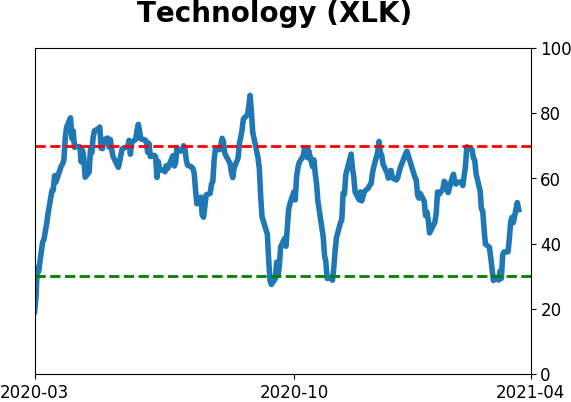
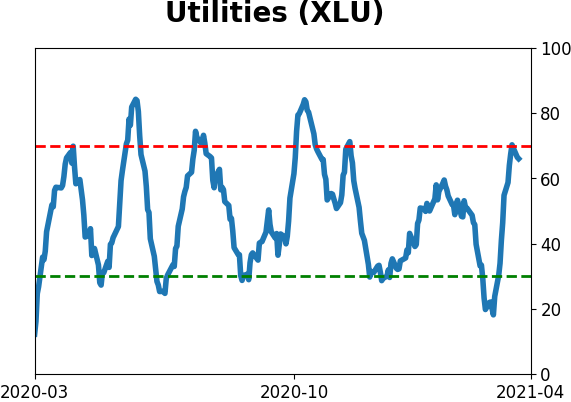
Sector ETF's - 10-Day Moving Average
|
|
|
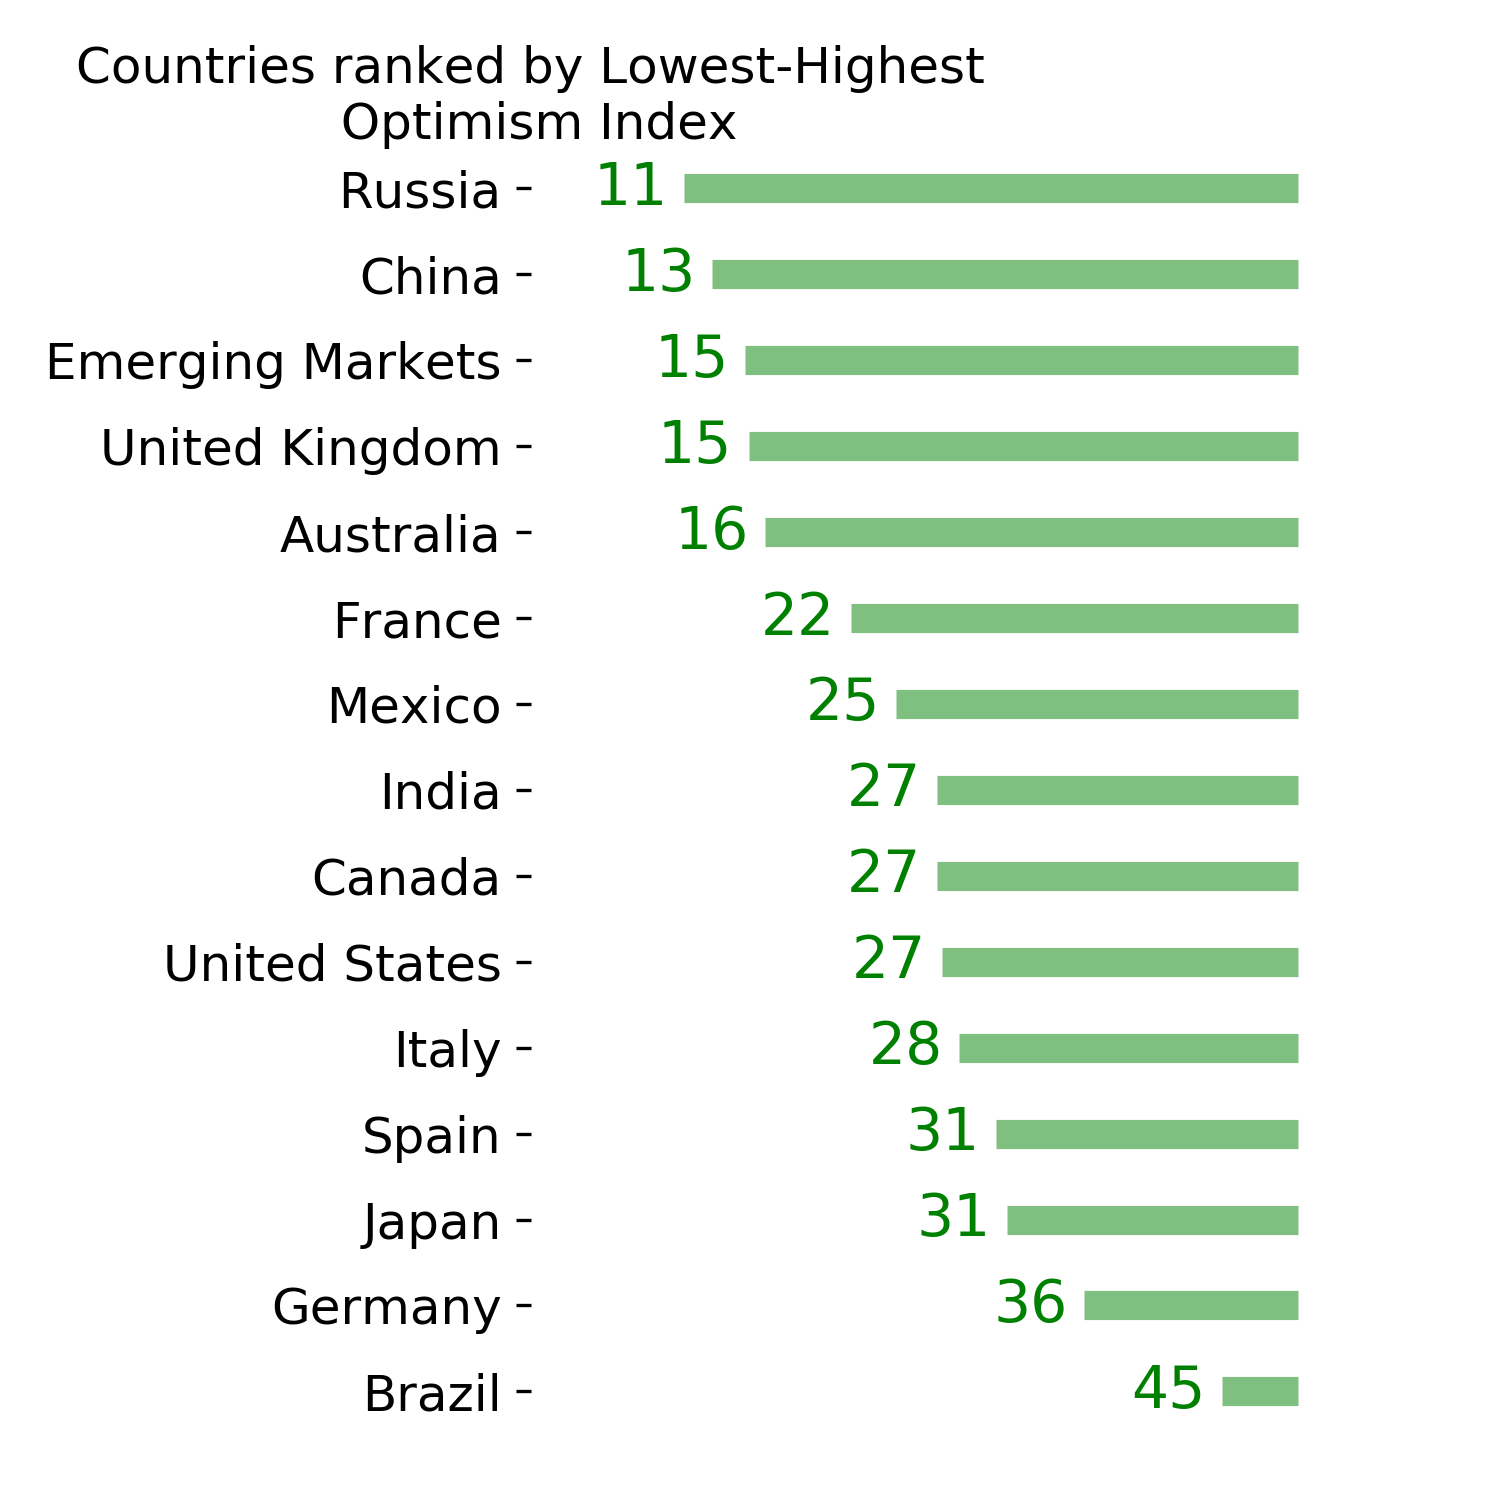
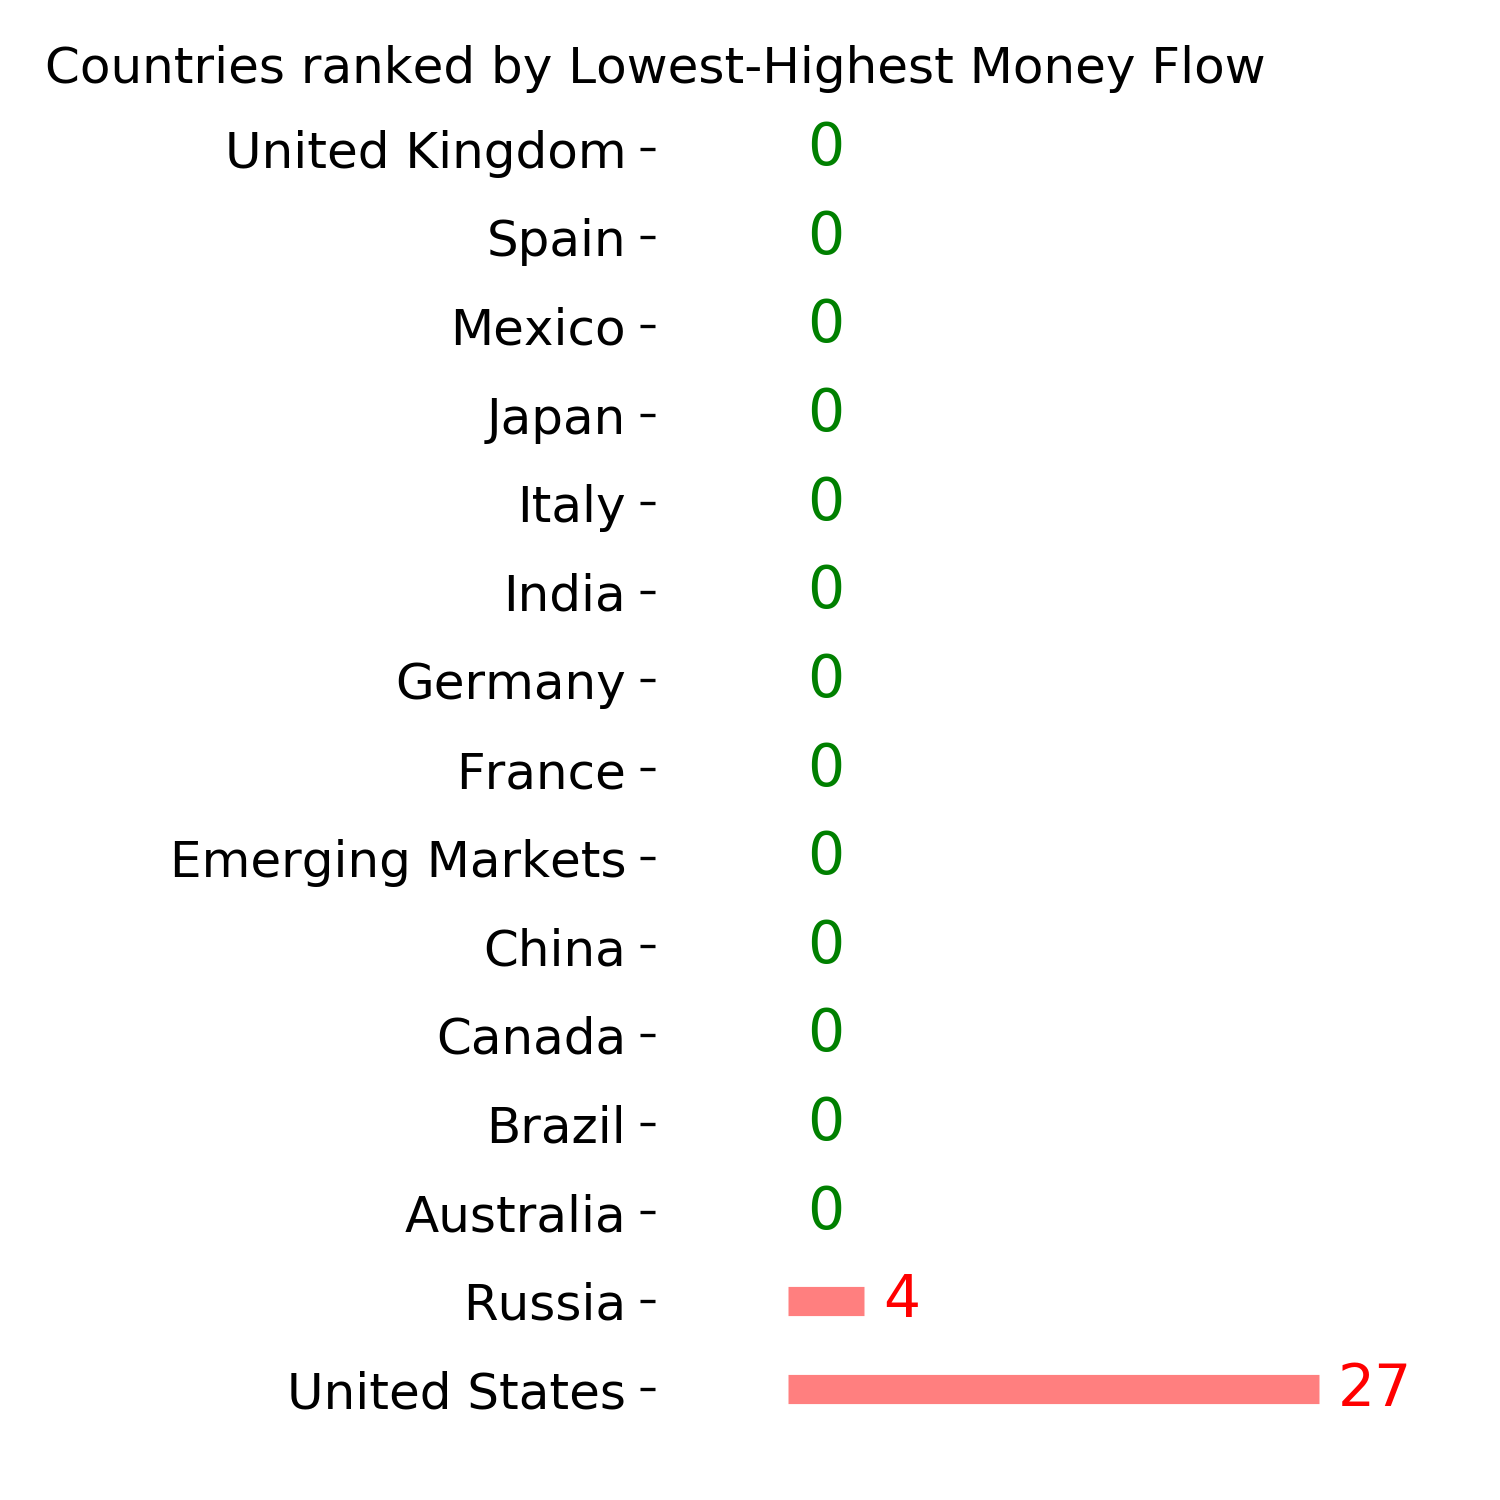
Country ETF's - 10-Day Moving Average
|
|
|
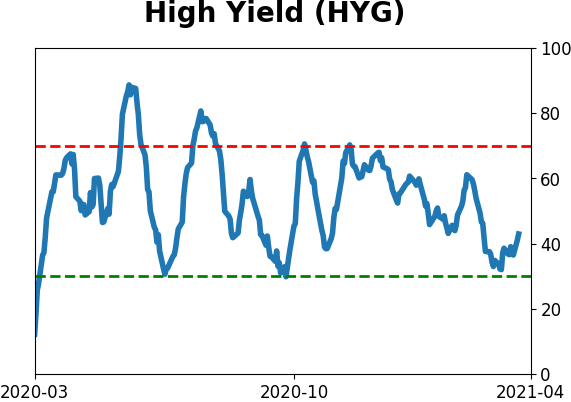
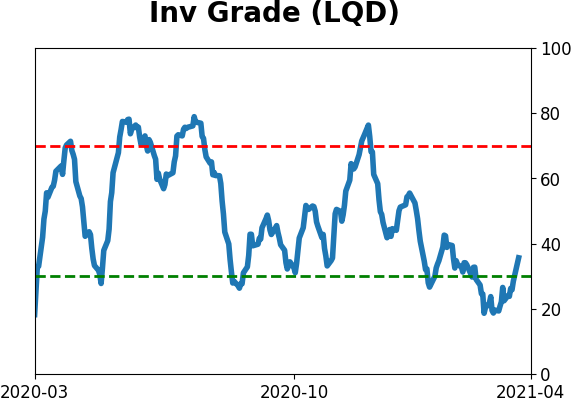
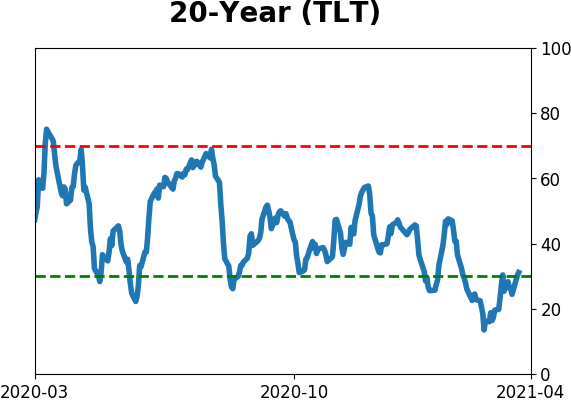
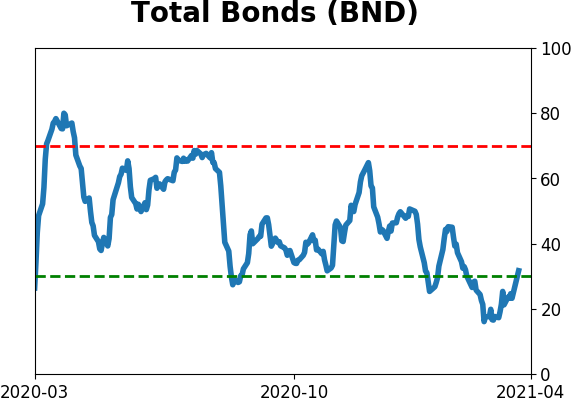
Bond ETF's - 10-Day Moving Average
|
|
|
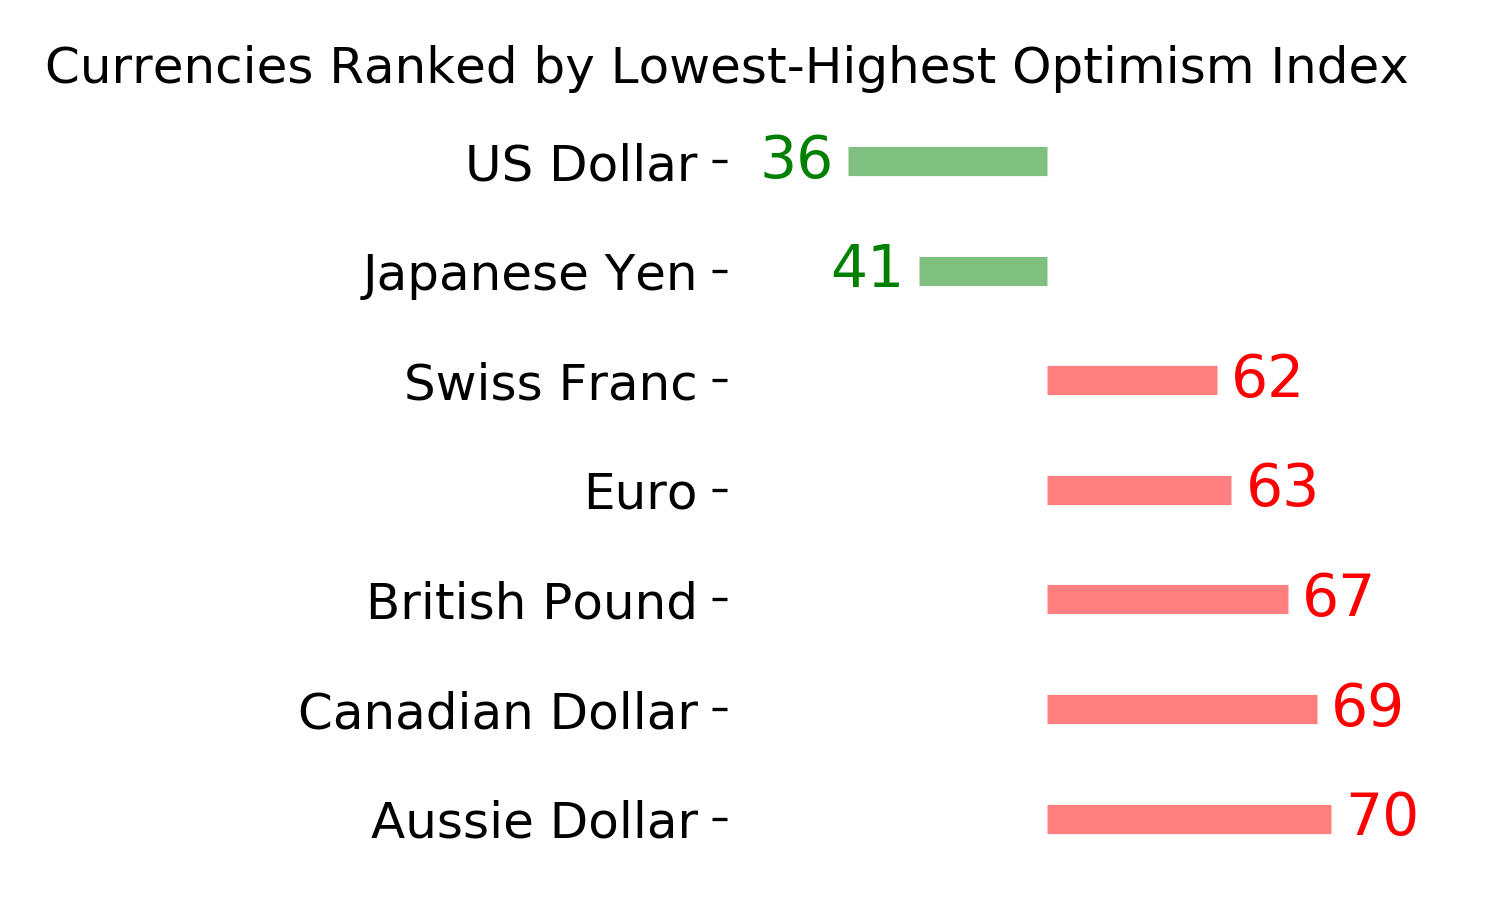
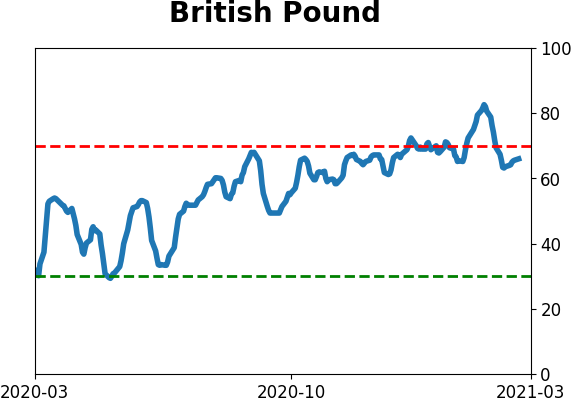
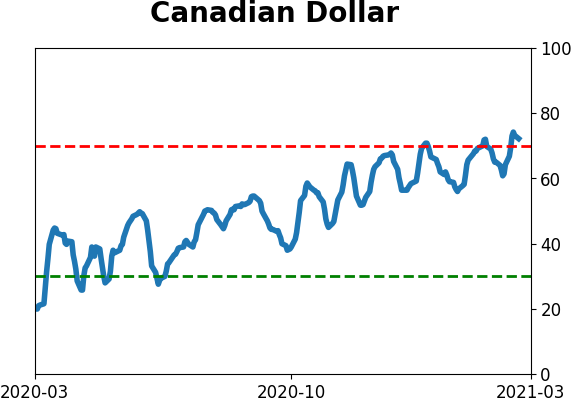
Currency ETF's - 5-Day Moving Average
|
|
|
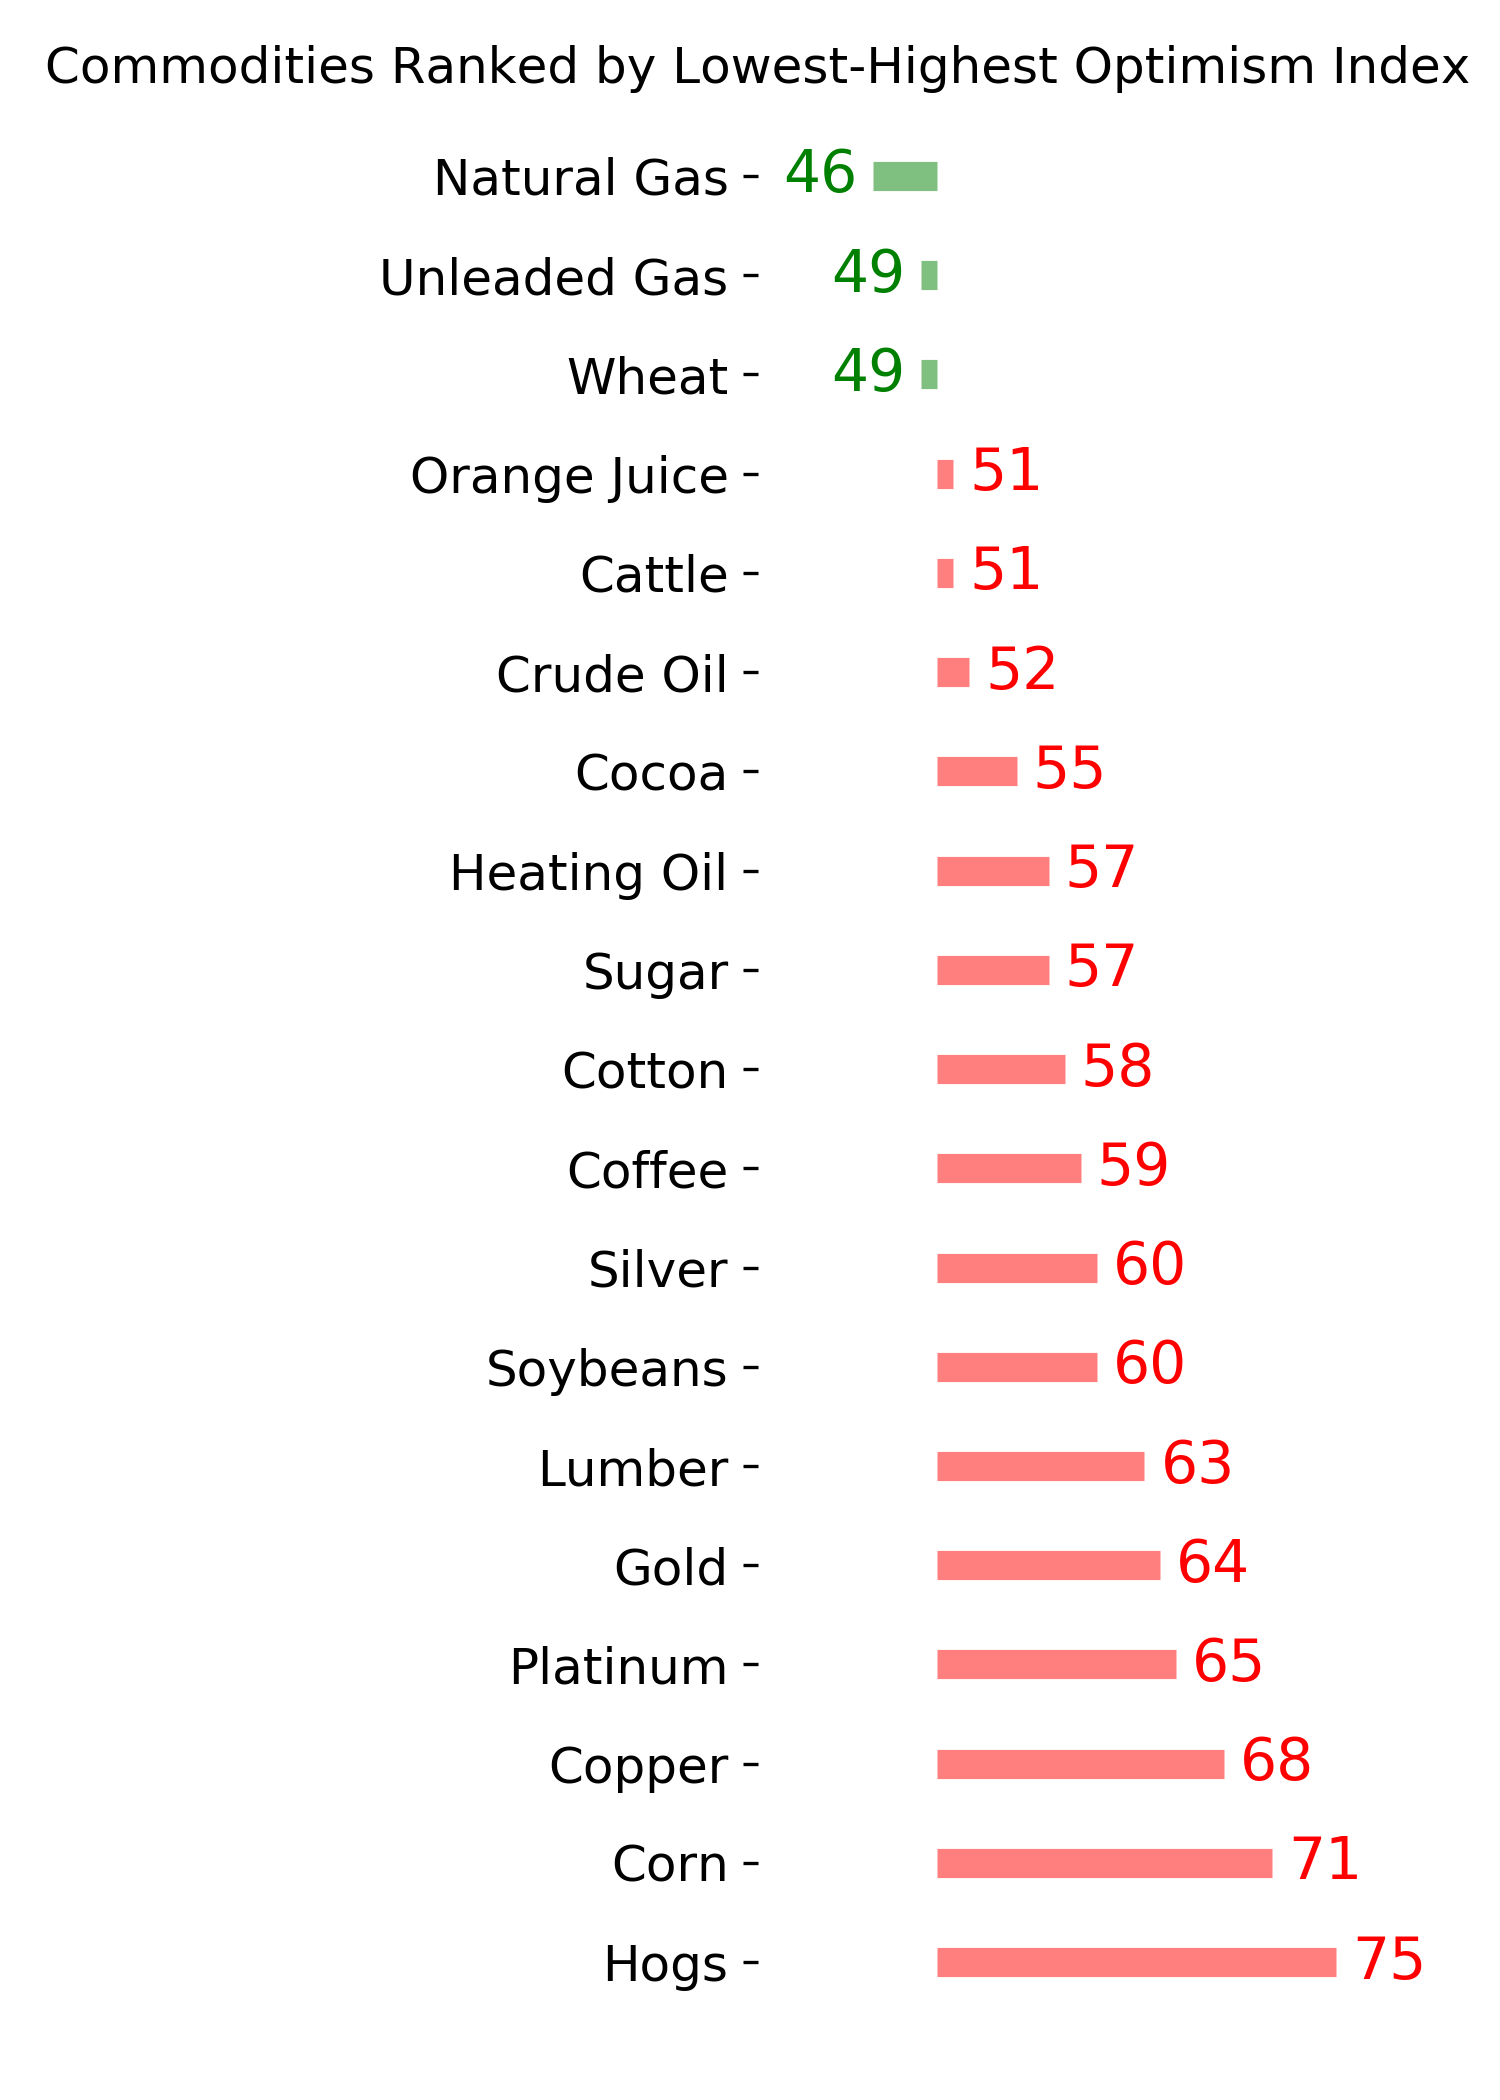
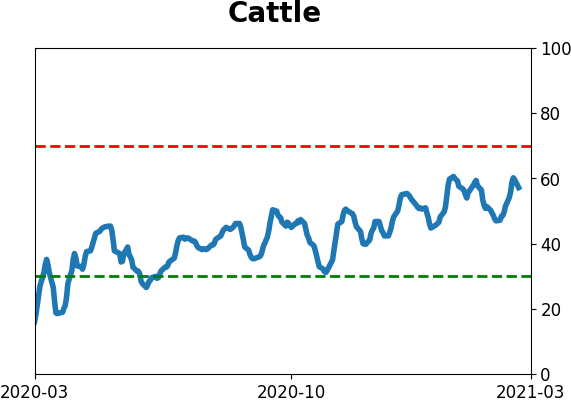
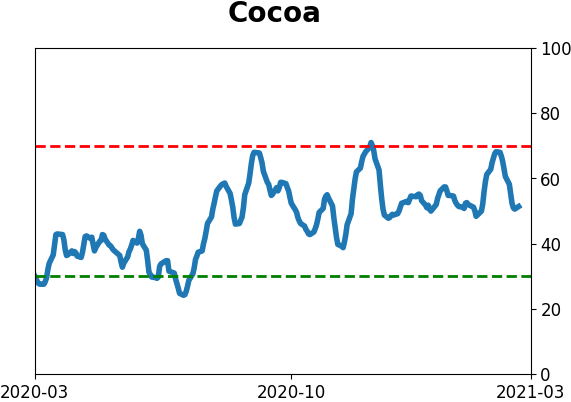
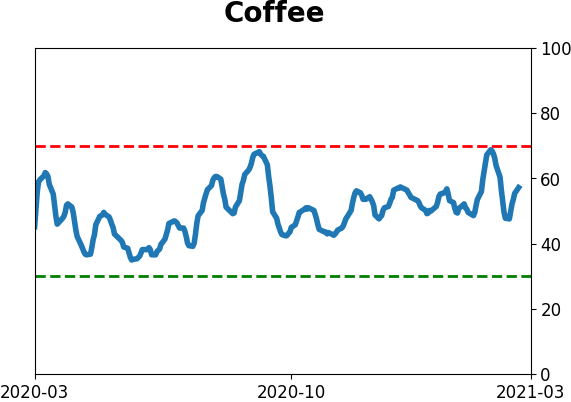
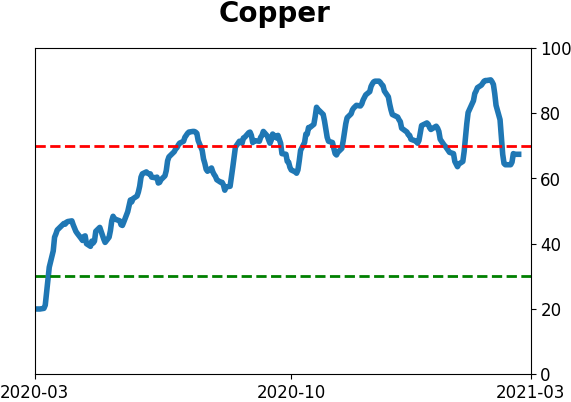
Commodity ETF's - 5-Day Moving Average
|
|