Market overview: should you be concerned along with everyone else?
The stock market continues to chop below its all-time high while investors and traders continue to talk about "recessions" and "late-cycle". Here's my market outlook:
- Long term risk:reward doesn’t favor bulls. Valuations are high, but valuations can remain high for years.
- Fundamentals (6-12 months): still bullish because there is no significant U.S. macro deterioration, but this could change IF macro data deteriorates significantly over the next few months
- Technicals (3-6 months): neutral/bullish
- Technicals (1-2 months): no clear edge in either direction.
Fundamentals (6-12 months)
The economy and the stock market move in the same direction in the long term. Hence, leading economic indicators are also long term leading indicators for the stock market.
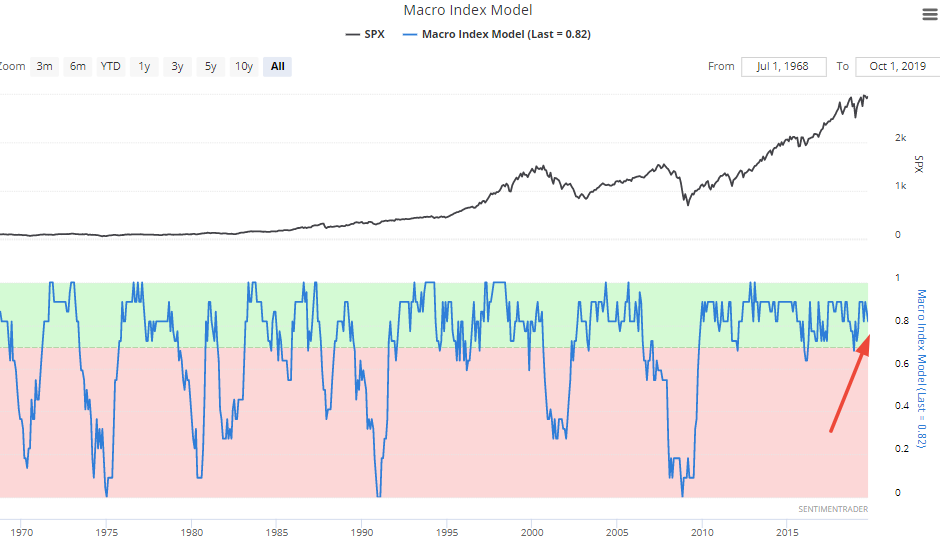
Here is our Macro Index, which aggregates 11 leading indicators. Overall, there is no significant U.S. economic deterioration right now. What will happen to macro in the future? I don't know. Instead of trying to guess the future, macro tells us how to react and trade day-by-day depending on what's happening right now.
Moreover, the Unemployment Rate continues to make new lows for this economic expansion. This keeps a simple but effective long term timing model on a BUY signal:
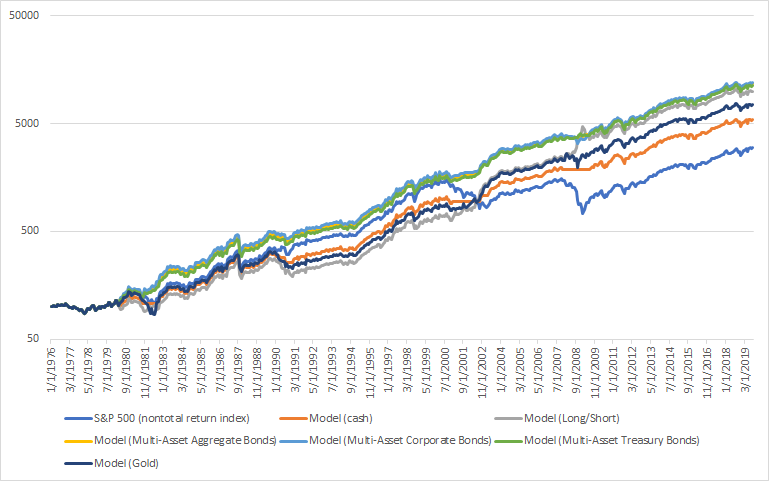
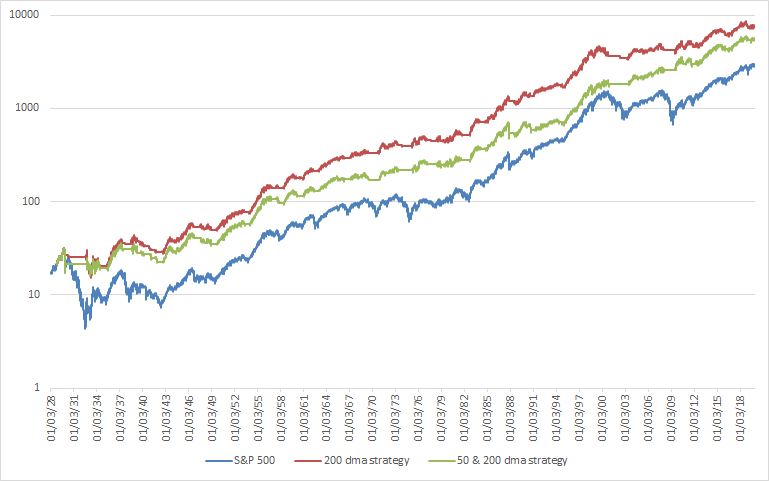
- Buy and hold the S&P 500 if the S&P 500 (nontotal return index) is >= its 12 month average, or the Unemployment Rate is <= its 12 month average.
- Otherwise, SELL.
You can do 1 of 6 things when you SELL:
- Model: Shift into 100% cash
- Model (long/short): Short the S&P 500 Total Return Index
- Model (Multi-Asset Aggregate Bonds): Buy and hold the Bloomberg Barclays US Aggregate Bond Total Return Index
- Model (Multi-Asset Corporate Bonds): Buy and hold the Bloomberg Barclays US Corporate Bond Total Return Index
- Model (Multi-Asset Treasury Bonds): Buy and hold the Bloomberg Barclays US Treasury Bond Total Return Index
- Model (Gold): Buy gold
The main weak points in U.S. macro revolve around trade, manufacturing, and the yield curve. Moreover, soft data is worse than hard data. (Please see the specified economic-data charts at the bottom of this post.)
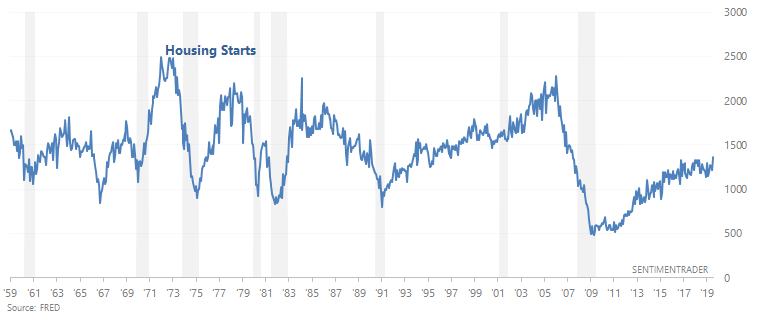
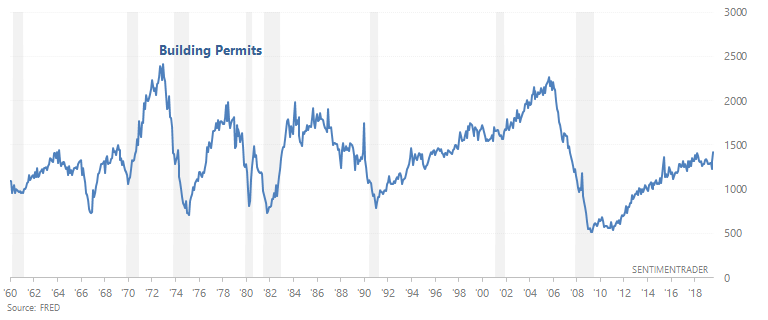
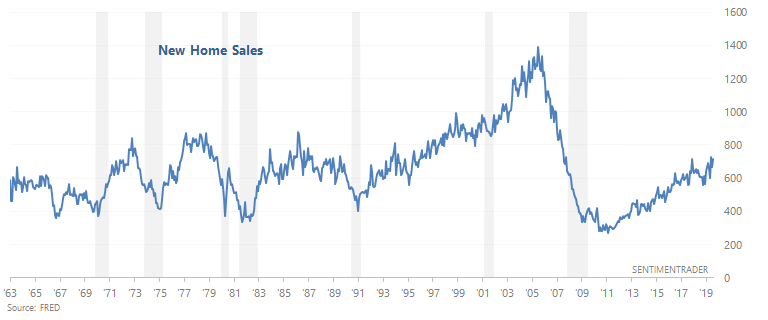
- Housing continues to support the economic expansion. In the past, Housing Starts, Building Permits, and New Home Sales trended downwards before recessions began. Housing Starts, Building Permits, and New Home Sales are trending sideways now.
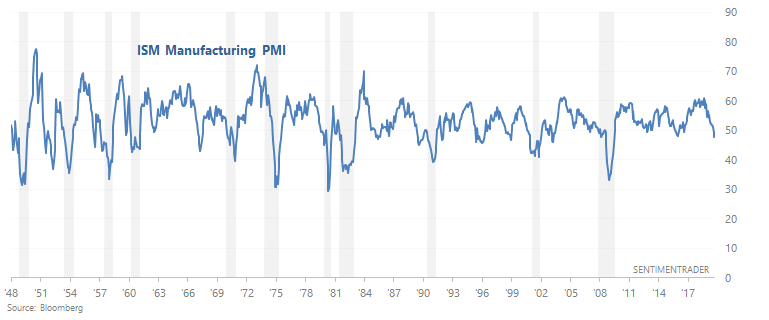
- Manufacturing-related data remains weak. The ISM manufacturing PMI is below 50, signalling contraction.
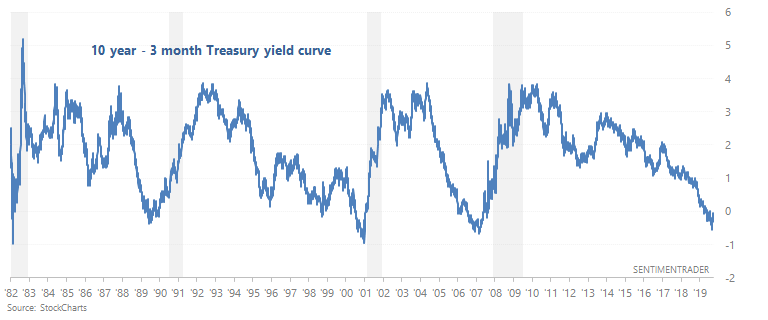
- The yield curve remains a long term bearish factor for stocks. As we've demonstrated many times here at SentimenTrader, yield curve inversions typically happen near the end of economic expansions and bull markets.
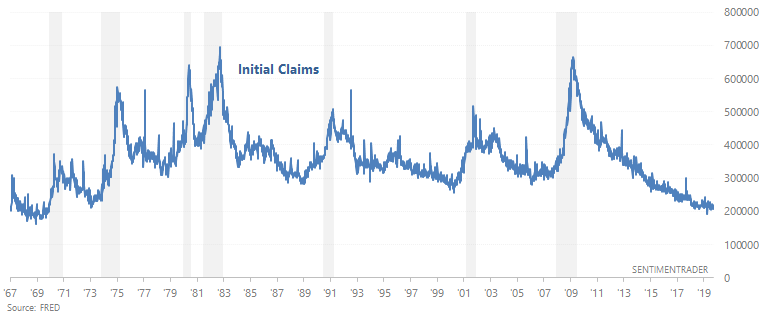
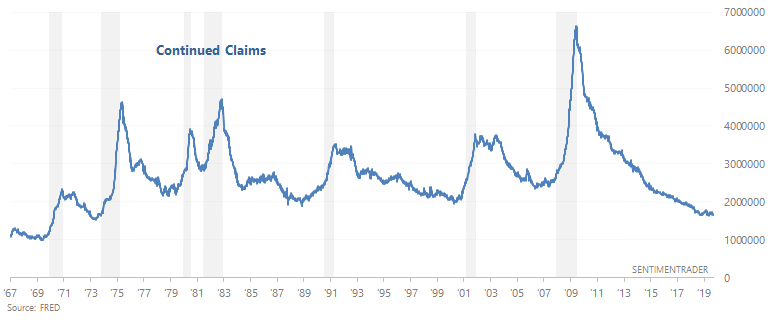
- The labor market is still a bullish factor for macro. 2 leading labor market indicators - Initial Claims and Continued Claims - continue to trend sideways. In the past, Initial Claims and Continued Claims trended upwards before recessions began.
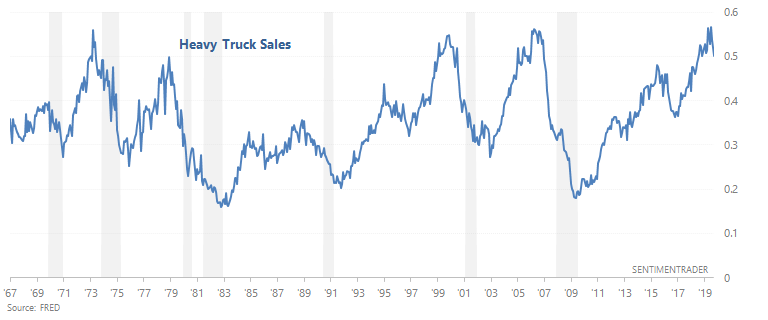
- Heavy Truck Sales is a bullish factor for macro because this indicator is trending sideways. In the past, Heavy Truck Sales trended downwards before recessions began.
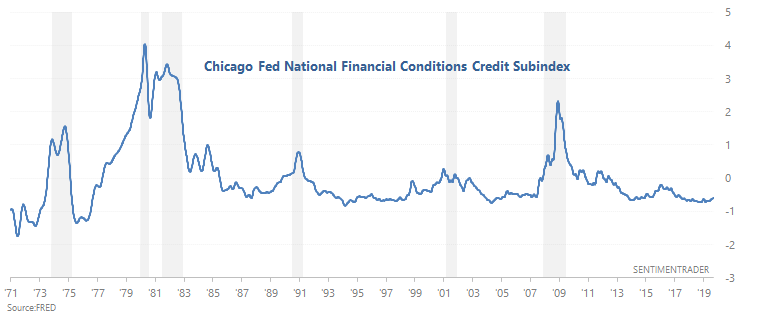
- Financial conditions have yet to see significant deterioration.
And lastly, a quick word about the yield curve. Plenty of market watchers have noted that when the Treasury yield curve is inverted for many consecutive weeks (e.g. right now), the stock market tends to crash sometime over the next 1-2 years. I slightly disagree with this conclusion. While I believe the inverted yield curve is a late-cycle symptom for this bull market, I don't think it guarantees a crash over the next 1-2 years. No indicator is a flawless Holy Grail, including the yield curve. A study by the St. Louis Fed looked at yield curve inversions in ex-U.S. countries (the WSJ mentioned this as well). The conclusion was:
- Yield curve inversions gave several false positives in the U.K. and Canada
- False positives were rare in Germany, France, and the U.S.
- The yield curve was a poor predictor in Italy
So keep this in the back of your mind when you think about the yield curve inversion.
Technicals (3-6 months)
The majority of our stats suggest that the stock market's 3-6 month outlook is bullish, although there are some bearish stats as well. Let's start with the bullish stats, and then we'll look at the bearish ones.
Bullish:
Fractals/analogues
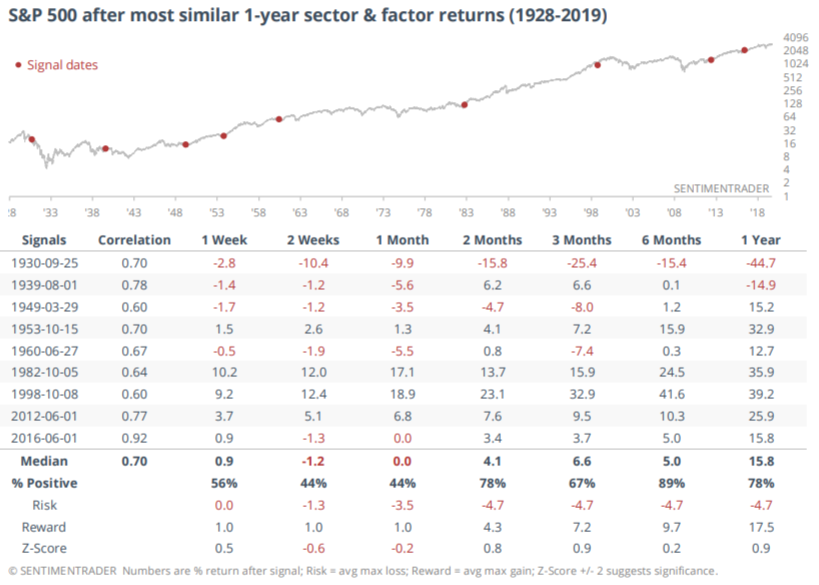
Plenty of market watchers like to draw similarities between the S&P today and other historical years. I've looked at this in a quantitative but simplistic way in the past, running the S&P's X-day (e.g. 200 day) correlation against other X-day periods throughout history. Jason ran a more comprehensive study, which looked for other periods in which the S&P barely moved over the past year while sector and factor performances were similar to today.
With the exception of the Great Depression, similar historical cases saw gains for the S&P over the next 6-12 months:
Breadth
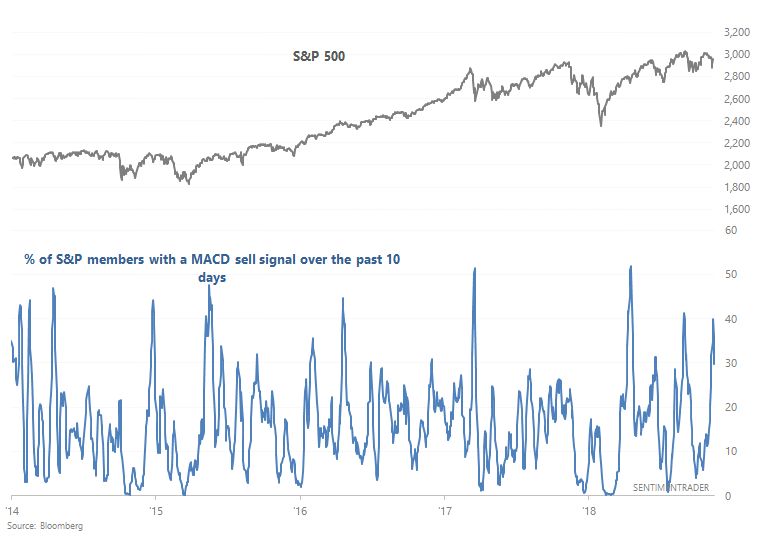
There is no clear bullish or bearish signal among breadth indicators as an aggregate right now, but some shorter term breadth indicators gave bullish signs this weak. For example, as of Wednesday 40% of S&P members saw a MACD sell signal over the past 10 days:
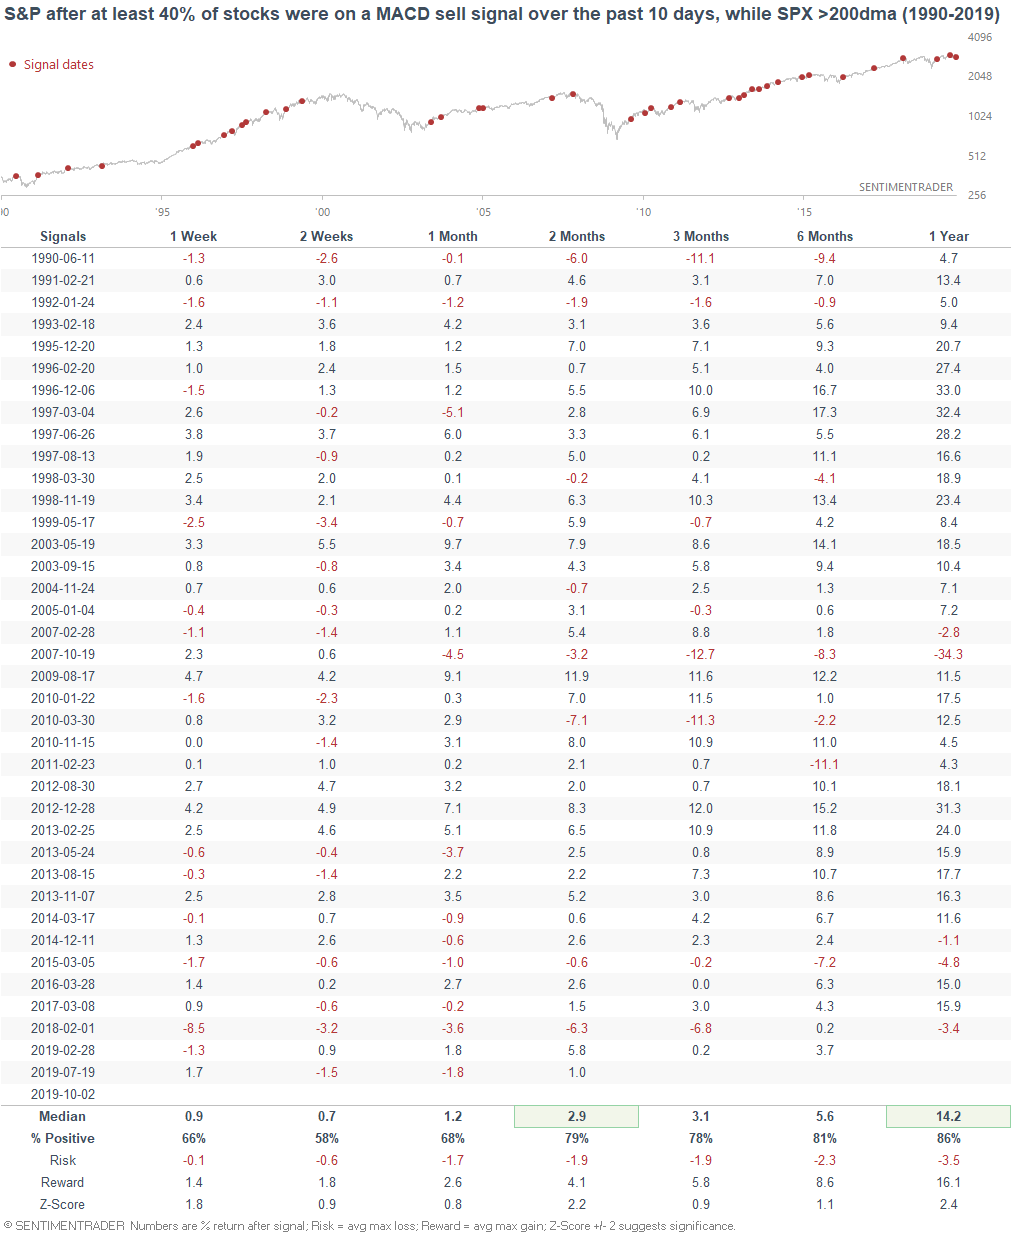
When this happened while the S&P was above its 200 day moving average, the S&P's returns over the next 2-3 months were more bullish than average:
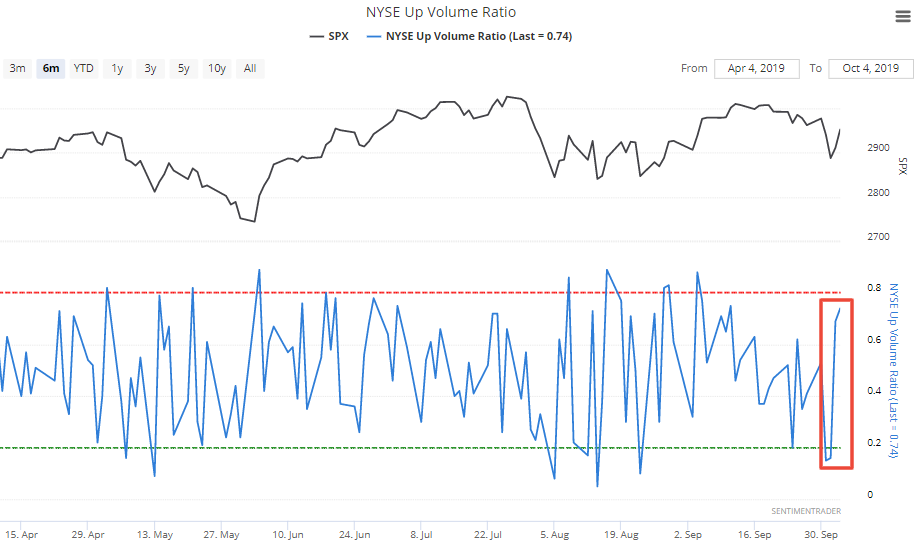
But after the across-the-board selloff on Tuesday and Wednesday, stocks strongly reversed higher on Thursday and Friday. As a result, the NYSE Up Volume Ratio went from 2 very low days to 2 relatively high days:
When this happened in the past (across-the-board selloff to across-the-board rally), the S&P's returns over the next 2 weeks were more bullish than random. Moreover, the stock market always rallied over the next year, with some very positive returns.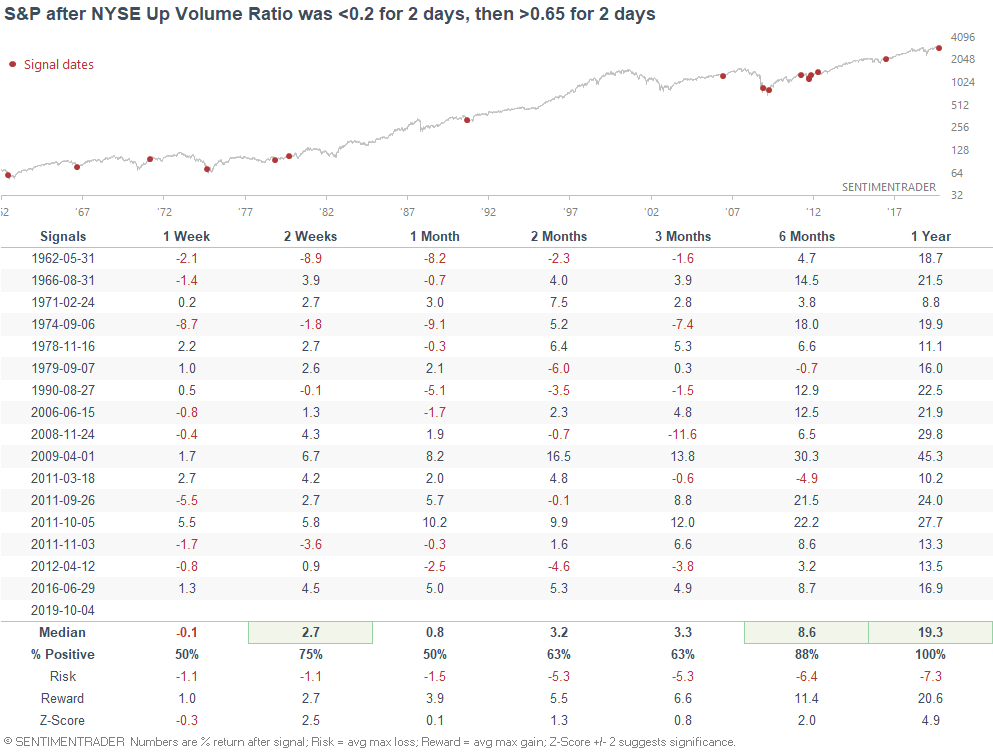
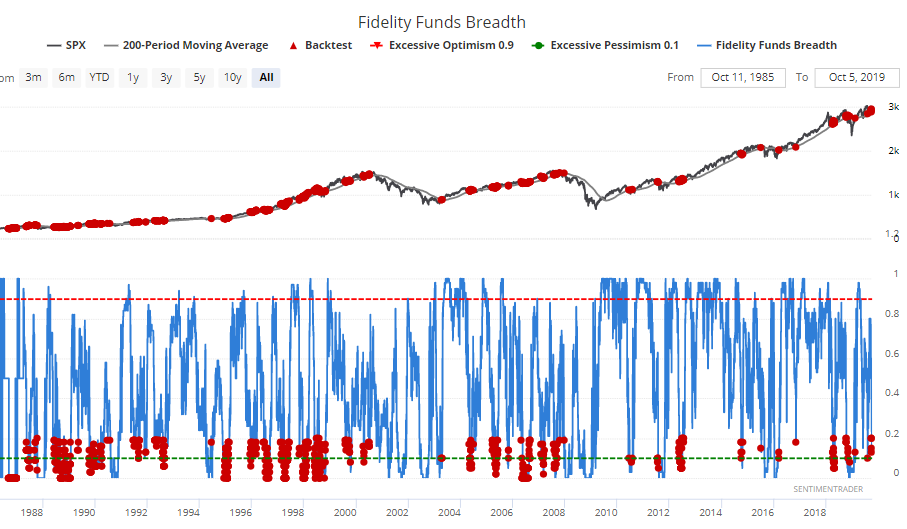
From a slightly longer-term perspective, the % of Fidelity Select mutual funds that outperformed short term Treasury Bills over the past quarter has fallen to 20:
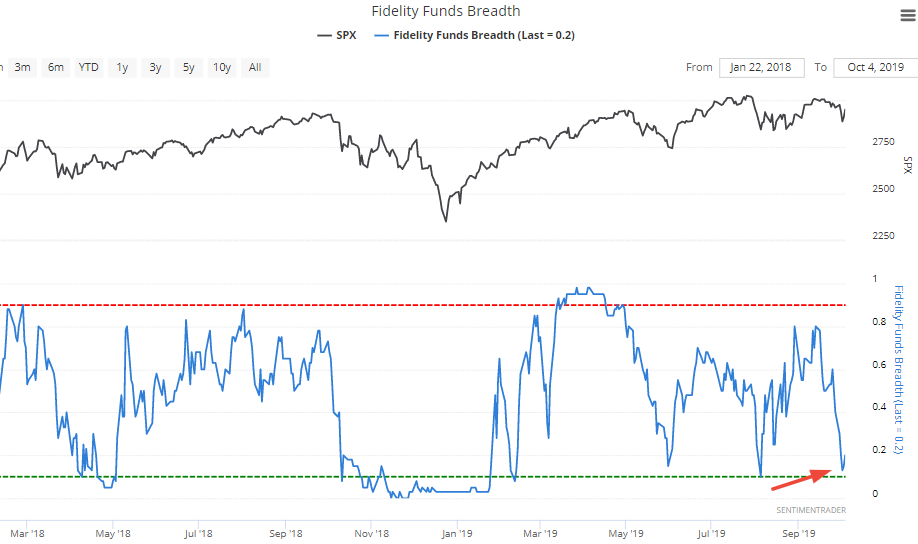
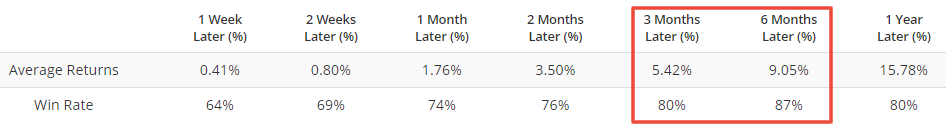
While this isn't an extremely low figure, such readings in the past while the S&P was above its 200 dma were mostly bullish for the S&P over the next 3 months (click here to use the Backtest Engine):
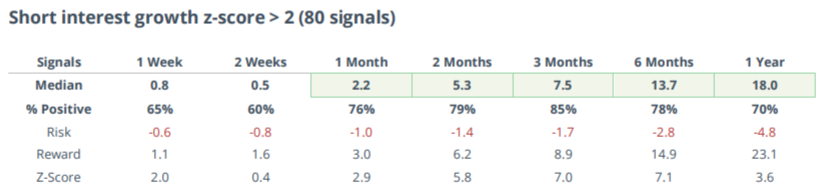
Short interest
As Jason mentioned on Thursday, bets against stocks are quickly rising, causing the NYSE Short Interest growth rate z-score to jump above 2 standard deviations:
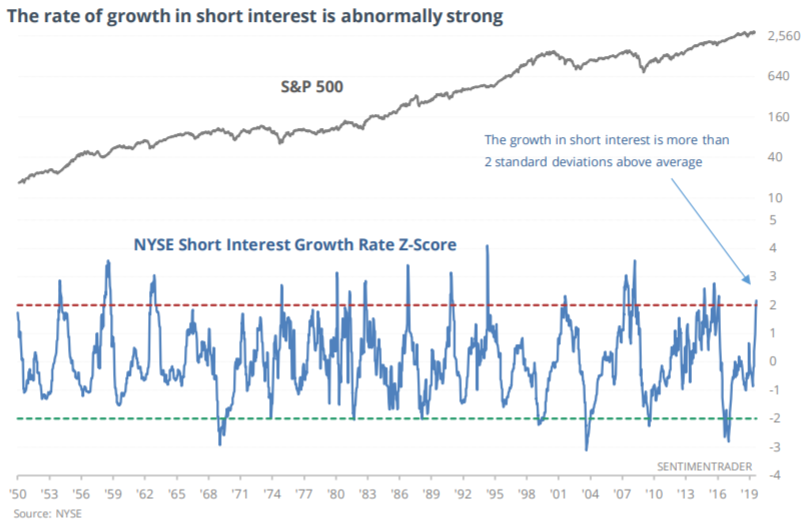
Similar jumps in short interest in the past were more bullish than random for stocks on all time frames:
Sentiment
Various sentiment surveys - whether it's sentiment among CEO's, CFO's, investment professionals, or individual investors - demonstrate a high level of anxiety. (And who could blame them, given the trade war and never-ending talk about recession?)
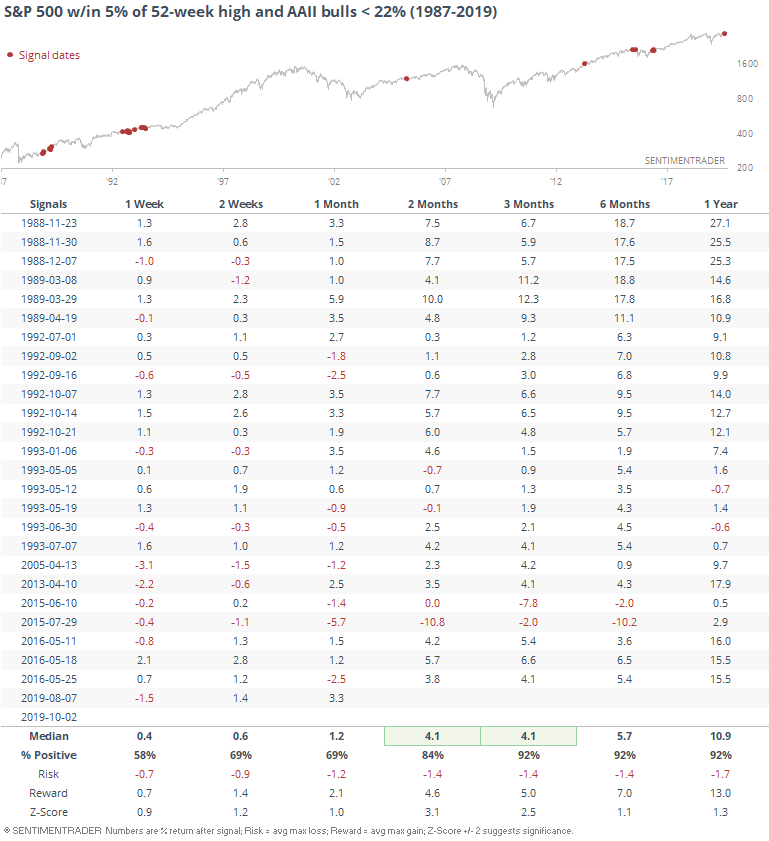
For example, the latest AAII survey demonstrated that fewer than 22% of respondents were bullish:
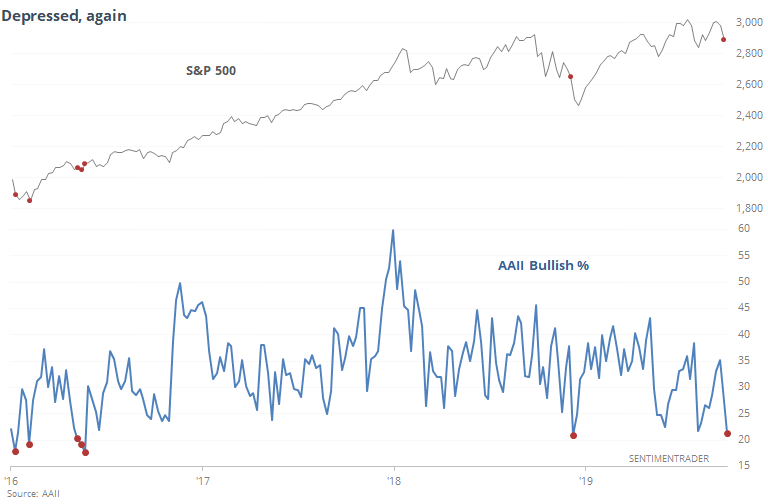
But as Jason demonstrated on Thursday, such pessimism while the stock market was near a 52 week high were mostly bullish for the S&P going forward:
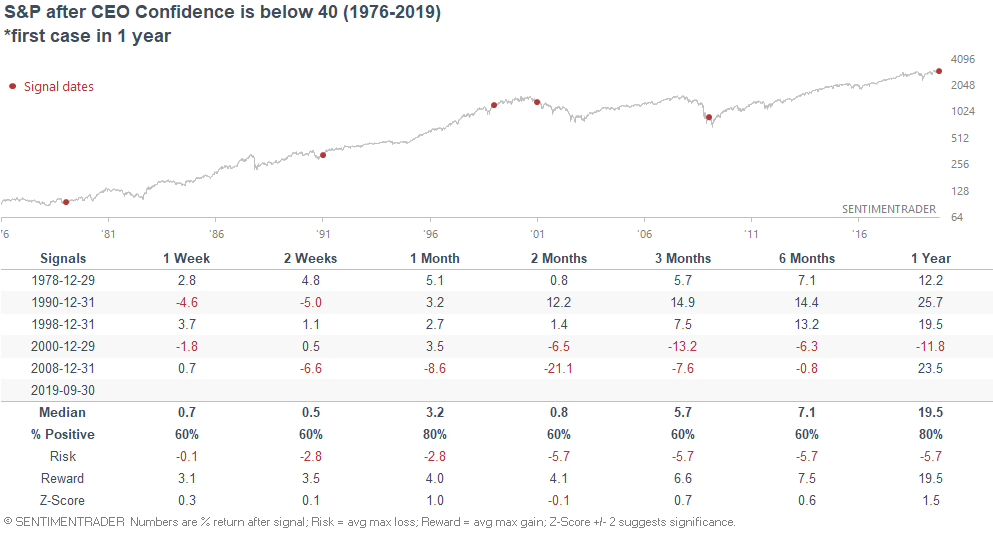
Similarly, CEO Confidence according to the Conference Board has dropped to the lowest level in a decade:
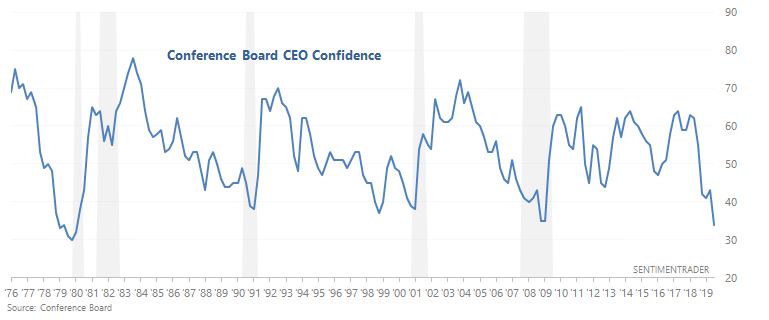
But when CEO sentiment was this bad in the past, the stock market's forward returns weren't all that bearish:
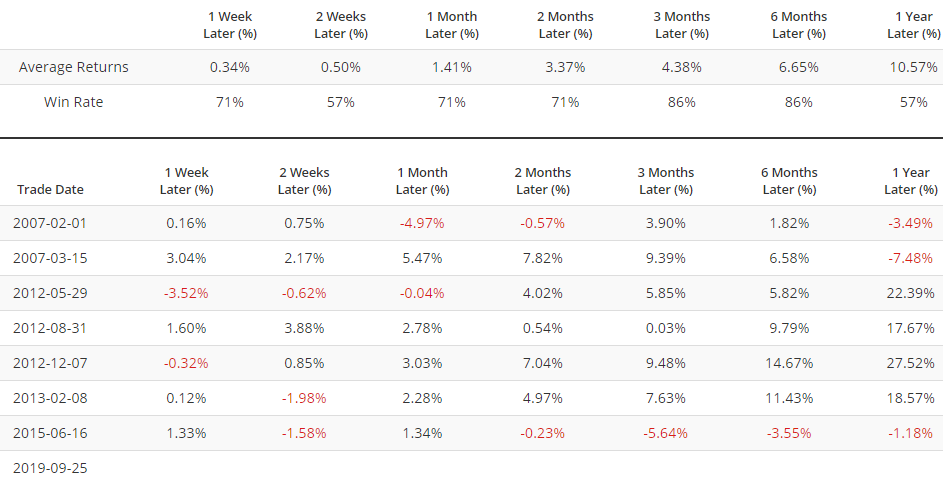
And as I demonstrated on Wednesday, soft economic data is much worse than hard economic data:
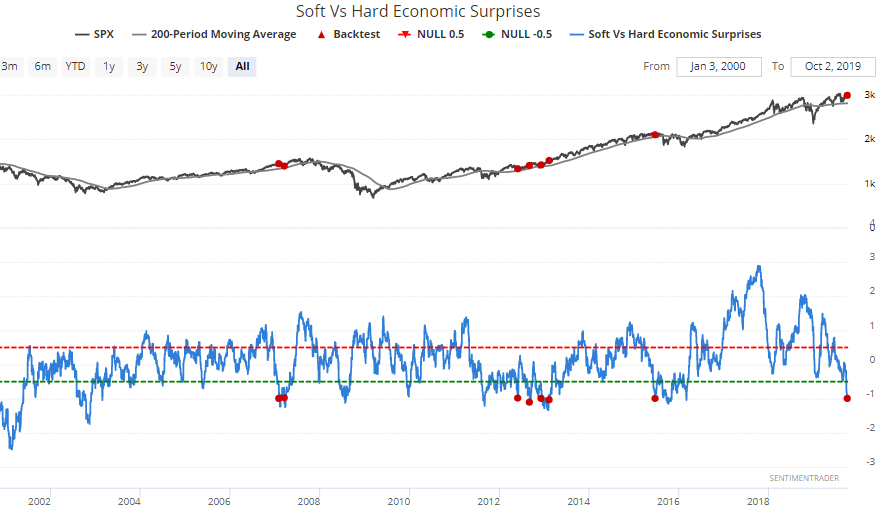
When this happened while the S&P was in an uptrend (i.e. > 200 dma), the S&P's 3-6 month forward returns were mostly bullish. The one glaring exception was during the 2015 global economic slowdown, which was followed by a sudden multi-day stock market crash:
Neutral/Bearish:
Basic trends
From a basic trend following perspective, the S&P 500 remains in an uptrend, whereas other indices like the Russell 2000, MSCI World Index (ex-U.S.) are trending sideways or downwards.
For example, the S&P 500 is above its 200 dma right now and its 50 dma is above its 200 dma:
Meanwhile, the Russell 2000's 50 dma has fallen below its 200 dma. This wasn't a consistent bearish sign for the Russell...
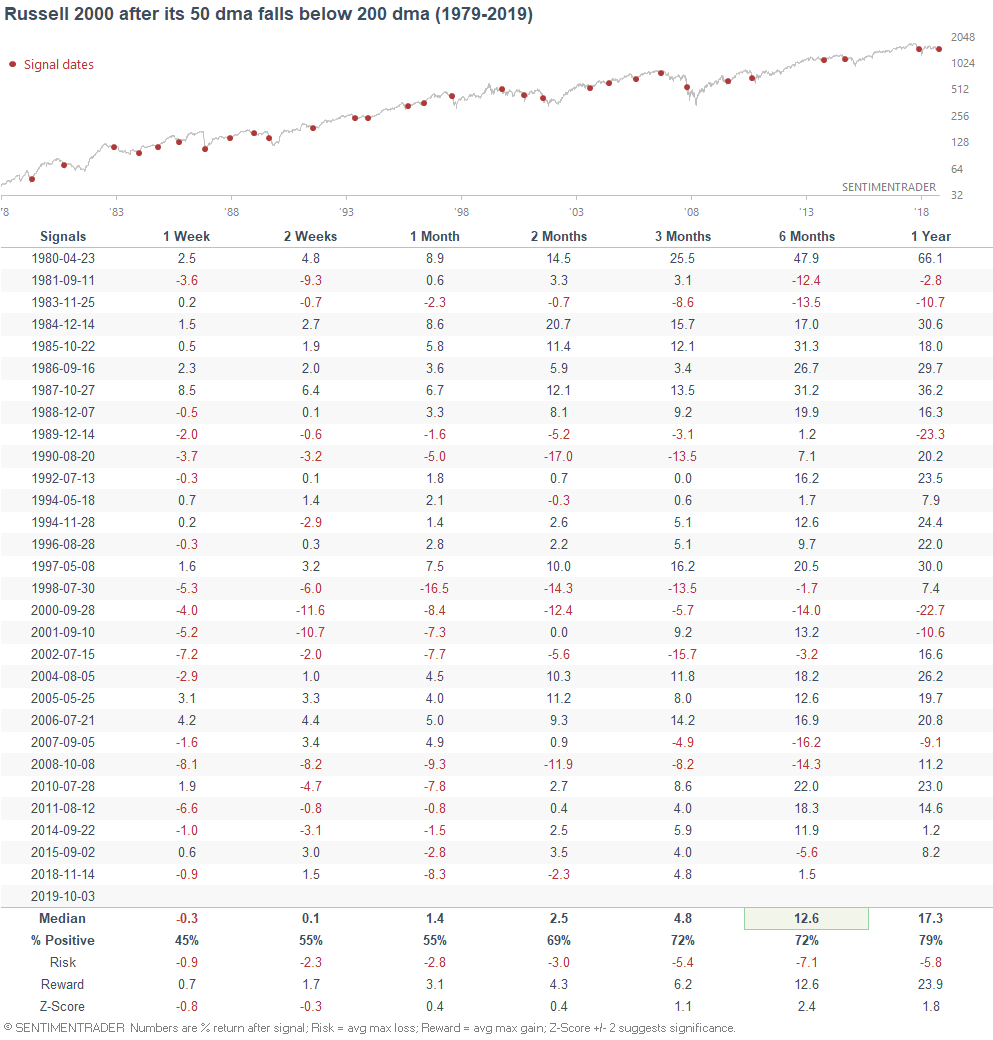
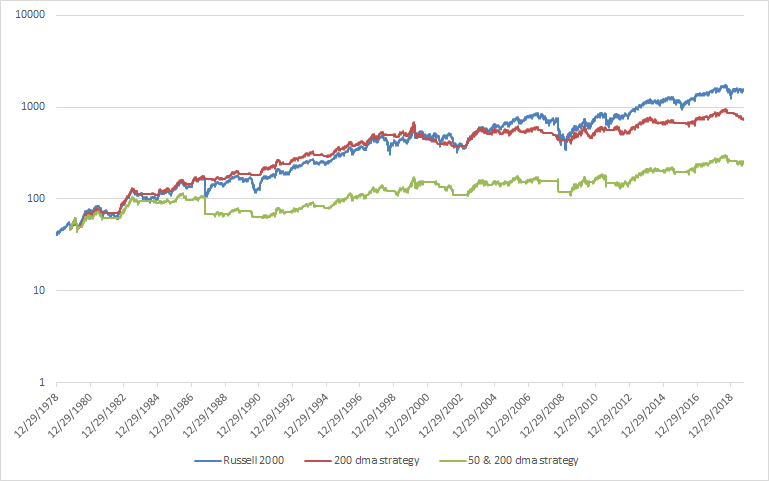
*This illustrates a key problem with basic trend following. If you don't add fundamentals, trend following's performance can deteriorate very quickly if the market goes through an extended choppy period (see 2000-present for the Russell)
Seasonality
As Jason pointed out on Monday, the S&P has gone up each quarter this year so far. When it did so in the past, October was often rocky, but December was strong:
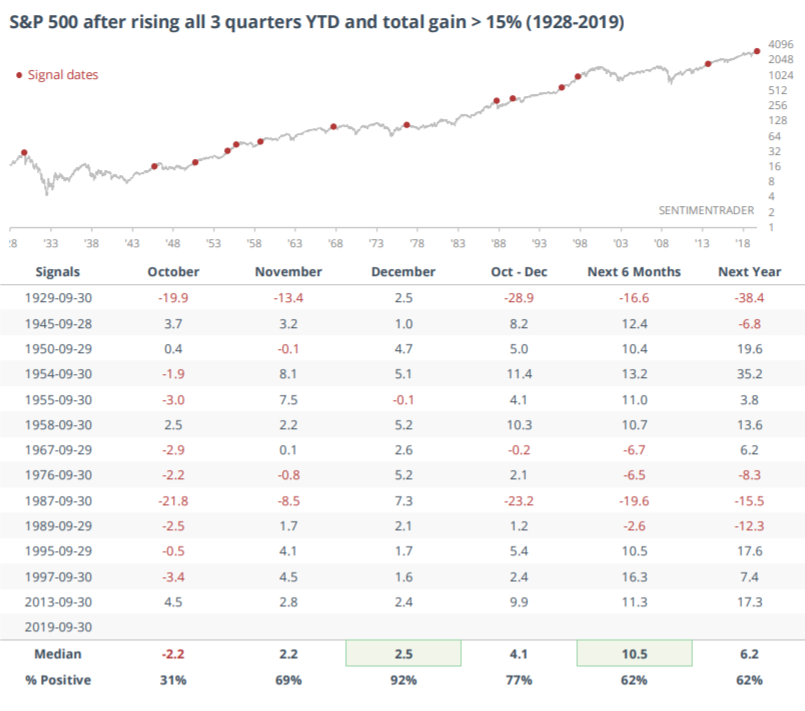
*Seasonality factors are of tertiary importance.
To recap
- Long term risk:reward doesn’t favor bulls.
- Fundamentals (6-12 months): still bullish because there is no significant U.S. macro deterioration.
- Technicals (3-6 months): neutral/bullish
*Economic Data & long term risk:reward charts (from "Fundamentals")
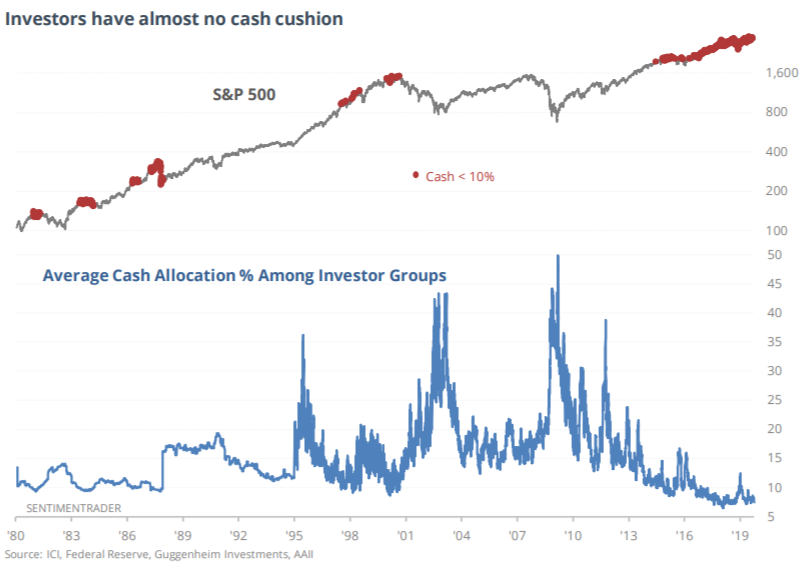
Investors have almost no cash cushion:
Housing Starts:
Building Permits:
New Home Sales:
ISM Manufacturing PMI:
10 year - 3 month yield curve:
Initial Claims:
Continued Claims:
Heavy Truck Sales:
Chicago Fed National Financial Conditions Credit Subindex: