
Market overview: breakout
With the U.S. stock market at all-time highs, here's my market outlook:
- Long term risk:reward doesn’t favor bulls. Valuations are high, but valuations can remain high for years before stocks crash.
- Fundamentals (6-12 months): still bullish because there is no significant U.S. macro deterioration, but this could change IF macro data deteriorates significantly over the next few months
- Technicals (3-6 months): neutral/bullish (various stock markets & sectors are breaking out, but some of our core indicators are showing optimism).
- Technicals (1-2 months): no clear edge in either direction.
Fundamentals (6-12 months)
The economy and the stock market move in the same direction in the long term. Hence, leading economic indicators are also long term leading indicators for the stock market.
Overall, there is no significant U.S. economic deterioration right now. This is bullish for the stock market on a 6-12 month time frame. The main weak points in U.S. macro revolve around trade, manufacturing, and the yield curve. For more details and charts, please see my weekly fundamentals post.
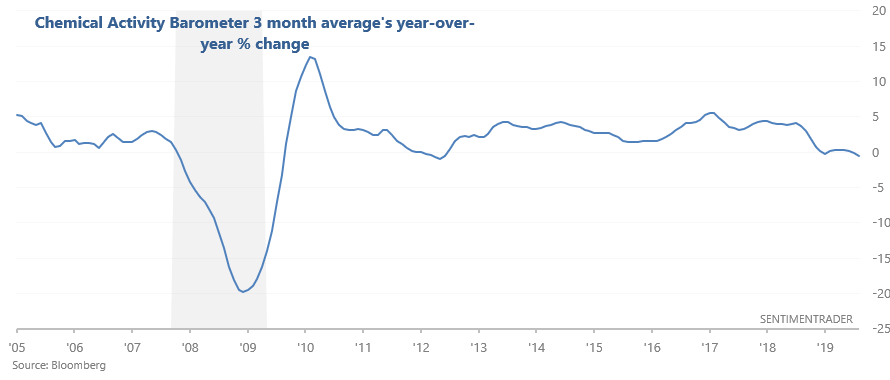
On a side note, the unemployment rate is below its 12 month average and the S&P is above its 12 month average. This keeps a simple but effective long term strategy on a BUY signal. Meanwhile, the Chemical Activity Barometer remains weak...
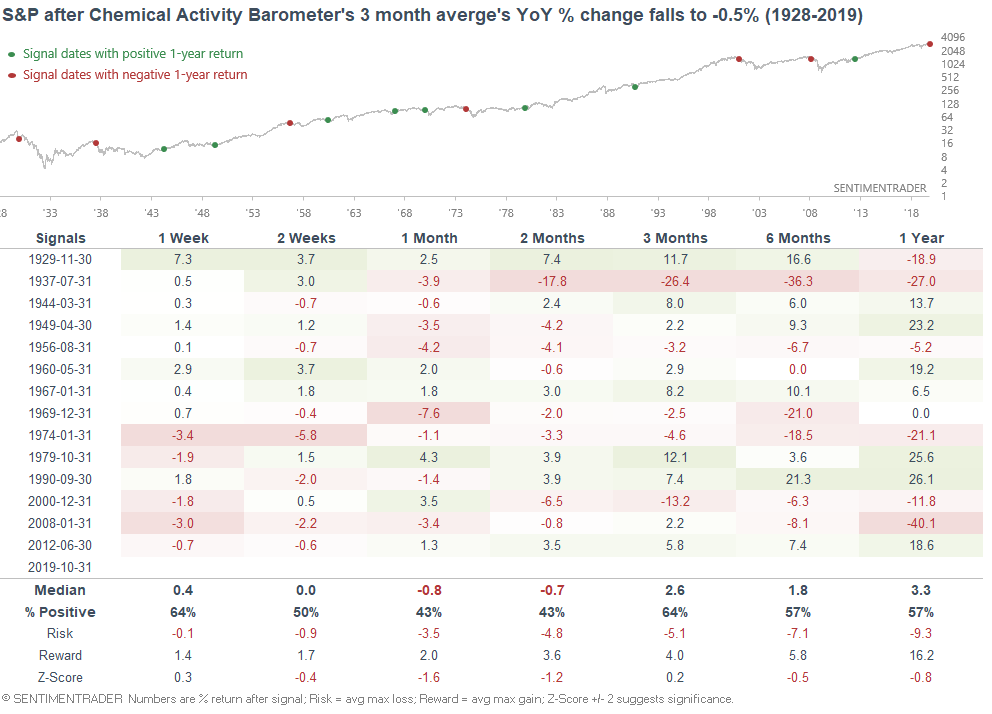
... but weak manufacturing is already baked into the Macro Index, which remains bullish overall.
And lastly (for fundamentals), the WSJ mentioned that Eurozone Industrial Confidence has now fallen to -9.5:
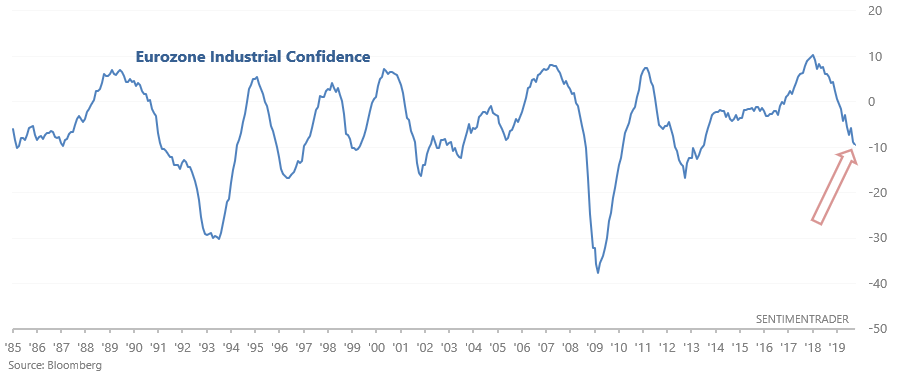
When economic sentiment was this bad, European equities' forward returns weren't consistently bearish. If we look at what happened next to the DAX (Stoxx 50 doesn't have enough data)....
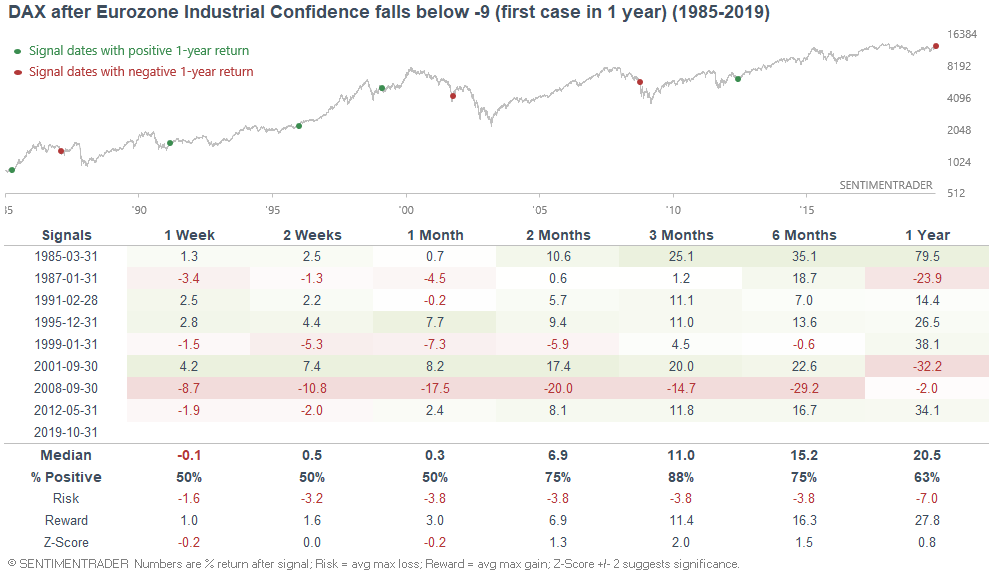
...the DAX typically rallied over the next 3 months, with September 2008 being a major exception.
Technicals (3-6 months)
The majority of our stats suggest that the stock market's 3-6 month outlook is bullish, although there are some bearish stats as well. Let's start with the bullish stats, and then we'll look at the bearish ones.
Bullish:
Momentum & seasonality
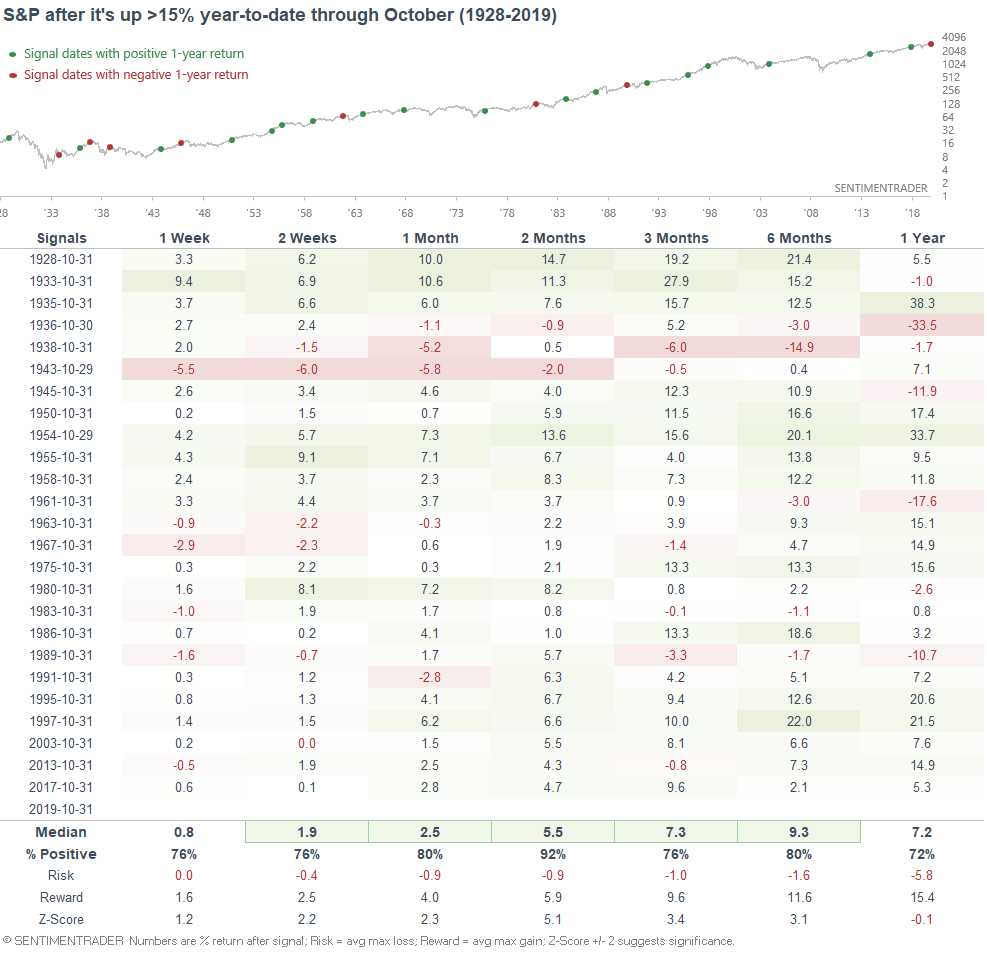
With just 2 months left this year, the S&P 500 is up more than 20% year-to-date. From a seasonality perspective, this is bullish for stocks. When the S&P rallied more than 15% from January-October, it typically rallied from November-December as well:
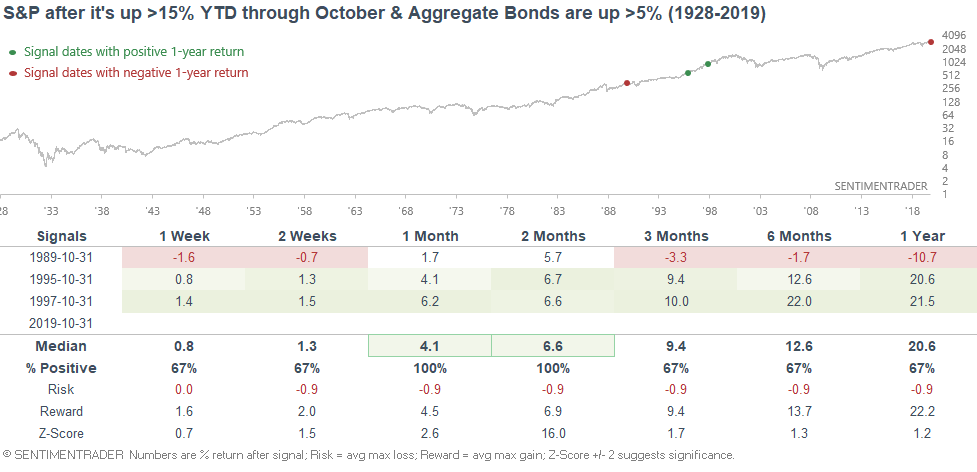
It's not just stock market investors that are doing well. With interest rates trending down, bond market investors have also had a great year. If we look at historical cases in which the S&P is up >15% year-to-date through October and the Bloomberg Barclays U.S. Aggregate Bond Index is up >5%, the S&P also tends to rally throughout the rest of the year.
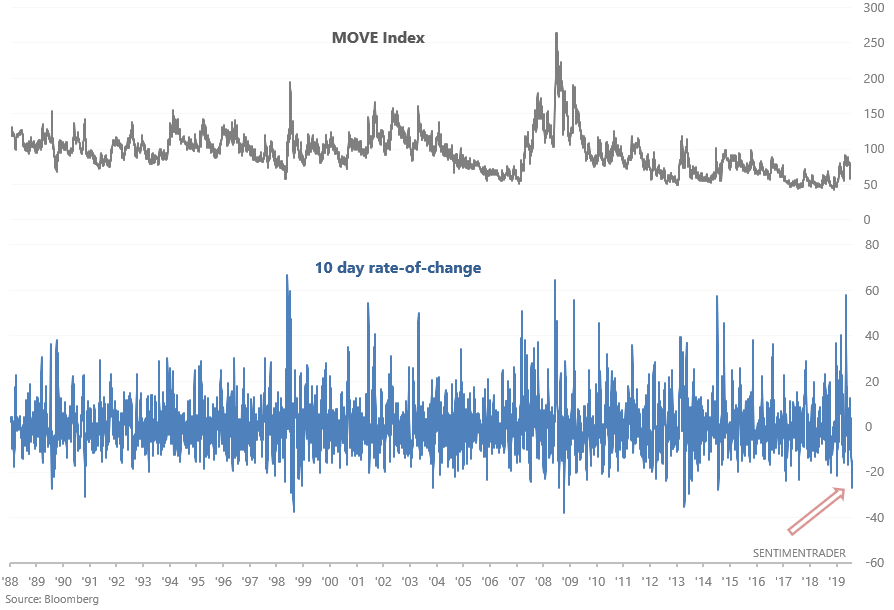
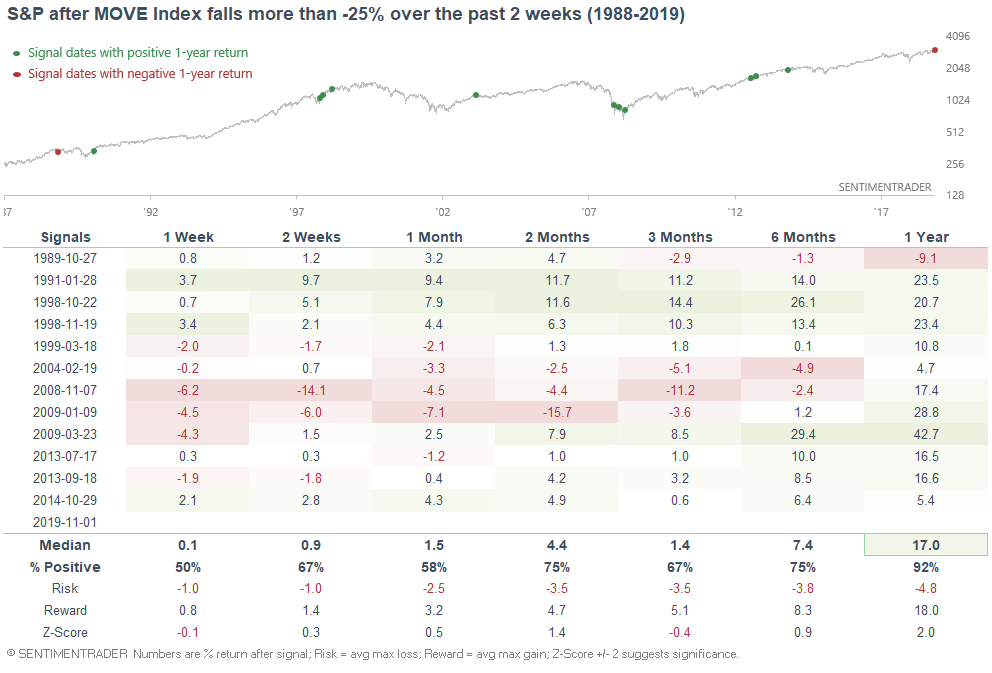
Bond market volatility
As Zerohedge noted, bond market volatility has collapsed over the past 2 weeks.
When this happened in the past, the 10 year Treasury yield typically rallied over the next 6 months:
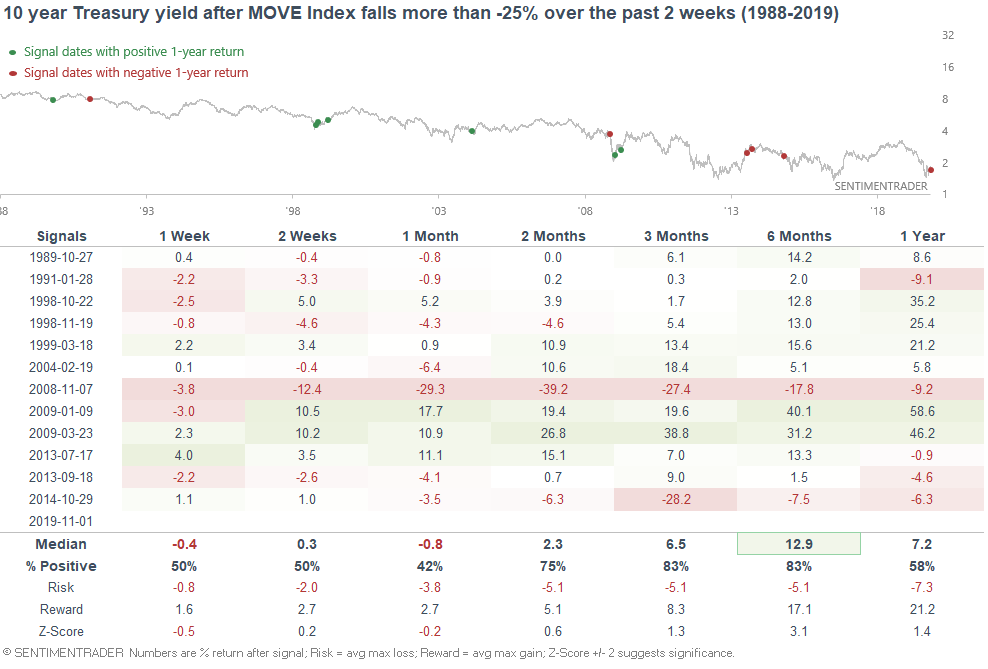
...and the S&P 500 typically rallied over the next year.
Sentiment
Sentiment remains bifurcated. While some of our core indicators are showing optimism, other popular sentiment indicators are showing extreme pessimism (you'd think that it would be rare to find extreme pessimism while stocks are at all-time highs). I think this sentiment divergence is mainly a result of the trade war. Those who think that the trade war (which feeds into the global slowdown) is the end-all-be-all are losing it, while those who think that the trade war is just a side show are optimistic.
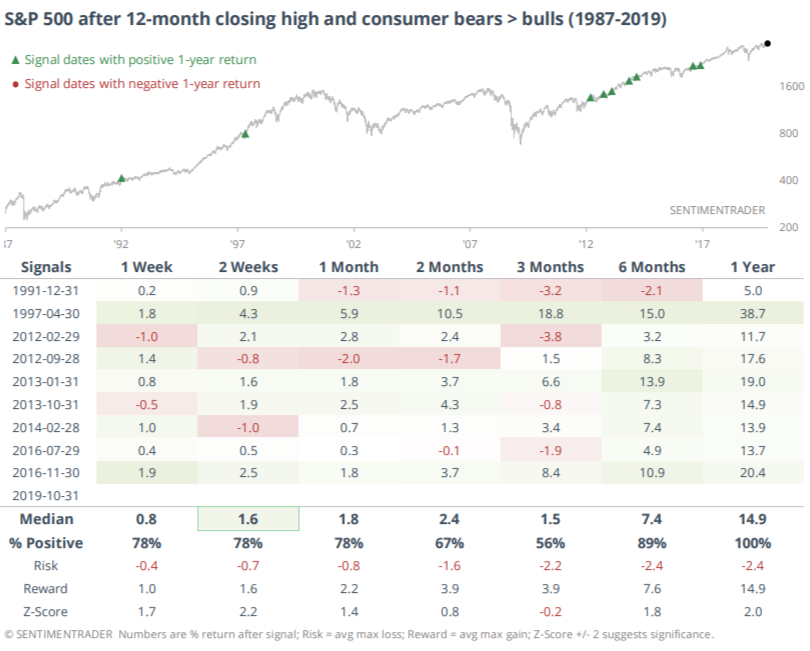
Anyways, Jason noted that consumers still expect stocks to fall despite being at all-time highs:
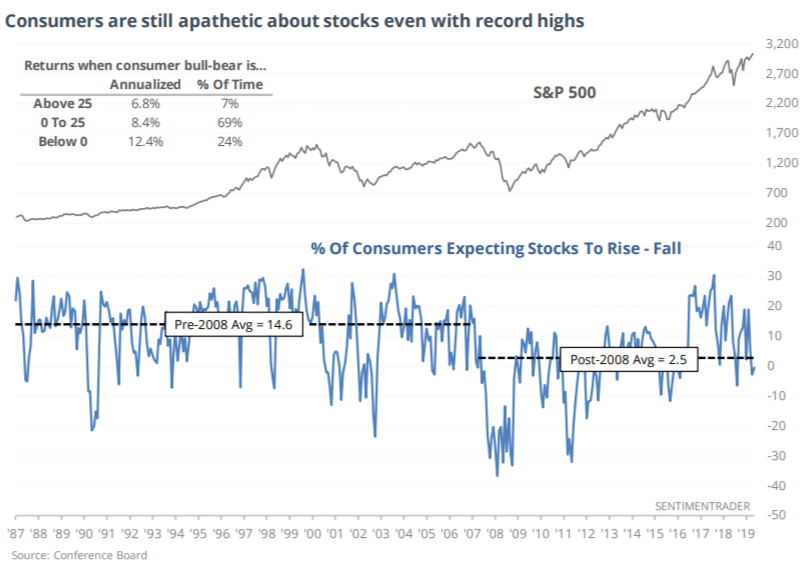
This behavior has occurred consistently after the GFC, and has been mostly bullish for stocks.
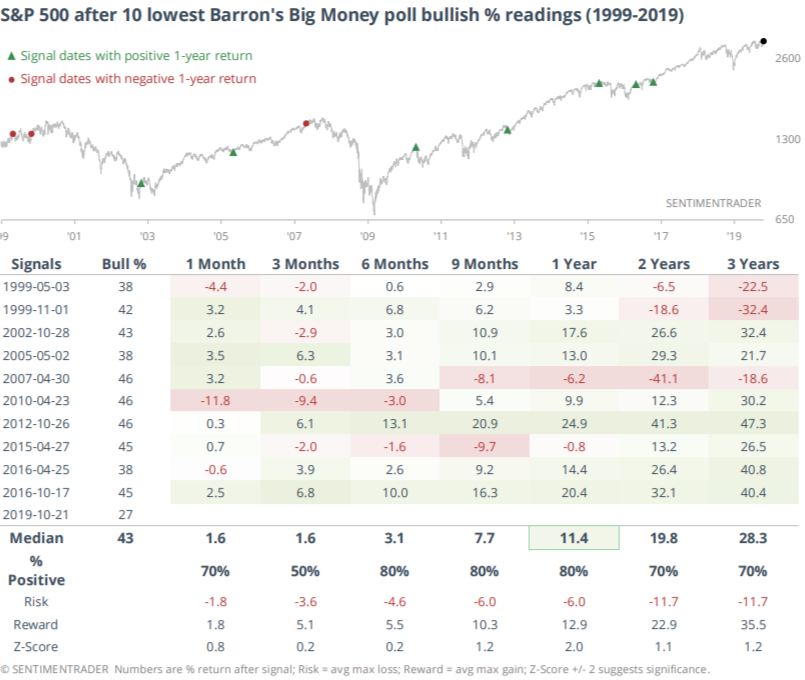
Similarly, Jason noted that Big Money (according to a Barron's survey) has never been less bullish. This is understandable - if you spend too much time staying glued to the latest bearish macro headlines (HOLY S#@! MACRO IS THE WORST SINCE 2008) or the latest trade war news, your fears will be blown out of proportion.
*In times of macro/political stress, the best thing to do is stop reading the headlines, turn off social media (an echo chamber), and focus on indicators that you know to be useful. Ignore hype (both bullish and bearish hype), and focus on the facts.
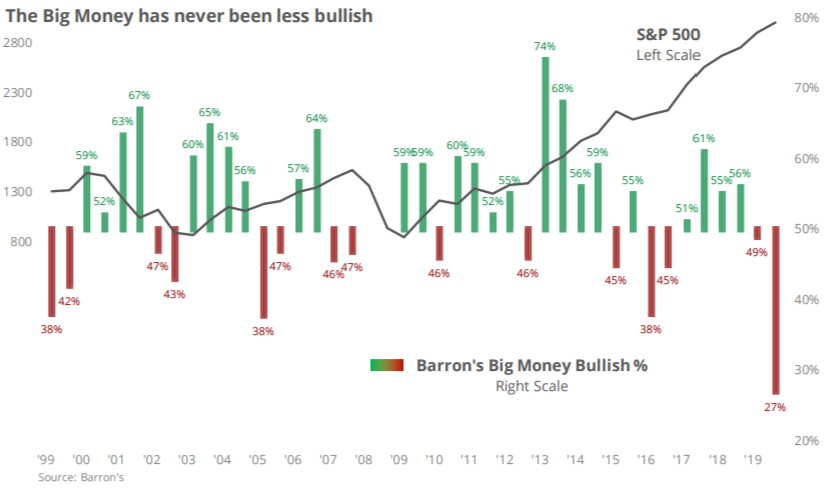
When Big Money was this bearish, the S&P's returns over the next year were more bullish than random.
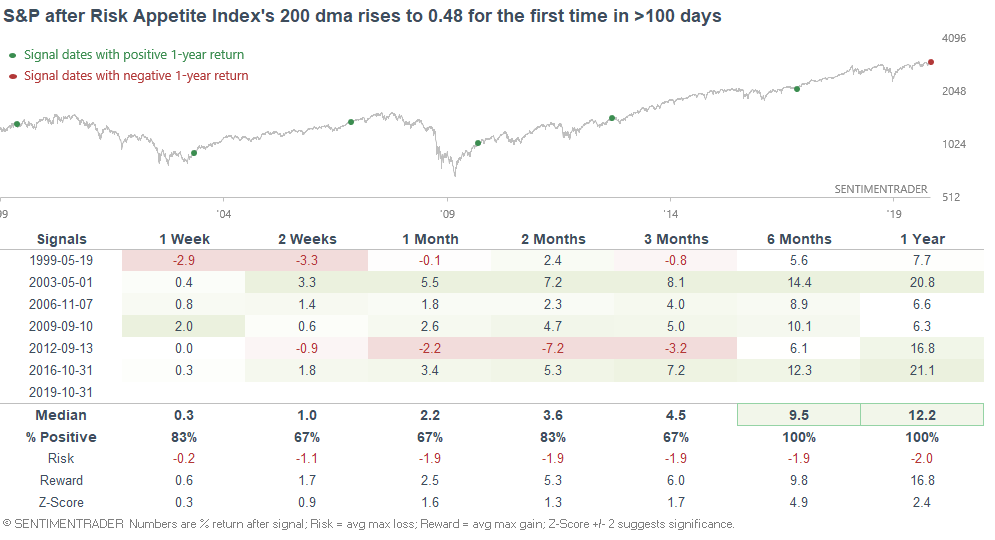
While the Risk Appetite Index is quite high right now, its long term average is just starting to curl up.
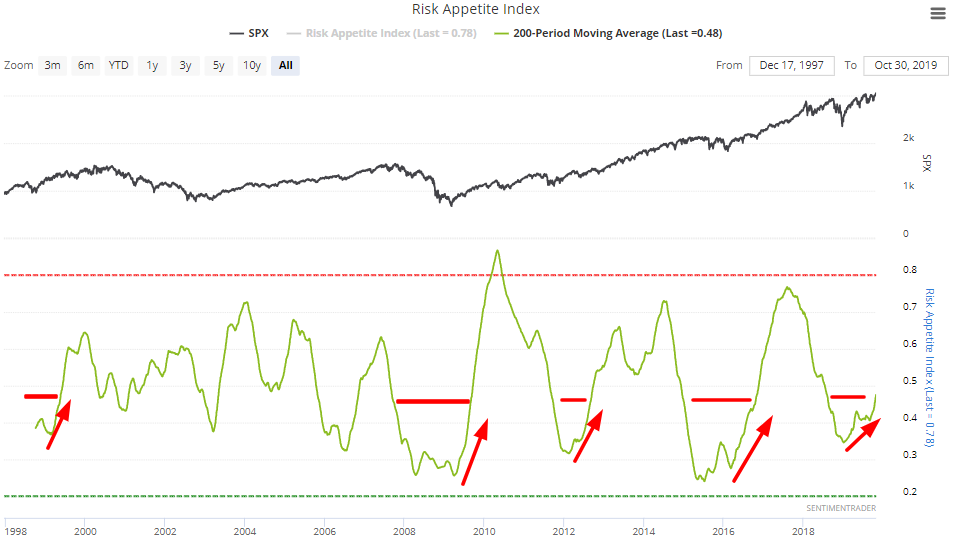
I noted on Thursday that when it curls up for the first time in a long time, the S&P's returns over the next 6-12 months were pristine:
Breakouts & breadth
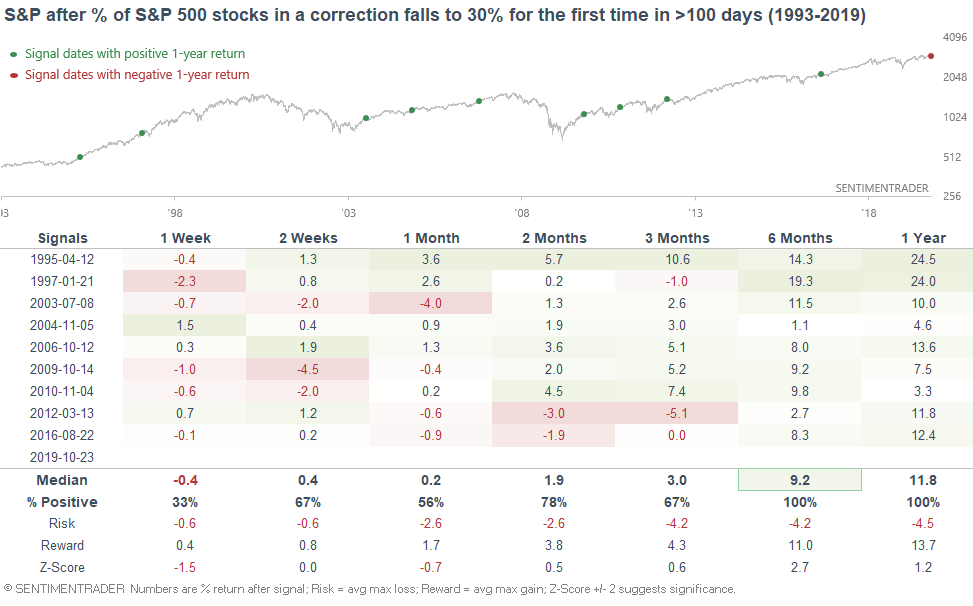
As I noted on Tuesday, the % of S&P 500 stocks in a correction has fallen to a level for the first time in a long time:
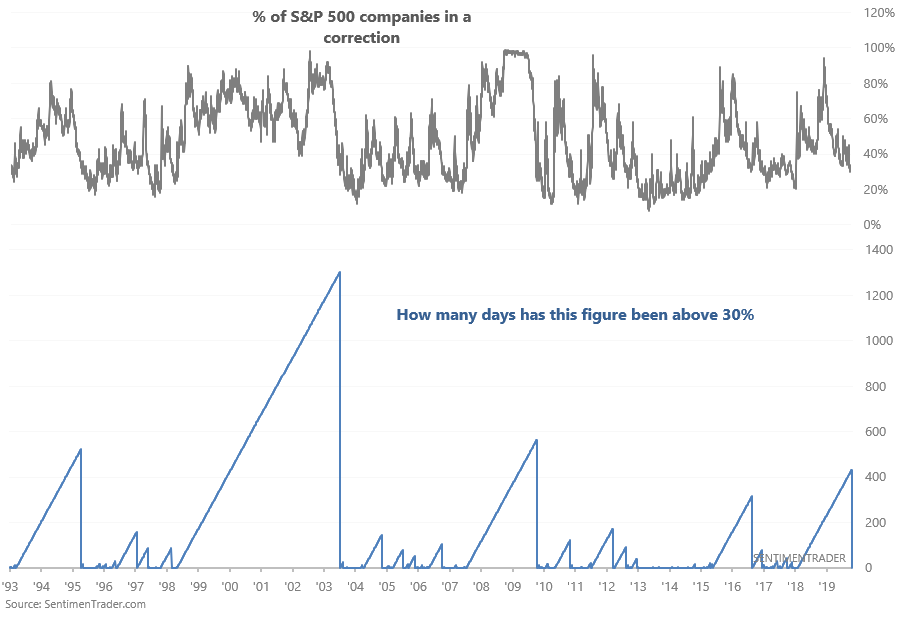
This typically coincides with a major breakout in the stock market, which has been consistently bullish for stocks over the next 6-12 months:
Neutral/bearish:
Our core sentiment indicators
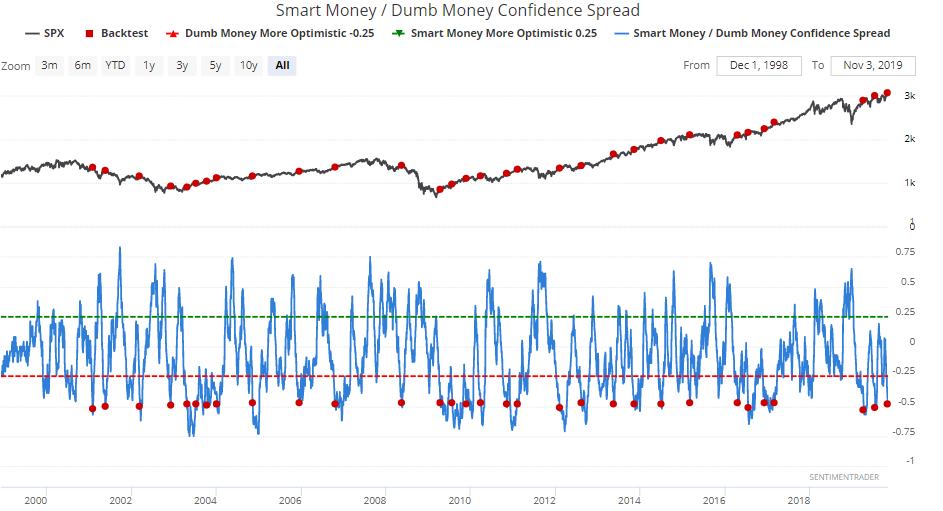
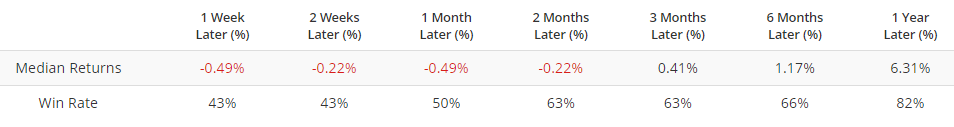
Our Smart Money/Dumb Money Confidence spread has fallen to -0.48. When it did so in the past (excluding overlaps over the past 50 days), the S&P's returns over the next 6 months were consistently weak:
Breadth
As Jason and I noted on Friday, the NASDAQ Composite broke out to new highs with less than 50% of their members above their 200 day averages:
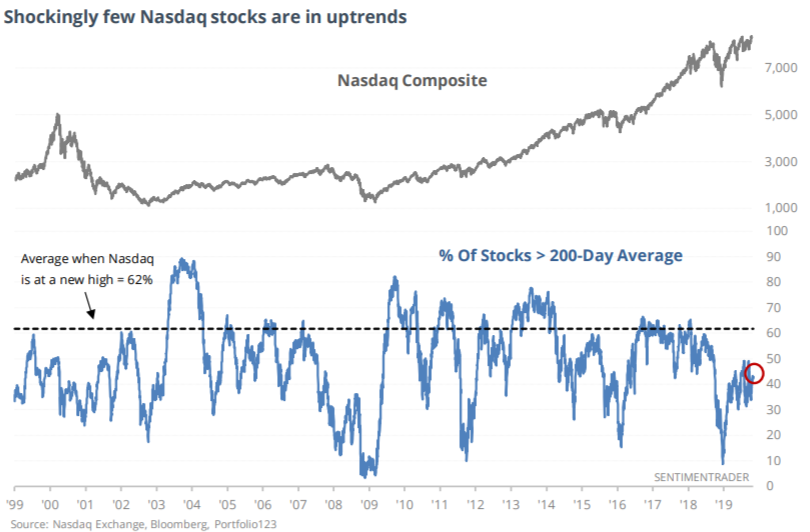
Although this happened in 1999 and 2007, there were also other false bearish signals:
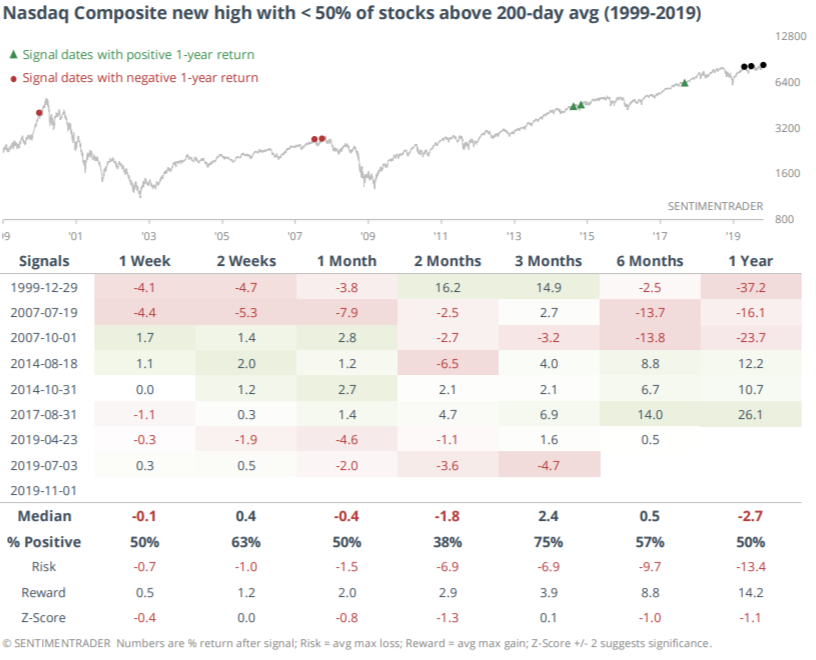
Overall, we'd consider this to be a minor bearish factor for stocks.
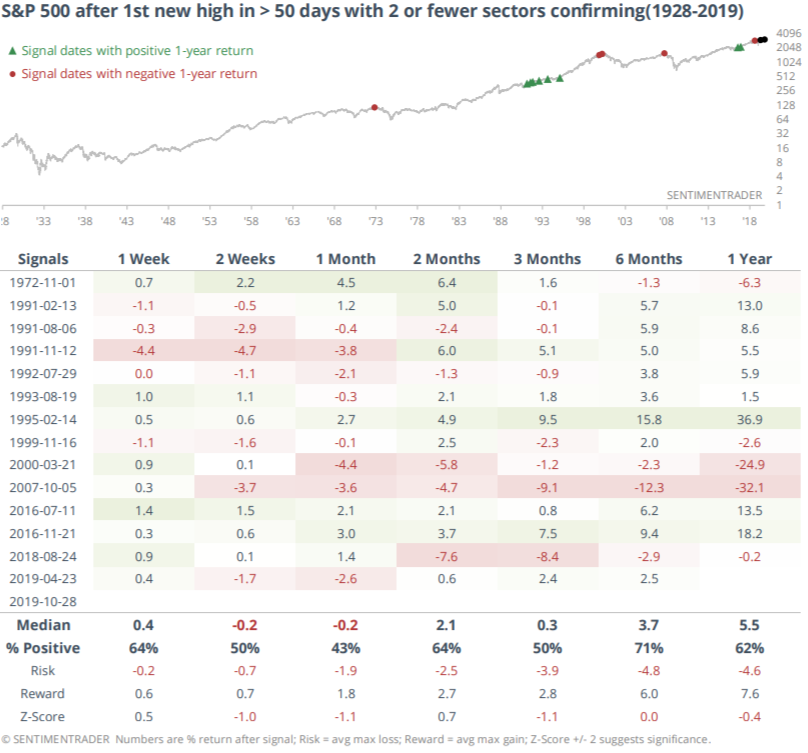
Similarly, Jason noted that while the S&P 500 hit new highs, relatively few of its sectors broke out along with the index.
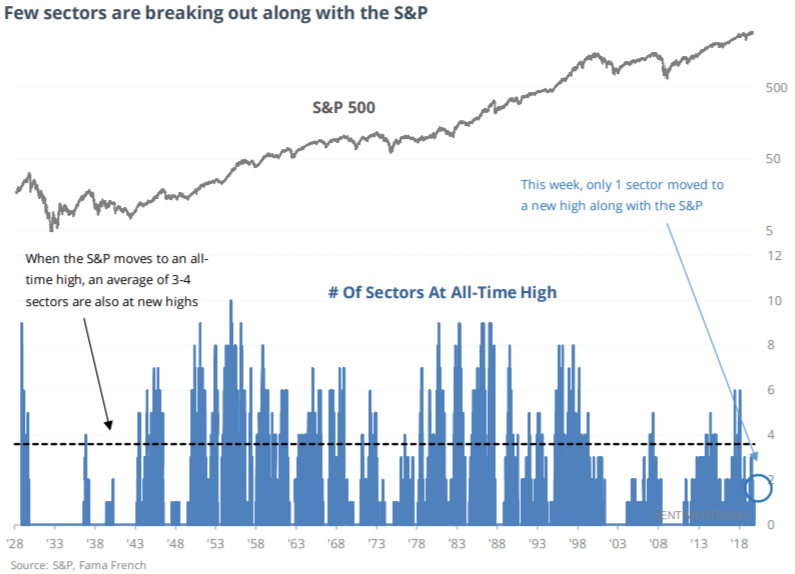
While this wasn't consistently bearish for stocks, forward returns over the next 3-12 months were worse than random:
To recap
- Long term risk:reward doesn’t favor bulls.
- Fundamentals (6-12 months): still bullish because there is no significant U.S. macro deterioration.
- Technicals (3-6 months): neutral/bullish
Got any questions/comments? Feel free to email me at [email protected]