
What I'm looking at - Chemical Activity Barometer, Risk Appetite, Sensex, NASDAQ breadth
Here's what I'm looking at:
Chemical Activity Barometer
The Chemical Activity Barometer - a useful leading indicator for Industrial Production - is still trending downwards. Its 3 month average's year-over-year % change is now at -0.5%
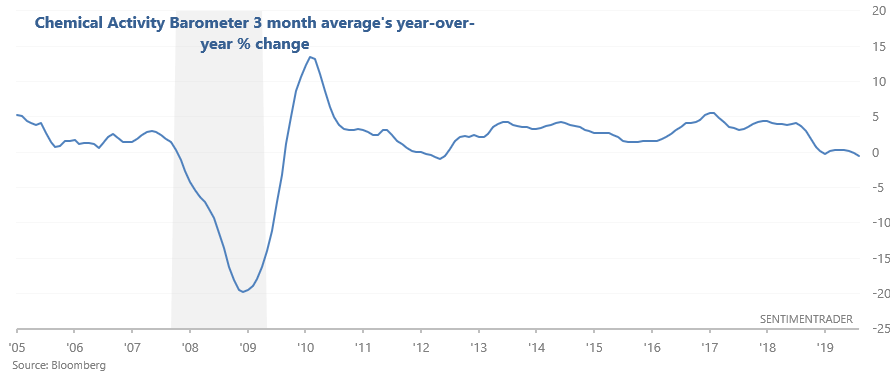
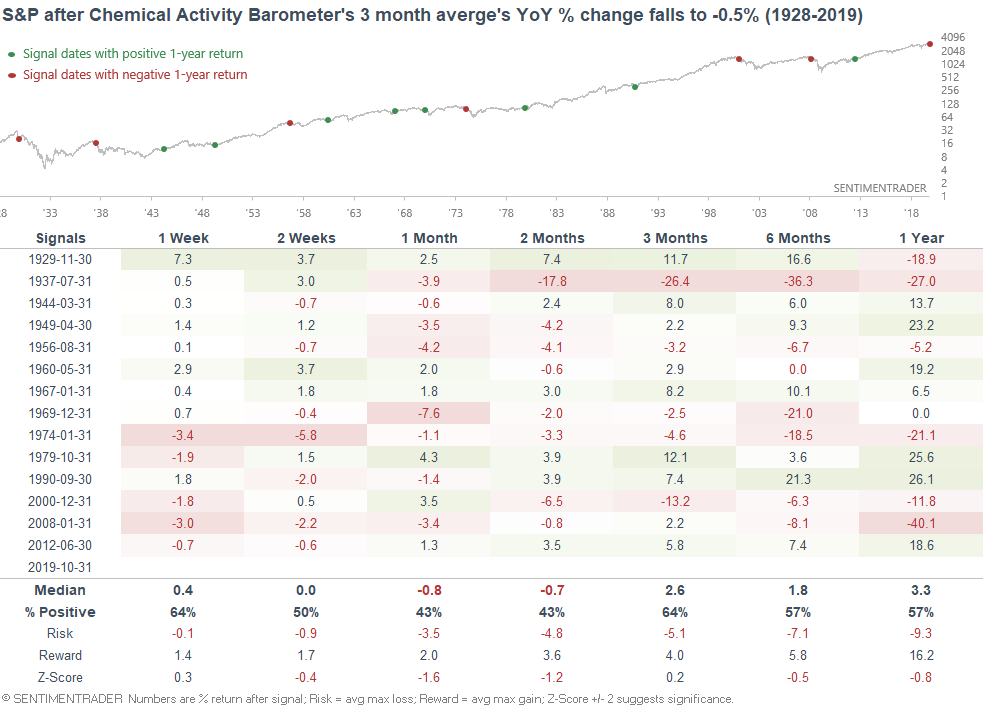
When this happened in the past, the S&P's forward returns weren't necessarily bearish, but were worse than random. Manufacturing-related data are weak points for U.S. macro right now:
Risk Appetite Index
2018's stock market crash and various fears this year (e.g. trade war, global slowdown) have put a dent on sentiment. As a result, our Risk Appetite Index was consistently low. But now that various fears are subsiding, our Risk Appetite Index's 200 dma is trending higher.
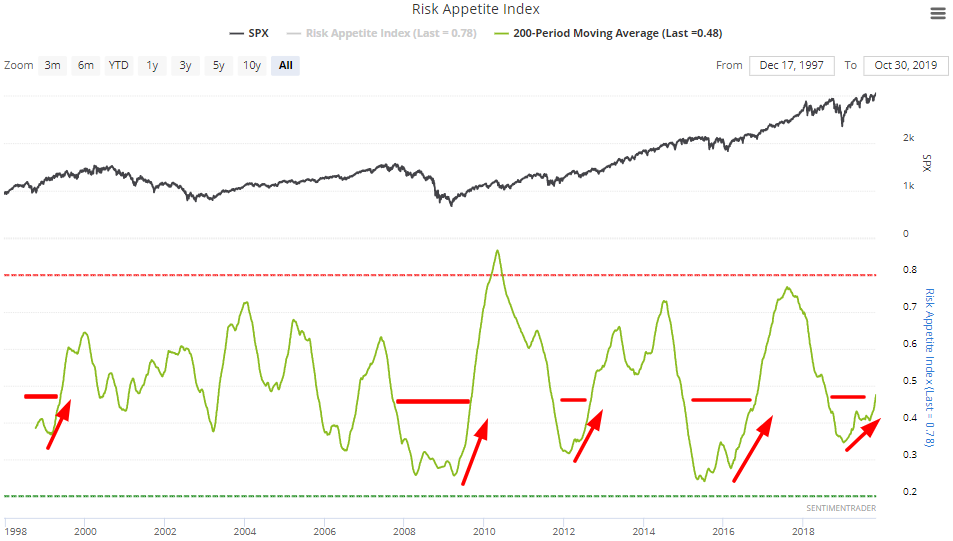
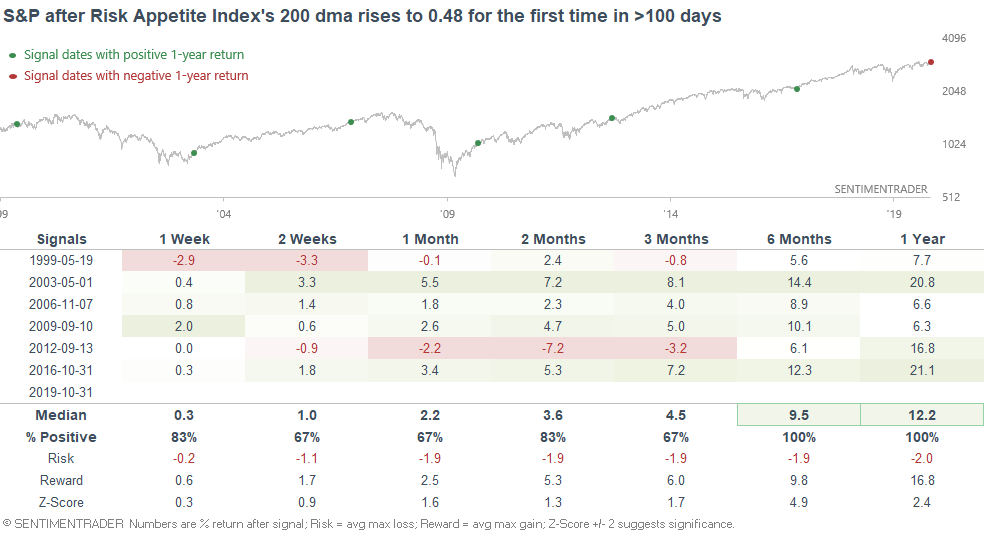
Our Risk Appetite Index's 200 dma has risen above 0.48 for the first time in 330 days. When this happened in the past (typically after major market crashes within the past year), the S&P surged over the next 6-12 months:
Indian equities
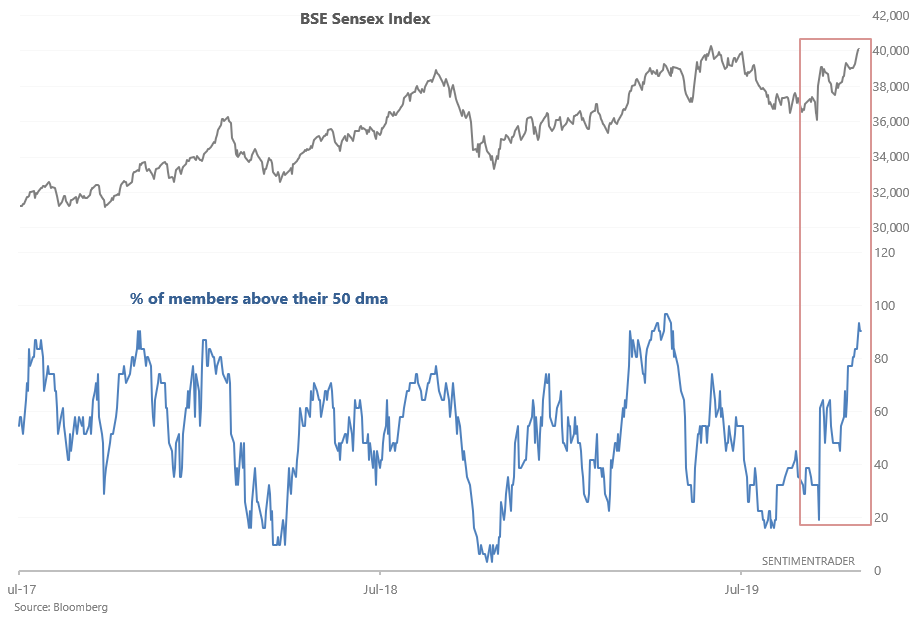
Continuing with our theme of breakouts in various foreign equity markets,the BSE Sensex Index (one of two main Indian equity indices) is trending higher. This has recently pushed the % of Sensex members above their 50 dma to more than 93%. In other words, a surge in breadth:
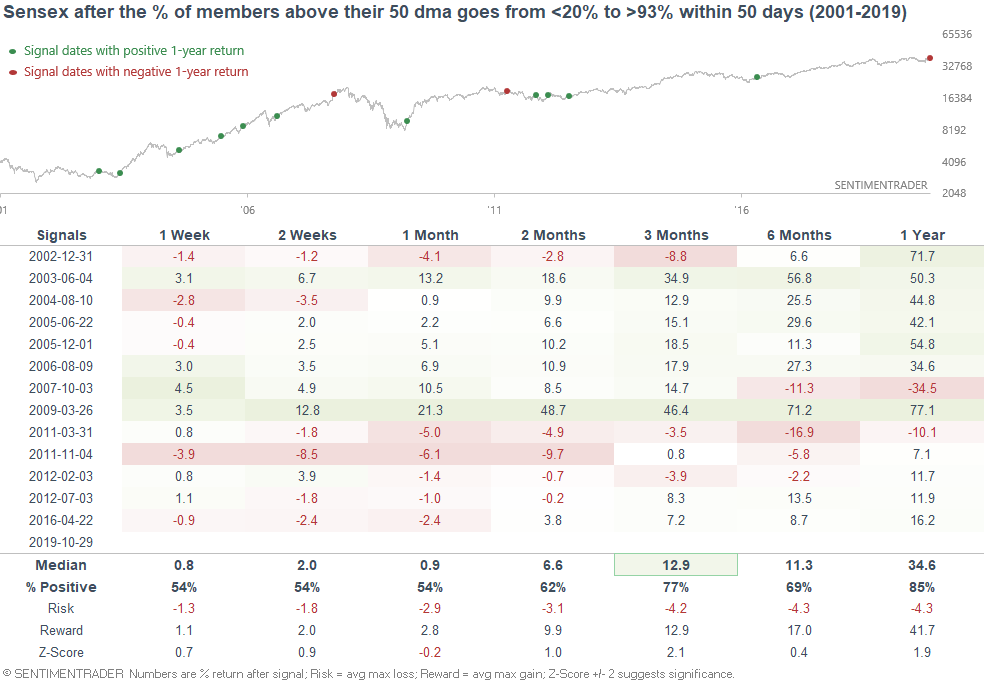
When the % of Sensex members above their 50 dma went from less than 20% to more than 93% in less than 50 days, the Sensex Index typically rallied over the next 3 months:
NASDAQ breadth
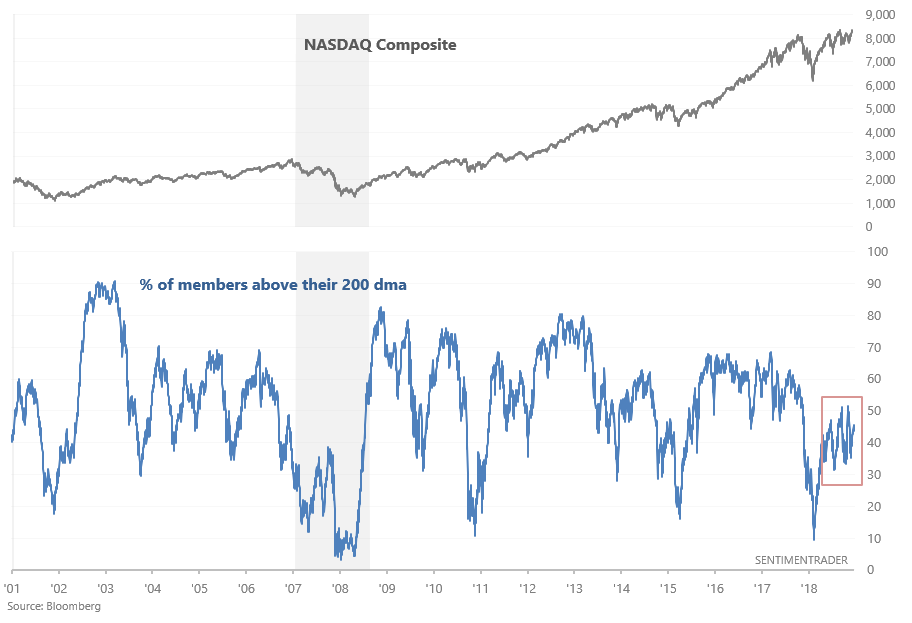
As Mark Minervini noted, the NASDAQ Composite's breadth is weak. While the NASDAQ Composite was recently close to an all-time high, the % of members above their 200 dma is under 50%!
If we look at every single day in which the NASDAQ Composite was within 0.1% of a 1 year high, while the % of members above their 200 dma was less than 50%, the NASDAQ's forward returns were indeed bearish:
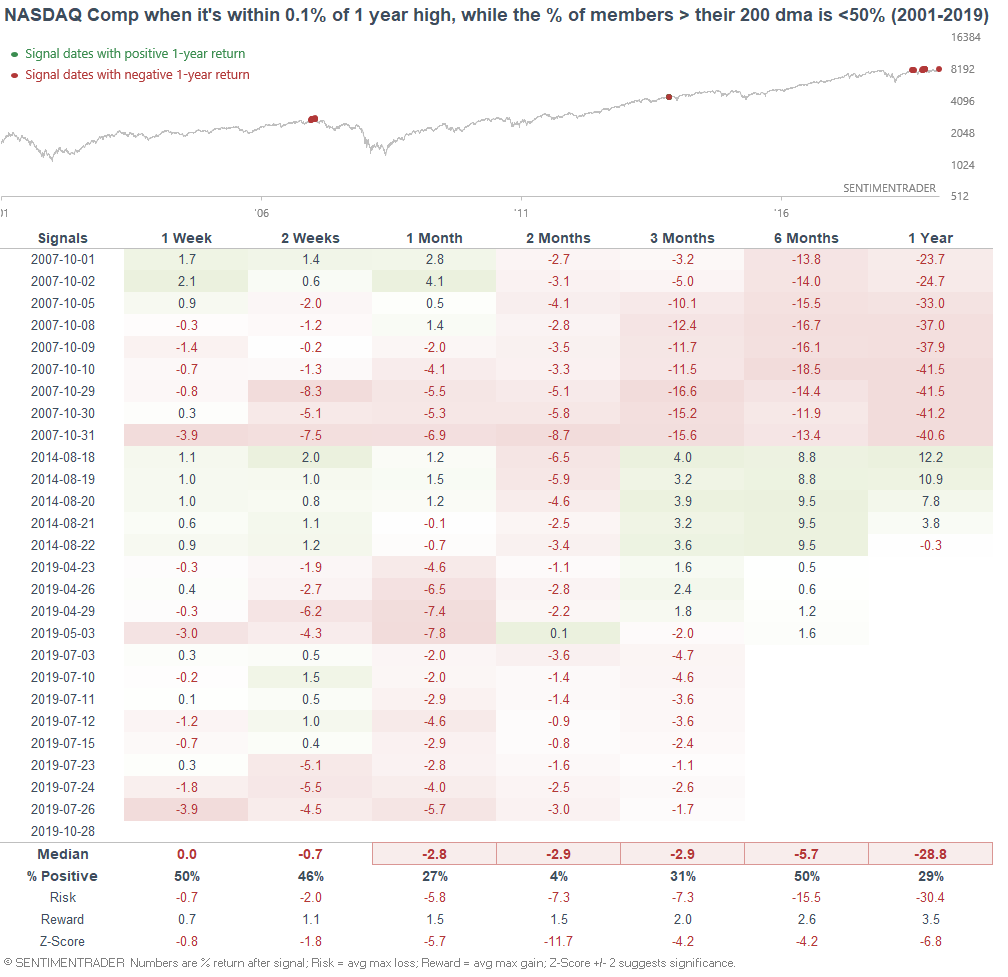
However, most of these dates were overlaps. So if we exclude overlapping signals over the past month...
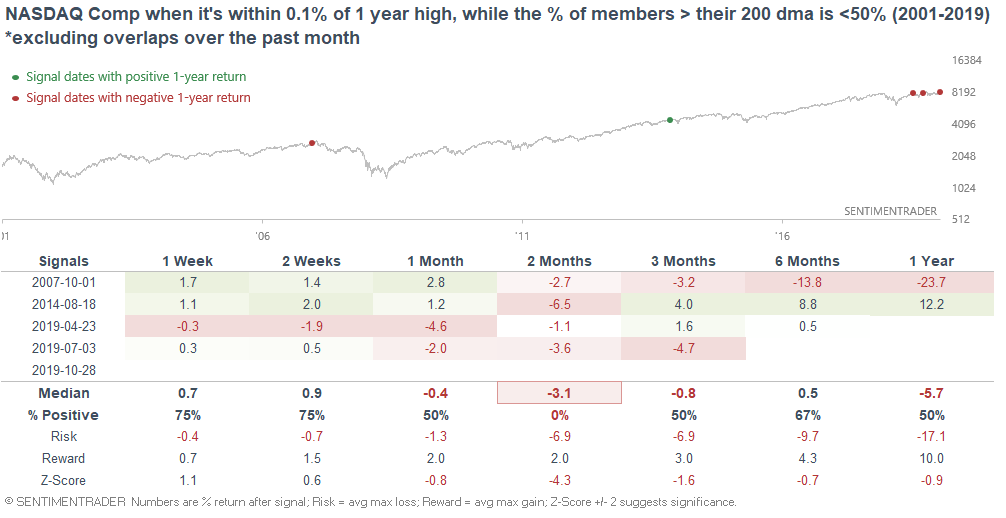
The NASDAQ Composite's forward returns were still weak, but not quite as bearish. Moreover, the sample size isn't big.
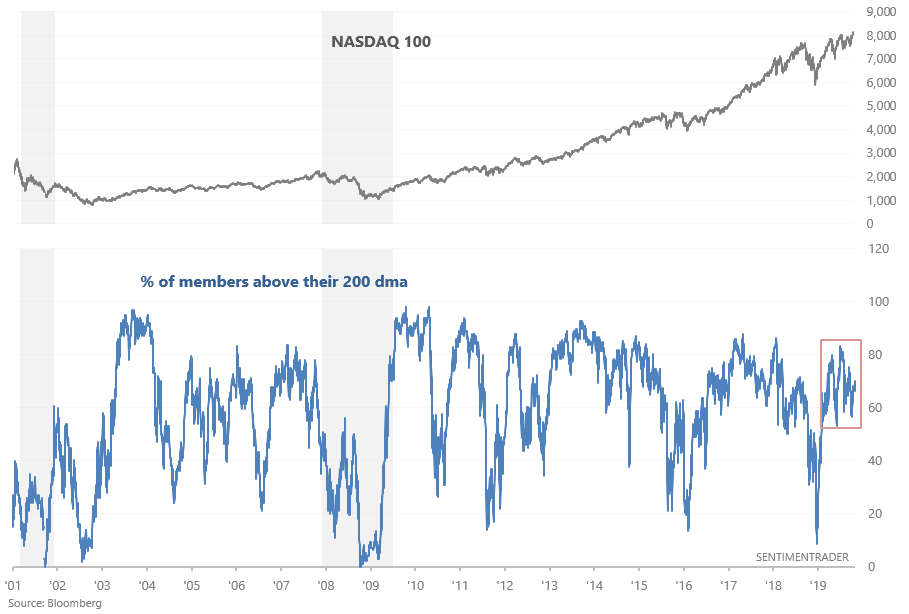
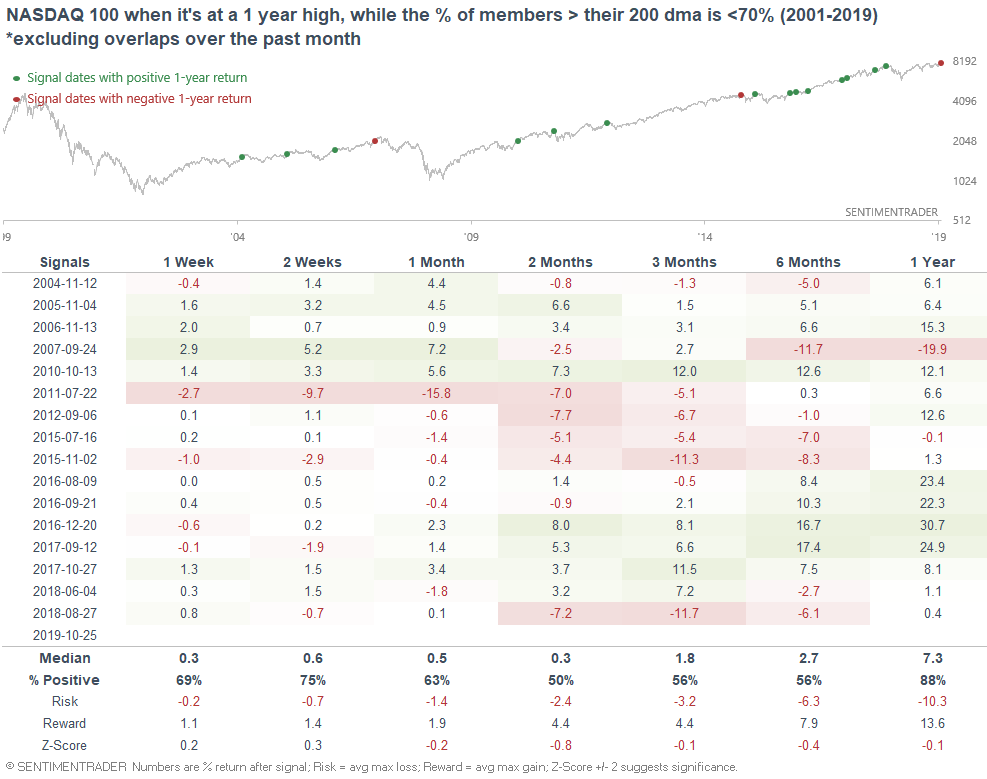
Jason Leavitt also noted that while the NASDAQ Composite's breadth is weak, the NASDAQ 100's breadth isn't that bad. The NASDAQ 100 was recently at an all-time high, and the % of members above their 200 dma was just under 70%:
When this happened in the past, the NASDAQ 100's forward returns over the next few months weren't great, but weren't quite consistently bearish either.
So what's going on? Why the discrepancy between the NASDAQ Composite and NASDAQ 100?
As Jason mentioned a few days ago, the NASDAQ Composite's breadth is almost always terrible. The NASDAQ leans heavily towards tech, and many tech companies compete in winner-take-all spaces. (Think network effects - the more you grow and reinvest in your business, the exponentially harder it becomes for a competitor to catch up.) Winner-take-all industries will see weak breadth since most companies will shrink or die off, and one big winner will dominate the field.
On a side note, this is why I don't use factor investing in my own portfolio. In my opinion, factor investing cannot pick up on a lot of nuances. While small cap outperformed in the past, perhaps there is a structural reason as to why this won't be the case in the future:
Yes, by definition small cap companies are going to grow faster than large cap companies (trees don't grow to the sky). Every big, successful company started off small. But small cap companies ≠ small cap stocks. More and more high growth startups are staying private until they reach large cap stage. This means that public market investors often can't benefit from the best small cap companies. By the time these companies go public, most of their % growth has already occurred.
For example, Microsoft IPO'd in 1986 at a market cap of $777 million, which even when adjusted for inflation, is laughable for what Facebook and other successful tech companies have gone public at.
Anyways, just some food for thought. What worked in the past may not work in the future, and there is often a structural reason as to why things change. Do not take indicators at face value - think about WHY they are bullish/bearish, and what are the underlying assumptions behind the indicator.