
Interest rates and trend-following - part III

Key Points
- Interest rate trends tend to be multiple decade affairs
- Focusing on the long-term trend in yields - combined with a simple measure of small-cap stocks versus large-cap stocks - can offer valuable clues to investors regarding whether or not to favor bonds and whether to shorten or lengthen maturities
A Review of two indicators
In Part I, we highlighted Indicator #1. This indicator involved subtracting the 120-month exponential moving average for the 10-year treasury yield (once a month using month-end data) from the current month-end yield for the 10-year treasury note.
- Readings above 0 indicate a "rising rates" environment
- Readings below 0 indicate a "falling rates" environment
At the end of November, the 10-year treasury yield stood at 1.79% and the 120-month EMA at 2.16%. As a result, this indicator is in "falling rates" mode.
In Part II, we highlighted Indicator #2. This indicator involves calculating a 2-month EMA and 7-month EMA of the small-cap/large-cap ratio (calculated at month-end) and then subtracting the 7-month EMA from the 2-month EMA.
- Readings above 0 indicate a "rising rates" environment
- Readings below 0 indicate a "falling rates" environment
At the end of November, the 2-month EMA minus 7-month EMA reading was negative. As a result, this indicator is also in "falling rates" mode.
Combining the two indicators
We will do the following at the end of each month:
- If Indicator #1 > 0 then A = +2 else A = 0
- If Indicator#2 > 0 then B = +1 else B = 0
- C = A + B
Value C can end a month reading +3, +2, +1 or 0. If both indicators point to rising rates, then C will equal +3. If both indicators point to lower rates, then C will equal 0. Combined indicator readings of +1 and +2 are considered "neutral."
The current reading for our combined indicator (Value C) is 0. Does this have any practical value? Let's consider the movement of 10-year treasury yields based on different combined indicator readings.
Measuring yield movements
Our goal is to determine how well our indicators track the trend in interest rates, not necessarily the exact impact on bond prices. In measuring results, we will look solely at changes in bond yields. So, for example, if yields rise from 4% to 5%, we will note that as an increase of 1.00 yield points. Conversely, if yields fall from 8% to 7%, we will note that as a decrease of 1.00 yield points.
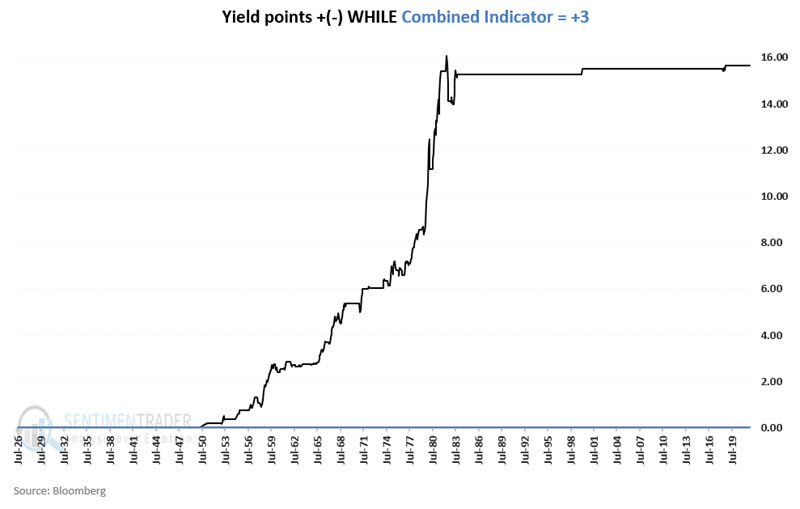
Combined Indicator readings of +3 indicate that Indicator #1 and Indicator #2 are in "rising rates" mode. The chart below displays the cumulative gain/loss in yield points while the Combined Indicator = +3.
During the rising rate environment from the early 1950s into the early 1980s, rates rose steadily and significantly. At the same time, the combined indicator was equal to +3.
In a real-world application, when the combined indicator = +3, investors might consider sticking to shorter-term maturity bonds and avoiding long-term bonds.
At the other end of the spectrum, combined indicator readings of 0 indicate that Indicator #1 and Indicator #2 are in "falling rates" mode. The chart below displays the cumulative gain/loss in yield points while the Combined Indicator = 0.
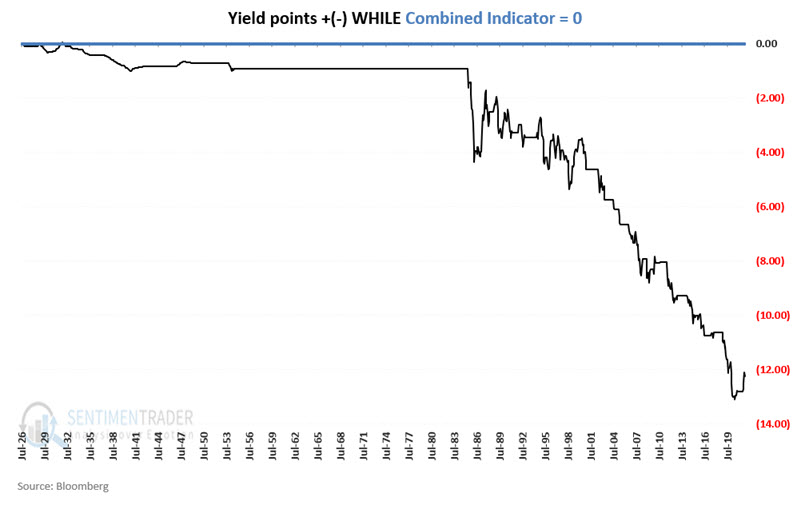
During the falling rate environment starting in the mid-1980s, rates declined steadily from the mid-1980s to the present while the combined indicator was equal to 0.
In a real-world application, when the combined indicator = 0, investors can consider extending maturities and holding longer-term bonds.
Combining +3 and 0 Combined Indicator readings
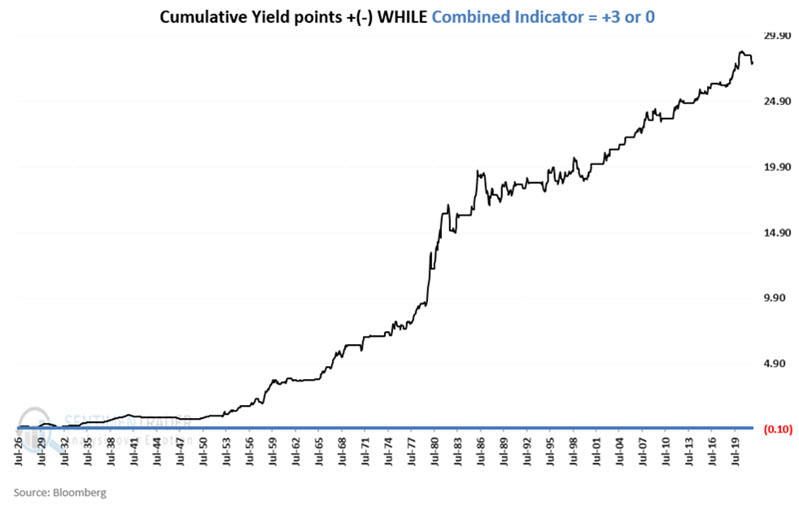
To measure the efficiency of the Combined Indicator, let's use the following methodology:
- Add changes in yield points if the Combined Indicator reading is +3
- Subtract changes in yield points if the Combined Indicator reading is 0
The chart below displays the cumulative gain/loss in yield points ONLY when the Combined Indicator reading is +3 or 0.
What the research tells us…
Interest rates tend to rise when the combined indicator = +3 and tend to decline when the combined indicator = 0. The first takeaway is that investors should avoid long-term bonds and stick to shorter-term securities (or floating rate debt, or avoid bonds altogether) when the combined indicator = +3. The second takeaway is that investors seeking maximum gains can extend maturities when the combined indicator = 0, which is where it was at the end of November.