Data &
Technology
Research
Reports
Report Solutions
Reports Library
Actionable
Strategies
Free
Resources
Simple Backtest Calculator
Simple Seasonality Calculator
The Kelly Criterion Calculator
Sentiment Geo Map
Public Research Reports
Free Webinar
Pricing
Company
About
Meet Our Team
In the News
Testimonials
Client Success Stories
Contact
Log inLoginSign up
< BACK TO ALL REPORTS

Interest rates and trend-following - part I

Jay Kaeppel
2021-12-14
Identifying the trend for interest rates is usually more valuable than a treasure chest full of predictions. Here, we look at a simple trend-following method for staying on the right side of the interest rate trend.

Key Points

  • Interest rates tend to rise and fall in decade-long cycles
  • A simple trend-following method can be beneficial in keeping investors on the right side of the long-term trend
  • Using a 120-month exponential moving average kept investors on the right side

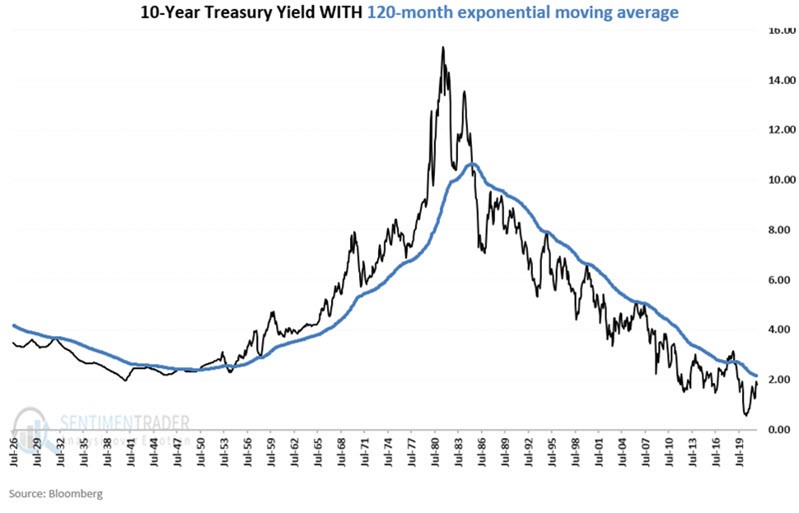
Indicator #1: 10-Year Treasury yield versus 120-month EMA

The chart below displays the month-end yield for 10-year treasury notes since July 1926, along with its 120-month exponential moving average.

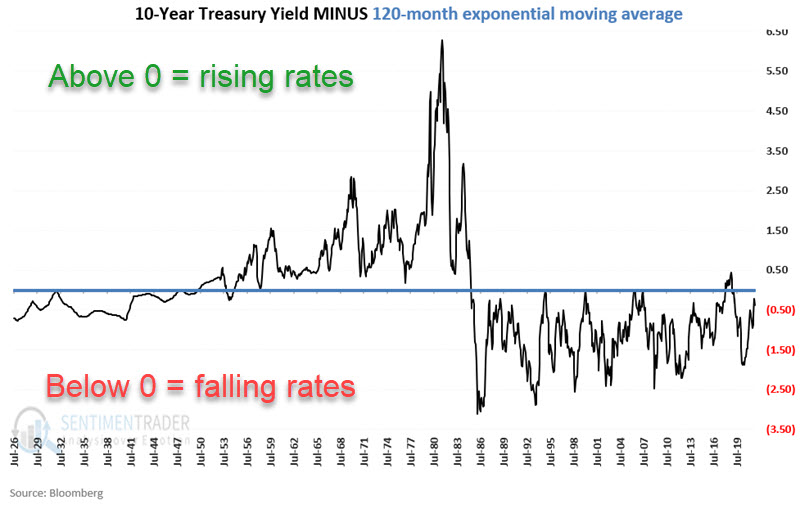
The next chart showsthe month-end yield for 10-year treasury notes since 1913 minus its 120-month exponential moving average. This value fluctuates above and below 0. When the reading is above 0 it implies that interest rates are in an uptrend, and when the reading is below 0, it implies that interest rates are in a downtrend. The good thing about interest rate trends is that they tend to persist for a very long period of time.

Measuring trend-following results

Our goal is to determine how well our indicators track the trend in interest rates, not necessarily the exact impact on bond prices. In measuring results, we will look solely at changes in bond yields. So, for example, if yields rise from 4% to 5%, we will note that as an increase of 1.00 point in yield. Conversely, if yields fall from 8% to 7%, we will note that as a decrease of 1.00 point in yield.

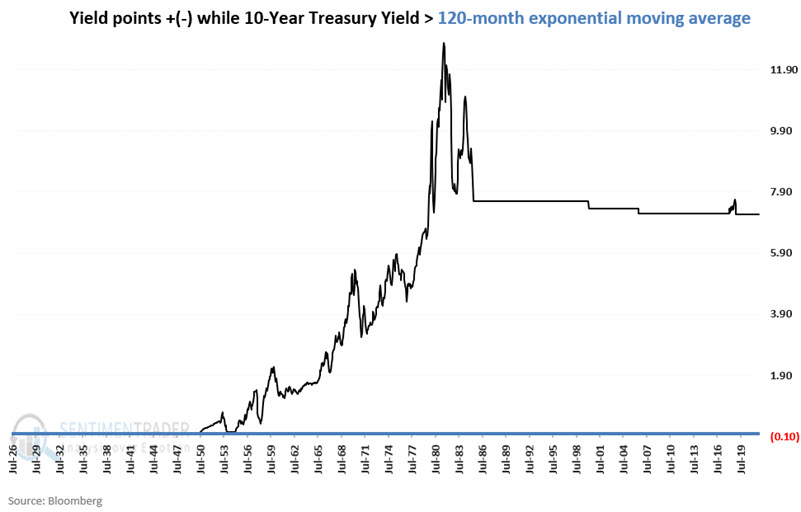
The chart below displays the cumulative gain/loss in yield points while the chart above is above 0, i.e., when the 10-year yield is above its 120-month EMA. This simple measure stayed with the rising rate trend from the late 1940s through the peak in the early 1980s before giving back some of its gains as rates fell hard from 1982 to 1985. In the past 20 years, there have been a handful of small whipsaws. That is the nature of most moving average-based methods.

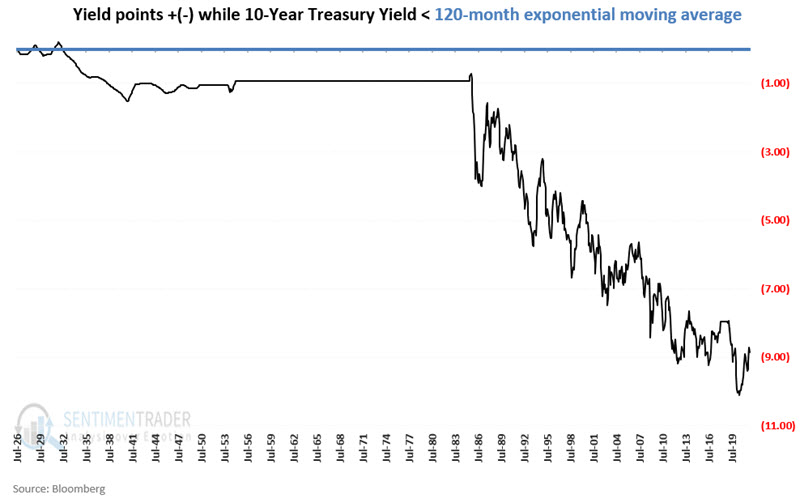
The chart below displays the cumulative gain/loss in yield points while the chart above is below 0, i.e., when the 10-year yield is below its 120-month EMA. 

To measure the efficiency of this simple method for tracking interest rates, let's use the following methodology:

  • Add changes in yield points if the 10-year yield is ABOVE its 120-month EMA
  • Subtract changes in yield points if the 10-year yield is ABOVE its 120-month EMA

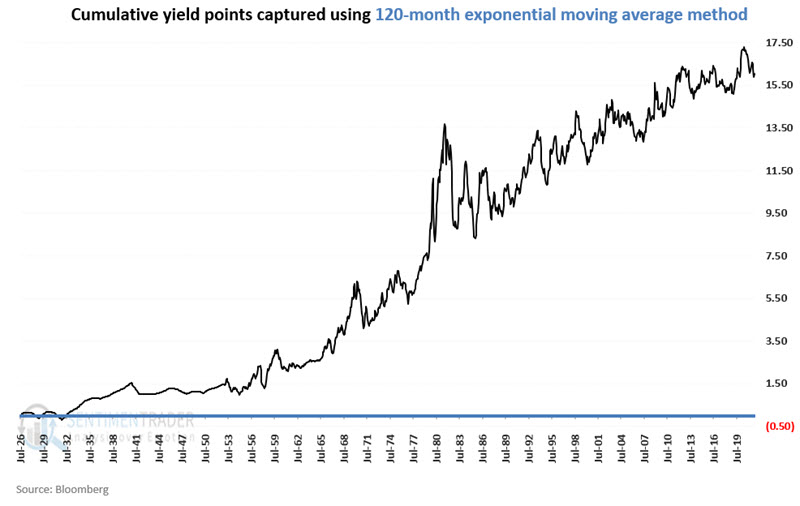
The chart below shows the cumulative yield points captured using the 120-month EMA method since 1926.

The chart below displays the same information as the last chart and the cumulative net change for the 10-year treasury yield since 1926. 

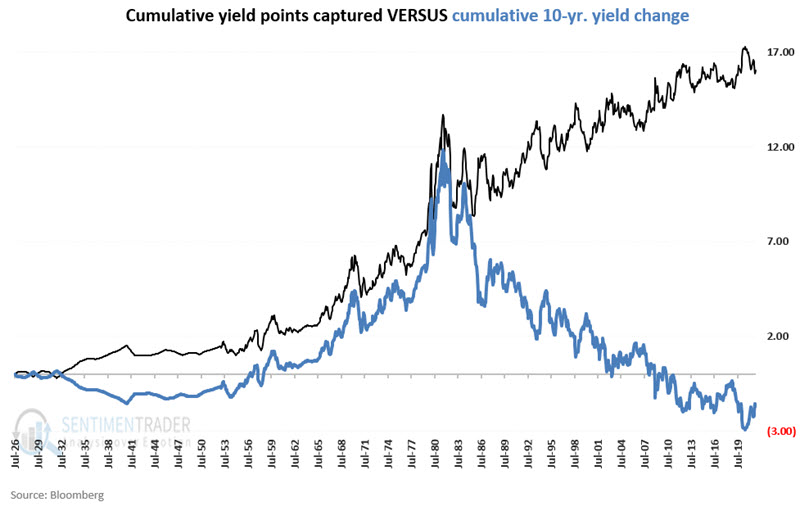
Since July 1926, the 10-year treasury yield rose from 3.48% to a high of 15.32% by 1981 before falling to 1.79% at the end of November 2021. In other words, 10-year treasury yields have fallen -1.69% since July 1926; hence the blue line in the chart above is negative.

What the research tells us...

Interest rates tend to move in extremely long-term waves. A simple trend-following approach appears to do an excellent job of keeping investors on the correct side of interest rate trends. At the end of November 2021, the trend for interest rates is still deemed as falling, with the 10-year yield at 1.79% and the 120-month EMA at 2.16%.

Sorry, you don't have access to this report

Upgrade your subscription plan to get access
Go to Dasboard
DATA &
TECHnologies
IndicatorEdge
‍
BackTestEdge
‍
Other Tools
‍
DataEdge API
RESEARCH
reports
Research Solution
‍
Reports Library
‍
actionable
Strategies
Trading Strategies
‍
Smart Stock Scanner
‍
FREE
RESOUrCES
Simple Backtest
Calculator
Simple Seasonality
Calculator
The Kelly Criterion
Calculator
Sentiment Geo Map
‍
Public Research Reports
‍
Free Webinar
COMPANY
‍
About
‍
Meet our Team
‍
In the News
‍
Testimonials
‍
Client Success Stories
Pricing
Bundle pricing
‍
Announcements
‍
FAQ
© 2024 Sundial Capital Research Inc. All rights reserved.
Setsail Marketing
TermsPrivacyAffiliate Program
Risk Disclosure: Futures and forex trading contains substantial risk and is not for every investor. An investor could potentially lose all or more than the initial investment. Risk capital is money that can be lost without jeopardizing ones’ financial security or life style. Only risk capital should be used for trading and only those with sufficient risk capital should consider trading. Past performance is not necessarily indicative of future results.

Hypothetical Performance Disclosure: Hypothetical performance results have many inherent limitations, some of which are described below. No representation is being made that any account will or is likely to achieve profits or losses similar to those shown; in fact, there are frequently sharp differences between hypothetical performance results and the actual results subsequently achieved by any particular trading program. One of the limitations of hypothetical performance results is that they are generally prepared with the benefit of hindsight. In addition, hypothetical trading does not involve financial risk, and no hypothetical trading record can completely account for the impact of financial risk of actual trading. for example, the ability to withstand losses or to adhere to a particular trading program in spite of trading losses are material points which can also adversely affect actual trading results. There are numerous other factors related to the markets in general or to the implementation of any specific trading program which cannot be fully accounted for in the preparation of hypothetical performance results and all which can adversely affect trading results.

Testimonial Disclosure: Testimonials appearing on this website may not be representative of other clients or customers and is not a guarantee of future performance or success.