
HON Yes, HON No

In a recent piece, we highlighted the use of a bull call spread or a bear put spread to express an opinion on market direction for ticker ROKU. In this piece, we discuss using a directional calendar spread to express an opinion on market direction for ticker HON.
Trading opportunities - like beauty - are in the eye of the beholder. Take HON (Honeywell International, Inc.), for instance.
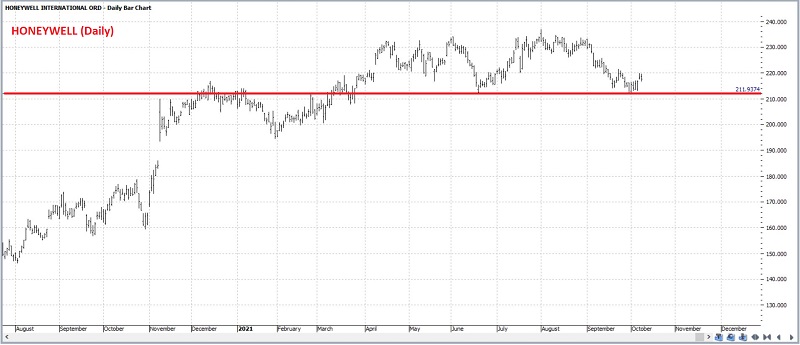
One trader will look at the daily chart below (courtesy of ProfitSource) and see a stock that has just "successfully tested support and is ready for the next leg up."
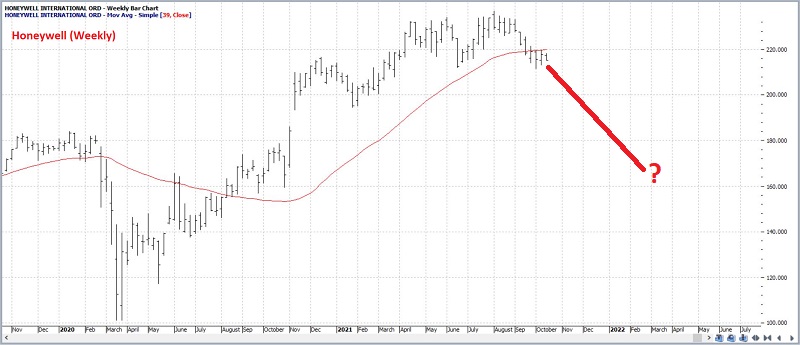
Another trader will look at the weekly chart of Honeywell below and see a stock that "is in the early stages of a long, hard fall."
 Who will be right, and who will be wrong? It beats me. But whatever happens, there is an opportunity at the moment.
At the same time, the problem for many traders is that HON is trading at around $215 a share. So, to buy 100 shares of stock requires a commitment of $21,500. Likewise, selling short 100 shares of HON would involve meeting and maintaining a hefty margin requirement (not to mention the assumption of unlimited risk). So, let's consider alternatives for both scenarios.
We will look at a bullish call calendar spread, and a bearish put calendar spread for this piece. As always, the examples that follow are just that - examples - and NOT "recommendations."
HON YES
Our example bullish trade involves:
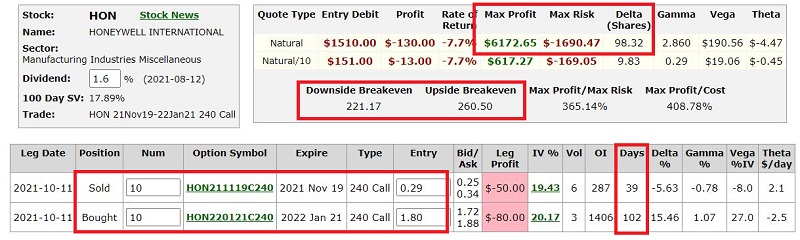
- Buying 10 HON Jan21 240 calls @ $1.80
- Selling 10 HON Nov19 240 calls @ $0.29
The particulars and risk curves appear in the screenshots below (courtesy of Optionsanalysis)
Things to note:
- At the time of entry, this trade has 39 days left until the November expiration
- Buying a 10 lot gives this trade a delta of 98.32. This means that (for now) this position will behave like a position holding 98+ shares of HON.
- The cost to enter this trade with a 10-lot is $1,690 (versus $21,500 to buy 100 shares of HON stock).
- The maximum profit potential is approximately $6,1732 if HON is at $240 a share at November options expiration (this number could rise or fall if option implied volatility increases or decreases before November expiration).
- The maximum risk is -$1,690 if HON plummets or soars before November expiration.
- If volatility remains unchanged at November options expiration, this trade will show a profit if HON is between $221.17 and $260.50 a share.
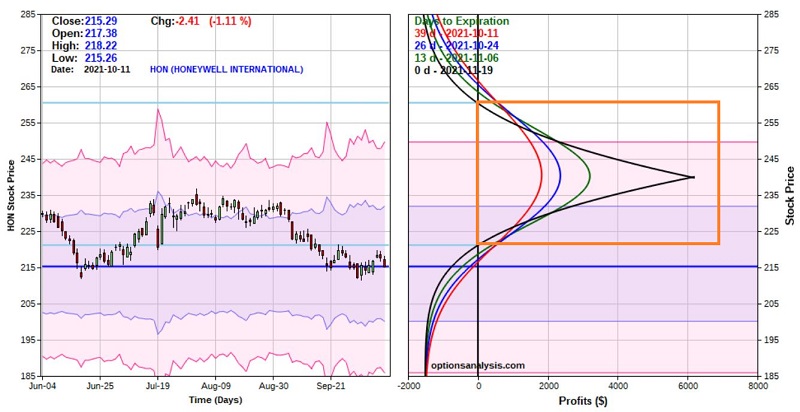
Note the profit zone highlighted in the orange box in the risk curves chart above. Note also how losses accrue outside of that zone - both to the upside AND the downside.
Now let's talk real-world trading.
A trader might consider this trade if they expect:
- The recent support level to hold
- AND that HON will move higher - but NOT dramatically so - in the next 39 days.
The goal is for HON to remain within the profit range as time decay to eats away at the time premium built into the price of the November calls (held short) while the January calls (held long) retain the bulk of their time value.
To witness the effect of time decay on this position, note how each of the colored lines moves to a higher profit level within the profit zone of $221 to $261 in the risk curve chart above.
From a position management perspective, a trader might resolve to:
- Cut a loss if HON stock drops below the support level below the recent lows. The sooner this level is taken out, the smaller the loss.
- Take a profit if HON stock approaches the $235-$240 level - i.e., near the recent high in price AND at the point where the risk curves would begin to "roll over."
HON NO
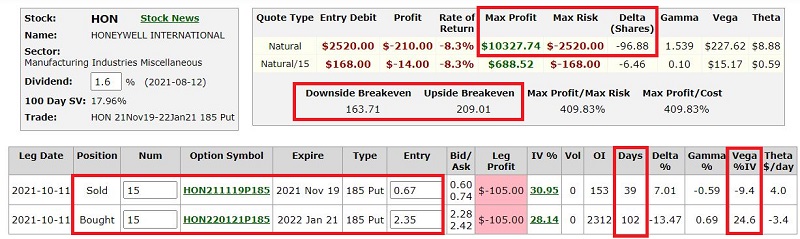
Our example bearish trade involves:
- Buying 3 HON Mar18 300 puts @ $2.35
- Selling 3 HON Mar18 200 puts @ $0.67
The particulars and risk curves appear in the screenshots below (courtesy of Optionsanalysis)
 Things to note:
- At the time of entry, this trade has 39 days left until November expiration.
- Buying a 15-lot gives this trade a delta of -96.88. This means that (for now) this position will behave like a position holding short 97 shares of HON.
- The maximum profit potential is approximately $10,328 if HON is at $185 a share at November options expiration (this number could rise or fall if option implied volatility increases or decreases before November expiration).
- The maximum risk is -$2,520 (if HON plummets or soars before November expiration).
- If volatility remains unchanged at November options expiration, this trade will show a profit if HON is between $163.71 and $209.01 a share.
Note the profit zone highlighted in the orange box in the risk curves chart above. Note also how losses accrue outside of that zone - both to the upside AND the downside.
Once again, let's talk real-world trading.
A trader might consider this trade if they expect:
- The recent support level to NOT hold
- AND that HON will move lower - but NOT dramatically so - in the next 39 days.
The goal is for HON to remain within the profit range as time decay to eats away at the time premium built into the price of the November puts (held short) while the January puts (held long) retain the bulk of their time value.
To witness the effect of time decay on this position, note how each of the colored lines moves to a higher profit level within the profit zone of $164 to $209 in the risk curve chart above.
A trader might resolve to:
- Cut a loss if HON stock moves a certain level higher and/or a loss of a specific predetermined "uncle" point is reached.
- Take a profit if HON stock approaches the $185-$190 level (i.e., near the point where the risk curves would begin to "roll over."
AN ADDITIONAL POINT REGARDING VOLATILITY
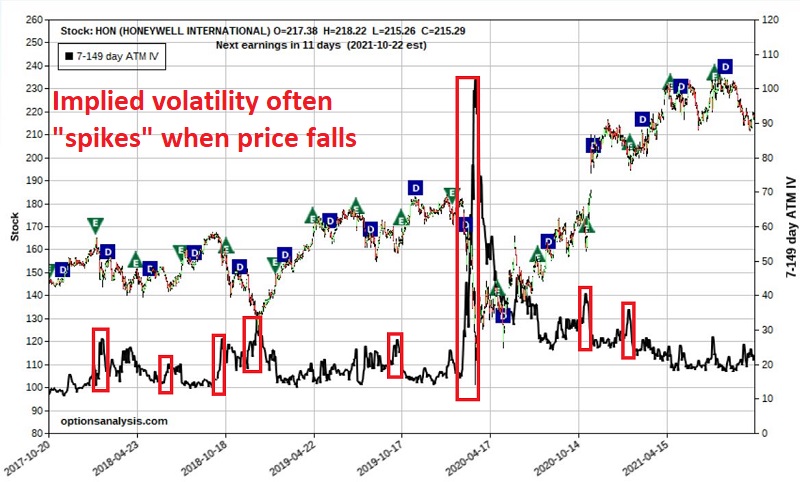
There can be an added advantage to trading bearish put calendar spreads. The implied volatility of the options on a given stock often - though importantly, not always - tend to "spike" higher when the price of the underlying stock falls (this highlights an increase in "fear" among traders as they bid up en masse the price of protective put options). Note that:
- An increase in implied volatility after a calendar spread is entered will typically serve to inflate the value of the position
- A decrease in implied volatility after a calendar spread is entered will typically serve to deflate the value of the position
To illustrate this, first glance at the chart below (also courtesy of Optionsanalysis) that displays HON stock price along with the implied volatility for options on the stock. Note how volatility often (though, again, not always) "spikes" higher when price declines.
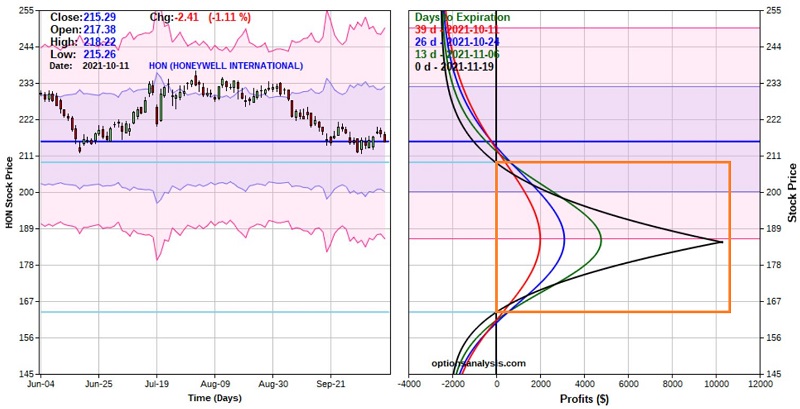
 The chart below displays the original risk curves for our HON put calendar spread displayed above.
 Note:
Note:
- The expected maximum profit of $10,328
- The profit range of roughly $164 to $209
Now, let's assume that the implied volatility of HON options "spikes" 30% higher than their current level during the life of this trade. The net effect is that:
- The longer-term January puts that we hold long will gain more time premium (because they have a higher "Vega")…
- …Than the November options that we are short (because they have a lower "Vega")
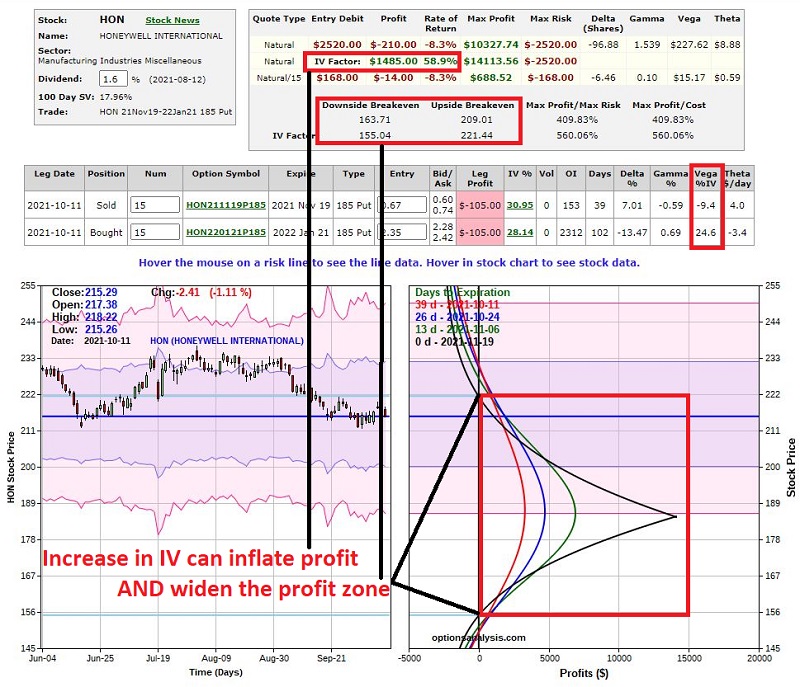
On the right-hand side of the screenshot below, locate the red box highlighting "Vega %IV" for each option:
- The long put has a Vega of 24.6. This means that for each 1 percentage point increase in IV, the long put will gain $24.60 in value due solely to the increase in volatility
- The short put has a Vega of -9.4. This means that for each 1 percentage point increase in IV, the short put will lose $9.40 in value due solely to the increase in volatility
So, in theory, a one percentage point increase in IV will inflate the value of this position by $15.20. However, it must be noted that the IV of different options can change by different amounts, so these expected dollar changes are estimates and not "guaranteed" amounts.
The bottom line: An overall increase in the IV for HON options would likely inflate the value of the overall position, as shown in the adjusted risk curve chart below.
 Note:
Note:
- The expected maximum profit is now $14,114
- The profit range has expanded roughly from $164 to $209 to a much wider range of $155 to $221
Trader's Note: A sharp spike in implied volatility often marks an excellent time to nail down profits on a calendar spread by selling all or at least part of the position.
SUMMARY
Will either of the trades highlighted above make money? I can't say. They are not presented as "hot trades" of the "you can't lose trading options variety." But each trade represents a potential opportunity for a trader:
- With a specific outlook for HON (bullish or bearish)
- Who does not want to or cannot afford to commit the capital to trade 100 shares of stock
- Desires limited, predefined risk